Abstract
A self-consistent tight-binding method is used to investigate the screening effects of semiconducting and metallic single-wall carbon nanotubes (SWCNTs) when the water molecules and various charged ions pass through the nanotubes. The trajectories of ions and water molecules are obtained from molecular dynamics simulations. It is shown that metallic SWCNTs have much stronger screening abilities than semiconducting SWCNTs. Our results indicate that it is possible to distinctly identify different ions and also to differentiate between armchair and zig-zag nanotubes.
Carbon nanotubes (CNTs) have many exquisite properties that can be exploited to develop next generation devices with high sensitivity, fast response, low cost, and large volume production.1, 2 Recently, CNT membranes have been demonstrated as ultraefficient gas and liquid transporters.3 The flow of a liquid on single-walled CNT (SWCNT) bundles has been shown to induce a voltage in the sample along the direction of the flow.4 CNTs have been used for various sensing applications-for example, as chemical sensors for selective detection of nitrogen oxide (NO2) and ammonia (NH3).5 Molecular dynamics (MD) simulations reveal that water and ions enter the hydrophobic interior of SWCNTs with a radius as small as a few nanometers by forming well-organized structures.6 Despite many successful predictions by MD simulations, the nanotube models used in existing MD simulations provide an incomplete description of nanotube electrostatics as they ignore the nanotube polarizability.7 SWCNTs can be semiconducting or metallic depending upon the tube diameter and the chirality.8 Among the general chiral (n,m) CNTs with infinite lengths, all armchair nanotubes and those with n−m=3j (j being a nonzero integer) are metallic. All others are semiconductors with band gap inversely related to the diameter of the nanotube. Prior studies have investigated screening effects of CNTs under uniform parallel and transverse electric fields.7, 8, 9, 10, 11 Semiconducting CNTs demonstrated significantly weaker screening compared to metallic CNTs. Relatively less efforts have been invested to study the polarizability and screening effects of CNTs under general electric fields generated by water dipoles and charged ions inside SWCNTs. In this paper, we investigate screening abilities of metallic and semiconducting SWCNTs when they are filled with water and various ions. The structure of water and ions inside the SWCNTs is obtained by performing MD simulations. The results from MD simulations are then used in tight-binding (TB) simulations to investigate the screening effects of metallic and semiconducting SWCNTs.
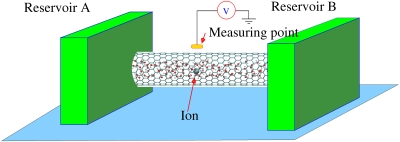
A schematic of the system is shown in Fig. 1. Positively and negatively charged monovalent and divalent ions such as Ca2+, K+, Cl−, , and together with water molecules, are transported from reservoir A to reservoir B through the CNT. We considered 5.3 nm long hydrogen-terminated (10,10) metallic and (16,0) semiconducting CNTs attached to reservoirs at both ends (see Fig. 1). Both the CNTs have similar diameters [diameters of (16,0) CNT and (10,10) CNT are 1.253 and 1.356 nm, respectively] but different electronic properties. Geometry and atomic partial charges of the water molecules are assumed to be given by the simple point charge∕extended model.12 Partial charges of and ions are given by q(N)=−0.3451e, q(H)=+0.3363e, q(S)=+3.0637e, and q(O)=−1.2659e, respectively.13, 14 Small neutral molecules such as dimethyl ether CH3OCH3 [q(CH3)=+0.094e, q(O)=−0.188e] (Ref. 14) were also considered. For simplicity, we assume that the existence of CNT will not change the partial charges of the ions and water molecules. As water molecules and ions move from reservoir A to reservoir B under a concentration gradient or an electric field, the electrostatic potential is computed at a point outside the CNT to understand the screening of the electric field generated by the water molecules and ions inside the CNT. The electrostatic potential is measured at the point located above the center of the CNT at a distance of 0.15 nm from the nanotube surface. Water dipoles can also partially screen the electric field generated by the ions, however, when water and ions enter the hydrophobic interior of small diameter SWCNTs, water molecules form well-organized structures which can dramatically reduce the overall screening ability of water molecules,7 which makes the effective electronic potential generated by ions more complicated.
Figure 1.
Schematic of the system. Water and ions are transported from reservoir A to reservoir B through the CNT. The potential variation is detected as the hydrated ions pass through the CNT. The system can be used to detect the polarity of the ions as well as the rate of transport. The measuring point is located above the center of the CNT at a distance of 0.15 nm from the nanotube surface. The size of the simulation box for the (16, 0) CNT case is 3.20000×3.20000×8.69289 nm3 and for the (10, 10) CNT case is 3.20000×3.20000×8.7682 nm3. These simulation boxes are large enough to mimic a bulk water environment according to the work of Hummer et al. (Ref. 3).
Self-consistent TB calculations based on an sp3 orthogonal model are employed to calculate the electrostatic potential distribution as ions∕water molecules move through the CNTs. Ab initio methods are typically more accurate to predict the electronic properties of nanostructures. However, the high computational cost prevents their wide spread use for large structures. An alternative is to use TB methods, which are reasonably accurate but computationally more efficient compared to ab initio methods. Denoting by α and β the orbitals of the ith and jth atoms of CNT, respectively, the TB Hamiltonian element is given by
| (1) |
where are directly obtained from the table of Slater and Koster,15 ϵiα is the onsite energy of α th orbital, , is the external Coulomb potential, and is the Coulomb potential on atom i generated by the charge located at rk, which is expressed in a smoothed form as . U0=14.6 eV is the on-site Hubbard energy.16 The TB parameters for hydrogen and carbon atoms are adopted from Refs. 17, 18. In the self-consistent approach, an initial potential generated by ions and water dipoles is used to compute the total TB Hamiltonian from Eq. 1. After the total Hamiltonian is computed, the local density of states (LDOS) at atom rj, denoted by N(rj,E), can be expressed as the imaginary part of the diagonal elements of Green’s function matrix (see, e.g., Refs. 19, 20 for details),
| (2) |
The LDOS can be efficiently calculated from Green’s function by using Haydock’s recursion method,21 where the Green’s function is expressed as a continued fraction based on the local TB Hamiltonian.20 The LDOSs are then used to compute the corresponding atomic charge on atom j, q(rj) by
| (3) |
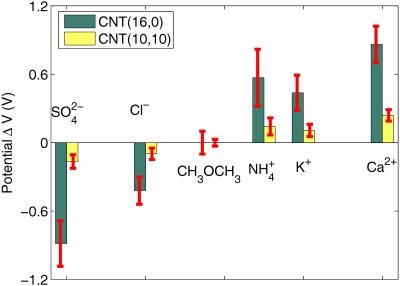
where if atom j is a carbon atom, the ionic core charge is Zc=4.0, and if atom j is a hydrogen atom, then Zc=1.0.16fe(E) is the Fermi–Dirac distribution for electrons. Next, the potential is updated by using the new charge distribution and the process is repeated until a self-consistent solution is obtained. In the MD simulations, the initial systems were equilibrated for 100 ps under a constant pressure of 1 bar and then switched to NVT ensemble. Nonequilibrium MD simulations were performed for ion transport to obtain the coordinates of water and the ions at intervals of 1 ps for TB simulation. After obtaining the coordinates of the charged molecules, the Coulomb potential ϕ(r) in Eq. 1 is computed to construct the TB Hamiltonian, then the TB equations [Eqs. 1, 2, 3] are solved self-consistently to get the new charge and potential distribution.20 In Fig. 2, three MD snapshots are shown to illustrate the transport of in the (16,0) semiconducting CNT from reservoir A to reservoir B. To compute the potential shown in Fig. 3, we compute the average potential at the measuring point as a reference potential before the ion enters the CNT. Next, once the ion enters the CNT, we denote the potential at the measuring point as perturbed potential which is a function of the ion position. The maximum potential difference between the perturbed and the reference potential for various ions with both CNTs is shown in Fig. 3.
Figure 2.
Three MD snapshots show location of ion as it traverses the (16,0) semiconducting CNT from reservoir A to reservoir B. In the top snapshot, ion is located at the entrance of the CNT, in the middle snapshot, ion is located in the central region of the CNT and in the bottom snapshot, ion is located near the exit region of the CNT.
Figure 3.
The maximum potential difference calculated at the measurement point in Fig. 1 for different ions and molecules as they pass through the CNT. Note that the (10,10) metallic CNT screens out the potential and a smaller potential is measured compared to the (16,0) semiconducting CNT. Neutral molecules generate much smaller potential than charged ions. Error bars on the calculated potential are also shown. These error bars arise because of the different MD trajectories.
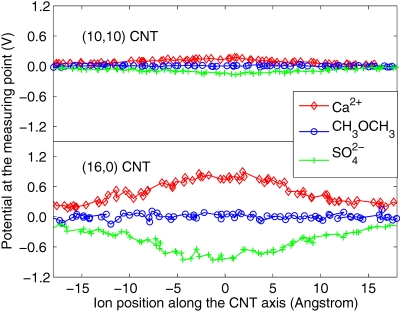
From the computed potential, the polarity and the valence of the ions can also be determined. For example, Ca2+ ions generate positive potential in both (10,10) and (16,0) CNTs. As the (10,10) CNT has much stronger screening ability compared to the (16,0) CNT, the potential computed with the (10,10) CNT (see Fig. 4 for variation of the potential at the measuring point with the position of the ion inside the CNT) is much smaller compared to that measured with (16,0) CNT (see Fig. 4 for variation of the potential with ion position inside the CNT). Similarly, ions generate negative potential in both CNTs. Ca2+ ions induce larger potential than K+ ions in both CNTs as Ca2+ ions have higher valency compared to the K+ ions. Neutral molecules induce much smaller potential compared to the charged molecules, as shown in Figs. 34. ion induces a slightly larger potential than K+ ion as the water molecules can screen out the field generated by K+ better than due to the smaller effective volume of K+ compared to the . The results shown in Fig. 3 can also be used to ascertain whether the CNTs are metallic or semiconducting as the metallic tube screens out the potential and gives a substantially lower potential compared to the semiconducting nanotubes. These results indicate that the response of CNTs to the electric field generated by ions∕molecules is sensitive to the detail of the tube electronic structure. For the SWCNT, since the polarization is mainly due to charge redistribution within the cylindrical surface, this can be sensitive to the chirality. Finally, the theoretical results presented in this paper could pave way toward developing ultraefficient, next generation CNT based nanofluidics devices that could detect ions, poisonous gases, and sequence specific DNA.
Figure 4.
Potential calculated at the measuring point (see Fig. 1 for the location of the measuring point) when Ca2+, CH3OCH3, and translocate through the (10,10) metallic CNT and (16,0) semiconducting CNT.
Acknowledgments
The authors thank Sony Joseph and Yanbin Wu for MD simulation trajectories. This research was supported by NSF under Grant Nos. 0120978, 0325344, 0328162, and 0523435, and by NIH under Grant No. PHS 2 PN2 EY016570B.
References
- Baughman R. H., Zakhidov A. A., and de Heer W. A., Science 10.1126/science.1060928 297, 787 (2002). [DOI] [PubMed] [Google Scholar]
- Dai L., Carbon Nanotechnology: Recent Developments in Chemistry, Physics, Materials Science and Device Applications (Elsevier Science, Amsterdam, 2006). [Google Scholar]
- Majumder M., Chopra N., Andrews R., and Hinds B. J., Nature (London) 10.1038/43844a 438, 44 (2005); [DOI] [PubMed] [Google Scholar]; Holt J. K., Park H. G., Wang Y., Stadermann M., Artyukhin A. B., Grigoropoulos C. P., Noy A., and Bakajin O., Science 10.1126/science.1126298 312, 1034 (2006); [DOI] [PubMed] [Google Scholar]; Hummer G., Rasaiah J. C., and Noworyta J. P., Nature (London) 10.1038/35102535 414, 188 (2001); [DOI] [PubMed] [Google Scholar]; Joseph S. and Aluru N. R., Nano Lett. 10.1021/nl072385q 8, 452 (2008). [DOI] [PubMed] [Google Scholar]
- Ghosh S., Sood A. K., and Kumar N., Science 10.1126/science.1079080 299, 1042 (2003). [DOI] [PubMed] [Google Scholar]
- Mahar B., Laslau C., Yip R., and Sun Y., IEEE Sens. J. 10.1109/JSEN.2006.886863 7, 266 (2007). [DOI] [Google Scholar]
- Mashl R. J., Joseph S., Aluru N. R., and Jakobsson E., Nano Lett. 10.1021/nl0340226 3, 589 (2003). [DOI] [Google Scholar]
- Lu D., Li Y., Rotkin S. V., Ravaioli U., and Schulten K., Nano Lett. 10.1021/nl0485511 4, 2383 (2004); [DOI] [Google Scholar]; Lu D., Li Y., Ravaioli U., and Schulten K., J. Phys. Chem. B 10.1021/jp050420g 109, 11461 (2005). [DOI] [PMC free article] [PubMed] [Google Scholar]
- Saito R., Fujita M., Dresselhaus G., and Dresselhaus M. S., Appl. Phys. Lett. 10.1063/1.107080 60, 2204 (1992). [DOI] [Google Scholar]
- Benedict L. X., Louie S. G., and Cohen M. L., Phys. Rev. B 10.1103/PhysRevB.52.8541 52, 8541 (1995). [DOI] [PubMed] [Google Scholar]
- Chen S. C., Hseih W. C., and Lin M. F., Phys. Rev. B 10.1103/PhysRevB.72.193412 72, 193412 (2005). [DOI] [Google Scholar]
- Li T. S. and Lin M. F., Phys. Rev. B 10.1103/PhysRevB.73.075432 73, 075432 (2006). [DOI] [Google Scholar]
- Jorgensen W. L., Chandrasekhar J., Madura J. D., Impey R. W., and Klein M. L., J. Chem. Phys. 10.1063/1.445869 79, 926 (1983). [DOI] [Google Scholar]
- Karim O. and Haymet A., J. Chem. Phys. 10.1063/1.459479 93, 5961 (1990). [DOI] [Google Scholar]
- van Gunsteren W. F., Billeter S. R., Eising A. A., Hünenberger P. H., Krüger P., Mark A. E., Scott W. R. P., and Tironi I. G., Biomolecular Simulation: The GROMOS96Manual and User Guide vdf Hochschulverlag, ETH Zürich, Switzerland, 1996.
- Slater J. C. and Koster G. F., Phys. Rev. 10.1103/PhysRev.94.1498 94, 1498 (1954). [DOI] [Google Scholar]
- Majewski J. A. and Vogl P., Phys. Rev. B 10.1103/PhysRevB.35.9666 35, 9666 (1987). [DOI] [PubMed] [Google Scholar]
- Areshkin D. A., Shenderova O. A., Schall J. D., Adiga S. P., and Brenner D. W., J. Phys.: Condens. Matter 10.1088/0953-8984/16/39/018 16, 6851 (2004). [DOI] [Google Scholar]
- Tang M. S., Wang C. Z., Chan C. T., and Ho K. M., Phys. Rev. B 10.1103/PhysRevB.53.979 53, 979 (1996). [DOI] [PubMed] [Google Scholar]
- Lanczos C., J. Res. Natl. Bur. Stand. 45, 255 (1950). [Google Scholar]
- Xu Y. and Aluru N. R., Phys. Rev. B 10.1103/PhysRevB.76.075304 76, 075304 (2007); [DOI] [Google Scholar]; Xu Y. and Aluru N. R., Phys. Rev. B 10.1103/PhysRevB.77.07531377, 075313 (2008). [DOI] [Google Scholar]
- Haydock R.Recursion Method and Its Applications (Springer, Berlin, 1985). [Google Scholar]


