Abstract
Insulin is the central regulator of metabolism and is necessary for storing energy as fat efficiently. Mitochondria are primary sites of energy consumption of most cells. Increased plasma insulin level and mitochondrial dysfunction are features of insulin resistance. The exact role of insulin in regulation of mitochondrial production and function remains unestablished. In this study, we observed that mitochondrial production in liver and skeletal muscle gastrocnemius was increased in mice with insulin deficiency (streptozotocin-induced type 1 diabetes). In contrast, prolonged exposure (24 h) of isolated hepatocytes to insulin decreased mitochondrial mass, mitochondrial DNA (mtDNA), intracellular ATP content, and cellular O2 consumption. Transcript levels of genes associated with mitochondrial production and β oxidation were decreased, whereas those of lipogenic genes were increased by the prolonged exposure to insulin. Insulin-induced changes in mtDNA, mitochondrial mass, intracellular ATP content, and transcripts of mitochondrion-associated genes were prevented by blockade of Akt activation with the phosphatidylinositol 3-kinase inhibitor LY294002. Conversely, levels of mtDNA, intracellular ATP content, and expression of mitochondrion-associated genes were decreased by overexpression of the constitutively active Akt. Finally, insulin suppression of mtDNA, ATP production, and expression of mitochondrion-related genes was largely prevented by inhibition of cyclic nucleotide phosphodiesterase with isobutylmethylxanthine. Together, our results show prolonged exposure of isolated hepatocytes to insulin suppresses mitochondrial production and function through the classical Akt-dependent insulin signaling pathway.
Insulin is a central regulator of metabolism of glucose, fat, and proteins. It promotes anabolism while inhibiting catabolism of all nutrients, i.e. insulin converts ingested nutrients into glycogen, fat, and proteins while preventing breakdown of stored glycogen, fat, and protein into glucose, free fatty acids, and amino acids to be consumed. Therefore, the primary function of insulin in metabolism is to store energy and prevent energy consumption. This is evidenced by the fact that, in the absence of insulin signaling, ingested calories cannot be stored efficiently (1).
Evolutionarily, the extremely high efficiency of insulin in storing energy was essential for survival because food was not always available. However, food has become abundant due to modern technologies; and people tend to intake more calories than they spend. Insulin converts every excess calorie into storage primarily as fat initially in adipose tissue and eventually in non-adipose tissues. When fat accumulation, in particular ectopic fat accumulation in liver and skeletal muscles, reaches a certain level, insulin signaling will be desensitized (2–4). As a result, hyperinsulinemia ensues to overcome insulin resistance and drive excess nutrients away from blood into storage primarily as fat, whereas maintaining blood glucose level normal via the Akt-dependent insulin signaling pathway. This pernicious cycle among fat accumulation (in particular ectopic fat accumulation), hyperinsulinemia, and insulin resistance may cause a variety of health problems associated with the life style that is featured by overeating and/or sedentary, including type 2 diabetes, cardiovascular diseases, degenerative neurological disorders, such as Alzheimer disease, cancers, and accelerated aging (2, 5–8).
To efficiently store energy, insulin not only promotes anabolism and inhibit catabolism, but may also suppress energy consumption. The primary site of energy consumption is mitochondria. Many previous studies in vivo have implied that insulin may directly suppress mitochondrial function (9–19). For example, it has been shown that whole body oxygen consumption is increased in subjects with T1DM,2 which is caused by insulin deficiency, and administration of insulin reverses the increased oxygen consumption, implying that insulin suppresses mitochondrial function (9). Mitochondrial biogenesis is always increased when levels of plasma insulin and Akt-dependent insulin signaling are decreased (10–14). Insulin has long been known as an antagonist of the cAMP/PKA-dependent signaling pathway, which stimulates mitochondrial biogenesis (15). Insulin is known to inhibit transcription of the PGC-1α gene and activity of PGC-1α protein (16, 17), which is a key stimulator of mitochondrial biogenesis (18). Mitochondrial biogenesis is increased in adipose tissue when the insulin receptor is fat-specifically knocked out of mice (14). Although so much evidence from different levels has suggested an inhibitory role for insulin in mitochondrial production and function, it is currently unclear whether or not insulin directly regulates mitochondrial production and function. Besides, some studies have implied that insulin may promote mitochondrial production and function in human subjects acutely (19, 20). In this study, we have investigated the direct effect of insulin on mitochondrial production and function in isolated mouse hepatocytes.
MATERIALS AND METHODS
Reagents—The ATP bioluminescent somatic cell assay kit (Sigma), recombinant human insulin, monoclonal antibody against ATP synthase β, antisera against β-actin, and N6,2′-O-dibutyryladenosine 3′,5′-cyclic monophosphate sodium salt (cAMP) were from Sigma. Antibodies against total/phospho-Akt or total/phospho-CREB were from Cell Signaling Technology (Danvers, MA). LY294002 was from Calbiochem. Antibodies against NRF-1, cytochrome c, TFAM, or PGC-1α were purchased from Santa Cruz Biotechnology, Inc. Blood glucose concentrations were measured using a Breese® 2 glucose meter (Bayer HealthCare). Protein assay kits were from Bio-Rad. Other materials were all obtained commercially and are of analytical quality.
Animal Experiments—Animals were housed under the usual day (12-h day light) and night (12-h darkness) circadian and fed ad libitum. To induce T1DM, C57BL/6 (B6) mice were administered streptozotocin (STZ, 60 mg/kg/once a day) for 7 days via intraperitoneal injection as previously described (21). All animal studies were approved by the Institutional Animal Care and Use Committee of the Hamner Institutes for Health Sciences and fully complied with the guidelines from the National Institutes for Health.
Cells—Mouse primary hepatocytes were isolated from C57BL/6 mice that were fed with the regular chow diet and cultured in Williams' medium E supplemented with 10% fetal bovine serum as previously described (22–28).
Measurement of ATP Content—Tissues and cultured cells were homogenized in an ice-cold ATP releasing buffer (catalog number FLSAR, Sigma). Using an ATP standard provided by Sigma, ATP concentrations were then determined with the ATP bioluminescent somatic cell assay kit (Sigma), and normalized to protein concentrations.
Measurement of Mitochondrial Mass—Mitochondrial mass was measured using Green Fluorescent MitoTracker Green FM (M7514, molecular probe from Invitrogen), which becomes fluorescent once it specifically accumulates in mitochondria (29). Twelve hours after isolation, hepatocytes were treated with insulin (10 or 100 nm) for 12–24 h. Cells were then incubated in the dark with media containing 75 nm MitoTracker Green for 60 min at 37 °C. After staining, cells were trypsinized and collected by centrifugation at 1600 × g for 2 min. Cell pellets were washed once with 0.4 ml of phosphate-buffered saline. Fluorescence intensity of cells was quantified immediately by flow cytometric scanning (fluorescence-activated cell sorter; FL-1 setting; 10,000 events/analysis) using CellQuest software (BD Biosciences, Mountain View, CA). No-dye (without adding MitoTracker Green FM) negative control was used to remove the background.
RNA Extraction and Real-time PCR—Total RNAs were extracted from cells or tissues with an RNeasy Mini Kit (Qiagen), and reverse transcribed into cDNAs, which were quantified by TaqMan® real-time PCR with specific probes and primers listed in supplemental Table S1, and normalized to levels of β-actin.
Measurement of Mitochondrial DNA—Total DNA was extracted from tissues or cultured cells using the Qiagen DNA extraction kit. DNA concentrations were determined by NanoDrop™ 1000 Spectrophotometer (Thermo Scientific, Wilmington, DE). One ng of total DNA was used to determine the ratio of mitochondrial cyclooxygenase (COXII) to nuclear intron of β-globin by real-time PCR using the oligos listed under supplemental Table S2 (30). Data were verified by measuring the ratio of cytochrome b to glucagon of the same sample.
Measurement of Oxygen Consumption—Oxygen consumption was measured in primary hepatocytes using a Clark-type oxygen electrode (Hansatech Instruments Ltd., Norfolk, England) as previously described with modifications (31). Twelve hours after their isolation, cells were treated with insulin (10 or 100 nm) for 24 h. Cells were then trypsinized and collected by centrifugation at 1600 × g for 2 min. Basal respiration of each sample was analyzed by incubating 1 × 10⁶ cells with 1 ml of Wilson media containing 25 mm HEPES and 2% bovine serum albumin-free fatty acids (pH 7.4) in a magnetically stirred chamber at 37 °C.
Measurements of cAMP and cGMP—Mouse hepa1c1c7 hepatoma cells were maintained in Dulbecco's modified Eagle's medium with high glucose (4.5 g/liter) supplemented with 10% fetal bovine serum. Cells were pre-treated with 0.25 mm IBMX for 30 min followed by a 24-h exposure to insulin at concentrations noted in the continuous presence or absence of IBMX. Intracellular levels of cAMP and cGMP were measured with Biotrak Enzyme immunoassay systems (Amersham).
Immunoblotting—Cells were lysed in Nonidet P-40 lysis buffer (1% Nonidet P-40, 150 mm NaCl, 10% glycerol, 2 mm EDTA, 20 mm Tris (pH 8.0), 1 mm dithiothreitol, 1 mm sodium orthovanadate, 1 mm phenylmethylsulfonyl fluoride, 2 μg/ml leupeptin, and 10 μg/ml aprotinin). Cell lysates (15 μg/lane) were resolved in 4–20% Tris glycine gels (Invitrogen) and transferred to nitrocellulose membranes (Bio-Rad). Target proteins were detected by immunoblotting with primary antibodies as indicated and alkaline phosphatase-conjugated secondary antisera. Fluorescent bands were visualized with a Typhoon 9410 variable mode Imager from GE Healthcare (Piscataway, NJ), and then quantified by densitometry analysis using ImageQuant 5.2 software from GE Healthcare.
Statistical Analysis—Data were analyzed by Student's t test with GraphPad Prism version 4.0 for Windows (San Diego, CA). Differences at values of p < 0.05 were considered significant.
RESULTS
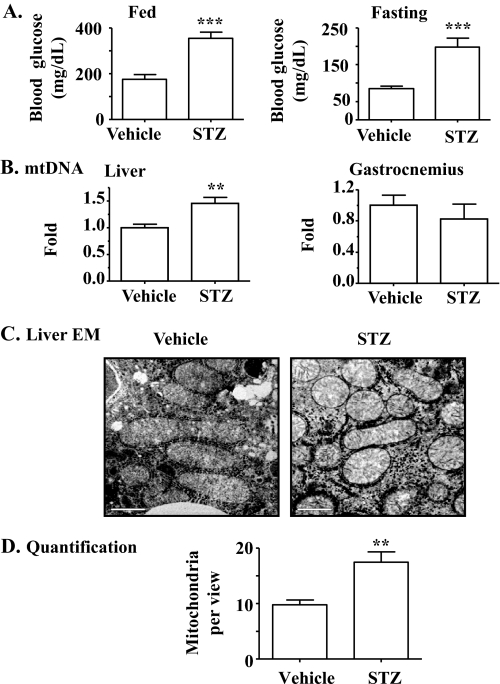
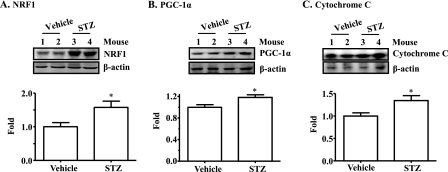
Mitochondrial Production Is Increased in Mice with STZ-induced T1DM—To determine the effect of insulin on mitochondrial production, insulin deficiency (T1DM) was induced in B6 mice, followed by evaluation of mitochondrial DNA (mtDNA), mitochondrial number, and expression levels (protein and mRNA) of genes that are involved in mitochondrial production. As shown in Fig. 1A, frank diabetes (hyperglycemia) was induced in mice by administration of STZ. The mtDNA level was significantly increased in the liver but not in the gastrocnemius of mice with T1DM (Fig. 1B). Mitochondrial number in liver evaluated by electron microscopy was also significantly elevated in T1DM (Fig. 1, C and D). Protein levels of NRF1, PGC-1α, and cytochrome c were all increased in liver of mice with T1DM (Fig. 2). Transcript levels of many mitochondrion-associated genes were elevated in liver and gastrocnemius from mice with T1DM (Table. 1). Together, these results imply that the mitochondrial production program is increased in the absence of insulin. Because plasma levels of all nutrients including glucose, amino acids, and free fatty acids are inevitably increased in the absence of insulin; and all nutrients can influence mitochondrial biogenesis (30, 32–36), these results imply but do not prove that insulin directly inhibits mitochondrial production.
FIGURE 1.
Mitochondrial production is increased in animals with T1DM diabetes caused by STZ-induced insulin deficiency. T1DM in B6 was induced by STZ (intraperitoneal, 60 mg/kg, daily, × 7 days). Animals in the control group were administered saline (vehicle). A, blood glucose during the fed state and after an overnight fast was measured. B, mtDNA was evaluated. C and D, mitochondria were visualized by electron microscopy and quantified. Results represent mean ± S.E. of 5 vehicle-treated or 4 STZ-treated mice. **, p < 0.01; ***, p < 0.001 versus vehicle. EM, electron microscopy; bar,1 μm.
FIGURE 2.
Levels of proteins that are associated with mitochondrial production are increased in liver of mice with STZ-induced insulin deficiency (T1DM). Protein levels of NRF1 (A), PGC-1α (B), and cytochrome c (C) in livers of mice described in the legend to Fig. 1 were measured by immunoblotting, quantified by densitometry, and normalized to β-actin. Results represent mean ± S.E. of 5 (Vehicle) and 4 STZ (STZ) mice. *, p < 0.05 versus vehicle.
TABLE 1.
Levels of gene transcripts in liver and gastrocnemius of mice described in the legend to Fig. 1
Note: see supplemental Table I for abbreviations.
| STZ versus vehicle | p value | |
|---|---|---|
| Liver | ||
| ATP5a1 | 1.012 ± 0.1341 | 0.9284 |
| COXIV | 1.417 ± 0.1214 | 0.0066a |
| Cyc | 1.136 ± 0.1109 | 0.3291 |
| ERRα | 1.603 ± 0.1384 | 0.0049a |
| Ndufvl | 1.055 ± 0.1084 | 0.6190 |
| NRF1 | 1.395 ± 0.1589 | 0.0357b |
| PGC-lα | 2.988 ± 0.4680 | 0.0061a |
| PGC-1β | 1.096 ± 0.2613 | 0.7569 |
| COXI | 1.177 ± 0.1231 | 0.2695 |
| Sdhc | 1.193 ± 0.0728 | 0.0434b |
| Tfam | 0.703 ± 0.1444 | 0.0744 |
| Gastrocnemius | ||
| ATP5a1 | 2.076 ± 0.4083 | 0.0249b |
| COXIV | 1.844 ± 0.1555 | 0.0021a |
| Cyc | 1.727 ± 0.1679 | 0.0078a |
| ERRα | 1.455 ± 0.3312 | 0.2868 |
| Ndufv1 | 2.339 ± 0.1631 | 0.0009c |
| NRF1 | 1.706 ± 0.1689 | 0.0044a |
| PGC-1α | 2.242 ± 0.2658 | 0.0018a |
| PGC-1β | 1.037 ± 0.1151 | 0.8683 |
| COXI | 1.738 ± 0.1371 | 0.0111b |
| Sdhc | 1.874 ± 0.1710 | 0.0025a |
| Tfam | 2.100 ± 0.1932 | 0.0008c |
p < 0.01.
p < 0.05.
p < 0.001.
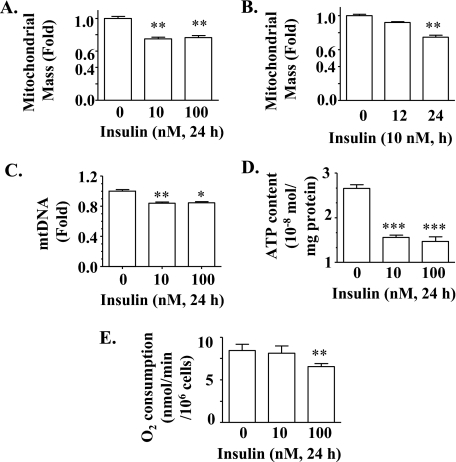
Prolonged Exposure of Primary Hepatocytes to Insulin Decreases Mitochondrial Mass, mtDNA, ATP Content, and Cellular O2 Consumption—To examine the direct effect of insulin on mitochondrial production and function, hepatocytes isolated from normal mice were incubated with insulin for either 12 or 24 h, followed by measurements of mitochondrial mass, mtDNA, intracellular ATP content, and cellular O2 consumption. As shown in Fig. 3, A and B, incubation with insulin at either 10 or 100 nm for 24 h significantly decreased the mitochondrial mass, whereas incubation with insulin for 12 h decreased mitochondrial mass without reaching statistical significance (also see supplemental Fig. 1). Incubation of hepatocytes with insulin for 24 h decreased the mitochondrial DNA level (Fig. 3C). Similarly, intracellular ATP content was reduced by incubation with insulin for 24 h (Fig. 3D). Cellular O2 consumption was reduced by exposure of hepatocytes to insulin at 100 nm for 24 h although similar exposure to insulin at 10 nm did not alter cellular O2 consumption (Fig. 3E). Together, these results indicate that mitochondrial production and function were decreased by prolonged exposure to insulin.
FIGURE 3.
Prolonged exposure to insulin decreases mitochondrial production and function in isolated hepatocytes. Mouse hepatocytes were treated with insulin as indicated. A and B, mitochondrial mass was evaluated by flow cytometry. C, mtDNA was evaluated and normalized. D, ATP content was quantified. E, rate of cellular O2 consumption was quantified. The mean O2 consumption rate of control cells was defined as 1.0. Results represent mean ± S.E. of two to four independent experiments, each in 6–10 replicates. *, p < 0.05; **, p < 0.01; ***, p < 0.001 versus no insulin (0).
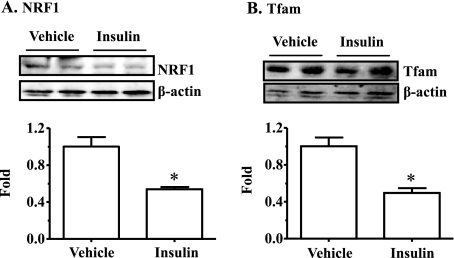
Prolonged Exposure of Primary Hepatocytes to Insulin Decreases Expression Levels of Genes Associated with Mitochondrial Production and Fat (β) Oxidation while Increasing Transcript Levels of Lipogenic Genes—To further determine the effect of insulin on mitochondrial production, primary hepatocytes were incubated with insulin for 24 h, followed by measurements of gene transcripts with real-time PCR. As shown in Table 2, many mitochondrion-related genes including ATP synthase (ATP5a1), NADH dehydrogenase (Ndufv1), postaglandin-endoperoxide synthase (COXI), succinate dehydrogenase (Sdhc), nuclear respiratory factor 1 (NRF-1), and mitochondrial transcription factor A (Tfam) were decreased by exposure to insulin. The PGC-1α transcript level was not altered, whereas the PGC-1β transcript level was increased by incubation with insulin. Protein levels of NRF-1 and TFAM was also decreased by prolonged exposure to insulin (Fig. 4). Transcript levels of key genes involved in β-oxidation were decreased by incubation with insulin (Table 2). These genes include carnitine palmitoyltransferase (CPT-1a, Cpt1a), medium chain acyl-CoA dehydrogenase (Acadm), long chain acyl-CoA dehydrogenase (Acadl), and very long chain acyl-CoA dehydrogenase (Acadvl). Conversely, transcript levels of some key lipogenic genes including sterol regulatory element-binding protein-1 (SREBP-1), SREBP-2, and fatty acid synthase (Fasn) were increased by incubation with insulin (Table 2). Together, these results indicate that mitochondrial production and fat oxidation programs are suppressed, whereas the hepatic lipogenic program is increased by insulin.
TABLE 2.
Levels of gene transcripts in primary hepatocytes that were exposed to insulin (100 nM) for 24 h
Note: see supplemental Table I for abbreviations.
| Insulin versus vehicle | p value | |
|---|---|---|
| ATP5a1 | 0.698 ± 0.0407 | p < 0.0001a |
| COXIV | 0.941 ± 0.0280 | p < 0.0001a |
| Ndufv1 | 0.855 ± 0.0558 | p = 0.0141b |
| NRF1 | 0.746 ± 0.0168 | p = 0.0002a |
| PGC-1α | 0.958 ± 0.0702 | p = 0.4280 |
| PGC-1β | 2.494 ± 0.3528 | p < 0.0001a |
| COXI | 0.630 ± 0.0795 | p < 0.0001a |
| Sdhc | 0.884 ± 0.0628 | p = 0.0422b |
| Tfam | 0.704 ± 0.0548 | p < 0.0001a |
| CPT-1α | 0.324 ± 0.0582 | p = 0.0005a |
| Acadm | 0.796 ± 0.0495 | p = 0.0429b |
| Acadl | 0.833 ± 0.0074 | p = 0.0011c |
| Acadvl | 0.759 ± 0.0541 | p = 0.0116b |
| SREBP-1 | 2.444 ± 0.4861 | p = 0.0387b |
| SREBP-2 | 2.062 ± 0.3686 | p = 0.0255b |
| FAS | 1.408 ± 0.1338 | p = 0.0180b |
| Hmgcr | 1.971 ± 0.4452 | p = 0.0878 |
p < 0.001.
p < 0.05.
p < 0.01.
FIGURE 4.
Prolonged exposure to insulin decreases protein levels of key genes involved in mitochondrial production in isolated hepatocytes. Mouse hepatocytes were treated with insulin (100 nm) or the vehicle solution (phosphate-buffered saline) in culture media for 24 h. Protein levels of NRF1 and Tfam were measured by immunoblotting with specific antisera, quantified, and normalized to β-actin. Results represent mean ± S.D. of two independent experiments, each in duplicate. *, p < 0.05 versus vehicle.
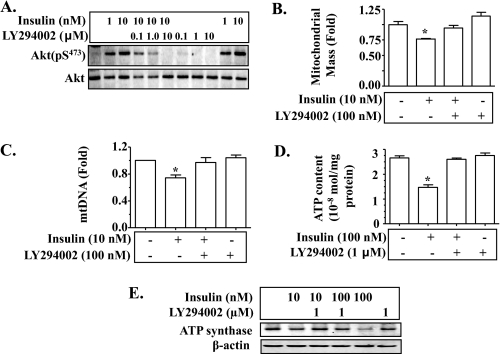
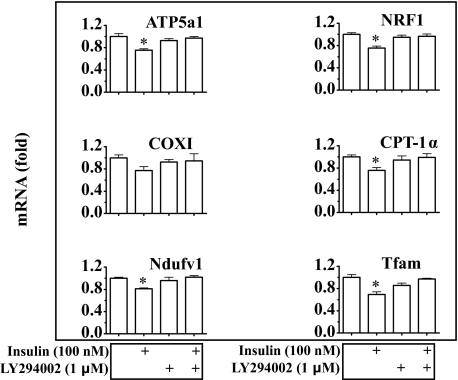
Insulin Reduction of Mitochondrial Production and Function Is Mediated by the Akt-dependent Classical Insulin Signaling Pathway—To examine the mechanism by which insulin influences mitochondrial production and function, hepatocytes were incubated with insulin for 24 h in the presence or absence of the phosphatidylinositol 3-kinase inhibitor LY294002, followed by evaluation of levels of Akt phosphorylation, mitochondrial mass, mtDNA, intracellular ATP content, ATP synthase protein, and transcripts of mitochondrion-related genes. Application of LY294002 prevented insulin-induced Akt phosphorylation as expected (Fig. 5A). Insulin-mediated reductions in mitochondrial mass, mtDNA, and intracellular ATP were all prevented by LY294002 (Fig. 5, B–D). Similarly, ATP synthase protein level was decreased by prolonged exposure to insulin, but the decrease was reversed by LY294002 (Fig. 5E). As shown in Fig. 6, transcript levels of Ndufv1, Ptgs1, Atp5a1, Ctp1a, Nrf-1, and Tfam were reduced by incubation with insulin; and the reductions were reversed by pre-treatment with LY294002. Together, these results suggest that insulin suppression of mitochondrial mass, mtDNA, and intracellular ATP level is mediated by the Akt-dependent classical insulin signaling.
FIGURE 5.
Prolonged exposure to insulin decreases mitochondrial mass, mtDNA, intracellular ATP level, and ATP synthase through Akt-dependent insulin signaling. Isolated mouse hepatocytes were pretreated with LY294002 for 30 min, and then treated with insulin in the continuous presence of LY294002 for 24 h. A, levels of phospho and total proteins of Akt were detected by immunoblotting. B, mitochondrial mass was evaluated. C, levels of mtDNA were quantified by real-time PCR and normalized as detailed under “Materials and Methods.” D, intracellular ATP content was measured as described under “Materials and Methods.” E, levels of ATP synthase protein were examined by immunoblotting. Results in B–D represent mean ± S.E. of three independent experiments. *, p < 0.05 versus all bars without asterisks in B–D.
FIGURE 6.
Insulin decreases transcript levels of mitochondrion-related genes through Akt-dependent insulin signaling. Isolated mouse hepatocytes were pretreated with LY294002 (1 μm) for 30 min, and then treated with insulin for 24 h for measurements of gene transcripts by TaqMan real-time PCR. Results represent mean ± S.E. of three independent experiments. *, p < 0.05 versus all bars without a asterisk.
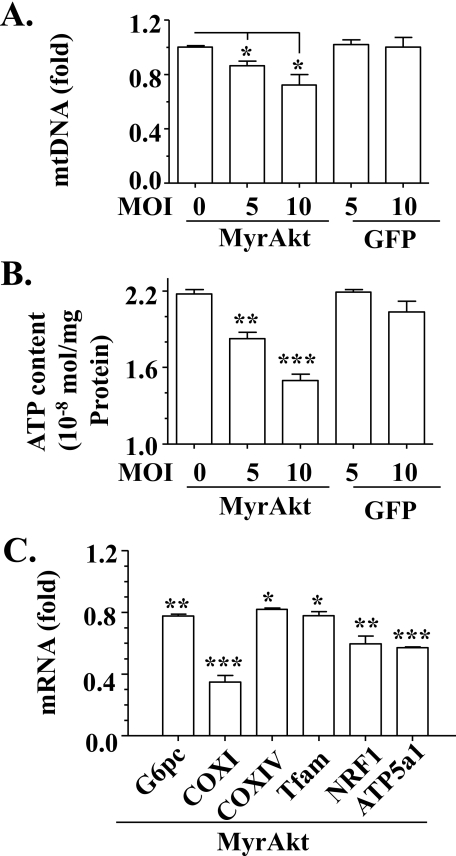
To further examine the role of Akt-dependent insulin signaling in insulin suppression of mitochondrial production and function, constitutively active Akt (MyrAkt) was overexpressed in hepatocytes as noted via recombinant adenoviruses (27), followed by measurements of mtDNA, intracellular ATP, transcripts of some genes associated with mitochondrial production. As shown in Fig. 7, A and B, levels of mtDNA and intracellular ATP were decreased by overexpression of MyrAkt, but unaffected by the negative control. Similarly, transcript levels of some mitochondrion-related genes including Ptgs1 (COXI), Cox4i1 (COXIV), Tfam, Nrf-1, and Atp5a1 were reduced by MyrAkt (Fig. 7C). Level of the positive control, glucose-6-phosphatase transcripts (Glc-6-phosphatase), was decreased as anticipated. Together, these results support the notion that Akt-dependent insulin signaling inhibits mitochondrial production and function.
FIGURE 7.
Overexpression of constitutively active Akt suppresses mitochondrial production and function. Constitutively active Akt (MyrAkt) was introduced into primary mouse hepatocytes by recombinant adenoviruses for 36 h, followed by measurements of mtDNA (A), intracellular ATP content (B), and gene transcripts (C). Green fluorescent protein encoded by recombinant adenoviruses were used as a negative control. Results represent mean ± S.D. of two independent experiments, each in triplicate. MOI, multiplicity of infection. *, p < 0.05; **, p < 0.01; ***, p < 0.001 versus control.
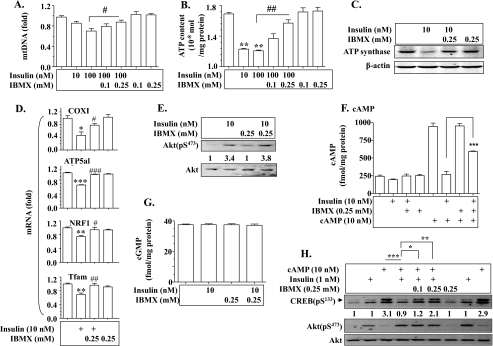
Insulin Suppression of Mitochondrial Production and Function Is Cyclic Nucleotide Phosphodiesterase (PDE)-dependent—It is known that insulin decreases intracellular levels of cAMP and cGMP via Akt-dependent activation of PDE (37), and that cAMP and cGMP are known to promote mitochondrial production (38). To further examine the mechanism by which insulin inhibits mitochondrial production and function, we incubated hepatocytes with insulin in the presence or absence of the PDE inhibitor IBMX, followed by evaluations of mtDNA, intracellular ATP level, ATP synthase protein, and transcript levels of several mitochondrion-related genes. As shown in Fig. 8, A–C, insulin-induced decreases in mtDNA, intracellular ATP level, and ATP synthase protein were prevented by pretreatment with IBMX in a dose-dependent manner. Similarly, insulin-mediated reductions in transcript levels of COXI, ATP synthase, NRF1, and TFAM were also largely reversed by IBMX (Fig. 8D). IBMX did not alter insulin activation of Akt (Fig. 8E). Next, the effect of insulin on levels of cAMP and cGMP was evaluated. As shown in Fig. 8F, prolonged exposure to insulin decreased levels of cAMP, and the decrease was prevented by IBMX. Levels of cGMP were not affected by insulin (Fig. 8G). Finally, we evaluated the effect of insulin on a downstream effector of cAMP, CREB activation. As shown in Fig. 8H, cAMP-induced CREB phosphorylation was prevented by treatment with insulin, and the effect of insulin was blocked by the PDE inhibitor IBMX. Together, these results show that insulin suppresses mitochondrial production and function through PDE-dependent degradation of cAMP.
FIGURE 8.
Insulin suppresses hepatic mitochondrial production and function through cyclic nucleotide phosphodiesterase (PDE). Primary hepatocytes were pretreated with IBMX for 30 min, and then incubated with insulin for 24 h for measuring mRNAs or for 24 h for quantifying mDNA, proteins, and ATP content. A, levels of mtDNA were evaluated as described under “Materials and Methods.” B, intracellular ATP was quantified as described under “Materials and Methods.” C, ATP synthase protein was detected by immunoblotting. D, transcripts of mitochondrion-related genes were measured by TaqMan real-time PCR. Results of A, B, and D represent mean ± S.E. of three independent experiments. *, p < 0.05; **, p < 0.01; ***, p < 0.001 versus vehicle treatment. #, p < 0.05; ##, p < 0.01; ###, p < 0.001 versus insulin alone. E, IBMX did not affect insulin signaling. Hepatoma cells (1c1c7) were pre-treated with 0.25 mm IBMX for 30 min followed by incubation with insulin for 5 min. Akt phosphorylation at Ser473 was measured by immunoblotting and normalized to levels of total Akt. Results shown represent two independent experiments. F and G, quantification of intracellular cAMP and cGMP. Hepatoma cells (1c1c7) were pre-treated with IBMX for 30 min and then incubated with insulin for 24 h in the presence or absence of IBMX. Intracellular levels of cAMP and cGMP were measured by enzyme immunoassays as described under “Materials and Methods.” Results represent mean ± S.D. of two independent experiments, each in 4–6 replicates. *, #, p < 0.05 versus vehicle or insulin alone, respectively. H, insulin neutralizes cAMP activation of CREB via PDE. Hepa1c1c7 cells were pre-treated with IBMX (0.1 and 0.25 mm) for 30 min followed by exposure to 10 nm cAMP in the presence and absence of 1 nm insulin for 30 min. CREB phosphorylation at Ser133 and Akt phosphorylation at Ser473 were determined by immunoblotting, and normalized to levels of total Akt. Results shown are a set of typical immunoblots of two independent experiments. *, p < 0.05; **, p < 0.01; ***, p < 0.001.
DISCUSSION
A primary role of insulin is to conserve energy whenever nutrients are available. To efficiently store energy, insulin does not only promote anabolism, whereas inhibiting catabolism of all main nutrients including carbohydrates, fat, and proteins, but may also slow energy consumption. The primary site of energy consumption is mitochondria. In this study, we have observed that prolonged exposure of isolated hepatocytes to insulin inhibits mitochondrial production and function.
It has been repeatedly shown that the plasma insulin level and mitochondrial production/biogenesis usually go opposite directions. Mitochondrial biogenesis is increased in liver and/or skeletal muscles when levels of plasma insulin and basal level of Akt phosphorylation in liver are decreased due to caloric restriction, growth hormone deficiency, or growth hormone receptor knock-out (10–14). Our results show that the mitochondrial production program is increased in mice with insulin deficiency (T1DM) induced by STZ. Moreover, mitochondrial biogenesis is increased in adipose tissue when insulin receptor is fat-specifically knocked out from mice (14). These observations strongly suggest that mitochondrial biogenesis is increased when insulin is deficient. However, levels of all nutrients including glucose, fatty acids, and amino acids are inevitably increased in the blood in the absence of insulin and all these nutrients have been shown to be able to influence mitochondrial biogenesis (30, 32–36). Although it is still inconclusive whether or not the effect of insulin is direct or indirect in animals with T1DM or fat-specific insulin receptor knock-out, it is clear mitochondrial biogenesis is always increased in the absence of insulin.
The exact reason for increasing mitochondrial biogenesis during caloric restriction, when fuel supplies and basal level of insulin signaling are low, is unknown. One possibility is that the removal of old mitochondria through autophagy is increased, and thus, new mitochondria are produced to replace the old ones. This possibility is based on the fact that autophagy is normally suppressed by nutrients such as amino acids and insulin after food intake, but is increased during starvation due to decreased levels of nutrients and insulin in the blood (39, 40). Increased autophagy provides alternative fuel for survival during starvation by digesting large molecules and cellular organelles such as mitochondrial and endoplasmic reticulum (39, 40). This self-digestion is not only necessary for providing fuel during starvation, but also plays a critical role in maintenance of cellular health by eliminating old/dysfunctional cellular organelles such as old mitochondria. That is probably why increased autophagy is associated with longevity (39, 40).
In contrast, increased plasma insulin level (hyperinsulinemia) and insulin resistance have been frequently found to be associated with decreased mitochondrial mass/production (41–44). Administration of insulin is associated with decreased whole body oxygen consumption (9). These observations imply that insulin inhibits mitochondrial production/biogenesis and function. Because the acute response to insulin challenge is blunted in the presence of insulin resistance, it is generally perceived that the classical Akt-dependent insulin signaling is not functional in the presence of insulin resistance. Thus, the decreased mitochondrial mass has generally been attributed to insulin resistance. However, our results from isolated hepatocytes in this study show that prolonged exposure to insulin suppresses mitochondrial production and function through the classical Akt-dependent insulin signaling pathway. In our parallel studies that will be published in a separate article, we have found that the basal level of Akt-dependent insulin signaling is increased, and is responsible for decreased mitochondrial production in mice with high fat diet-induced hyperinsulinemia and insulin resistance.3 Thus, it appears that insulin can indeed suppress mitochondrial production if the exposure to insulin lasts long enough. This is, perhaps, another reason why mitochondrial production is increased when basal levels of plasma insulin and Akt-dependent insulin signaling are decreased by caloric restriction.
The effect of insulin on mitochondrial production/biogenesis can be very complex due to roles of insulin in both gene transcription and translation. Because insulin is a known stimulator of protein syntheses, it can presumably promote mitochondrial production by stimulating translation of mitochondrial genes. Additionally, it is known that insulin is able to promote mitochondrial ATP production via activation of pyruvate dehydrogenase (45, 46), and insulin activation of the pyruvate dehydrogenase complex is probably mediated by pyruvate dehydrogenase phosphate phosphatase (47). In support, our results show that acute treatment with insulin promotes ATP production, whereas prolonged exposure to insulin does the opposite (supplemental Fig. S2). Importantly, insulin has also been shown to inhibit transcription of the PGC-1 gene and activity of PGC-1α protein (17, 48). PGC-1α is a potent coactivator of the central transcription factor NRF1 in regulating transcription of the Tfam gene, which controls the sole mitochondrial DNA promoter and replication of mitochondrial DNA (49). In this study, we show that transcript levels of both NRF-1 and Tfam were decreased by insulin, whereas the PGC-1α mRNA level was not altered and the PGC-1β mRNA level was increased by insulin. Because Tfam is downstream of NRF-1 and PGC-1s and is the direct regulator of the sole mitochondrial promoter and mitochondrial DNA replication (49), our results indicate that (a) transcription of the Tfam gene can be independent of levels of PGC-1 transcripts; (b) insulin can inhibit mitochondrial production through Tfam. As a result, prolonged exposure to insulin may lead to decreased mitochondrial production due to lack of transcripts of mitochondrion-associated genes such as Tfam, and ultimately leads to decreased overall mitochondrial capacity. However, the suppressive effect of insulin on mitochondrial production may not always be translated into decreased mitochondrial mass or mtDNA in animals due to (a) the stimulatory effect of insulin in protein synthesis as discussed above, and (b) the inhibitory role of insulin in autophagy as described above, leading to delayed removal of old mitochondria. Theoretically, an ideal method to determine the effect of insulin on mitochondrial biogenesis/production is to label all newly produced mitochondria and quantify them in animals that are treated by insulin for a certain amount of time (50–52). Again, prolonged treatment of animals with insulin may lead to insulin resistance and changes in blood levels of nutrients, and cause difficulties in interpreting results. Thus, it is basically impossible to achieve a pure effect of insulin on mitochondrial production and function in any experiments that modulate levels of insulin or insulin signaling in animals. Results from isolated cells described in this study become necessary for completely understanding the direct effect of insulin on mitochondrial production and function. It is also noteworthy that the chronic effect of insulin on mitochondrial production and function observed in this study may reflect the situation of insulin resistance/hyperinsulinemia, whereas the acute effect of insulin on ATP production may mirror the physiological situation.
It has previously been shown that cGMP is a promoter of mitochondrial production (38), insulin can theoretically regulate cGMP-mediated mitochondrial production via PDE. Nevertheless, our results show that intracellular levels of cGMP in hepatocytes are not altered by exposure to insulin. Importantly, the cAMP/PKA/CREB-dependent signaling pathway has been shown previously to promote the function of the mitochondrion production stimulator PGC-1α through PGC-1α gene transcription and activation of PGC-1α protein (18, 53). It is also well established that insulin is a strong antagonist of cAMP/PKA signaling through activation of PDE (15). We show here that prolonged exposure to insulin reduces the intracellular cAMP level, which is accompanied by decreased production of mitochondria. Thus, insulin appears to influence cAMP/PKA/CREB/PGC-1α-mediated mitochondrial production. Because our results show that insulin does not obviously affect levels of PGC-1α transcripts, it is likely that insulin regulates PGC-1α function via its activity in hepatocytes.
In summary, we have found that prolonged exposure of isolated hepatocytes to insulin decreases mitochondrial production and function. This effect of insulin may be useful to preserve energy for survival when food is not always available. However, this effect may limit mitochondrial capacity when food is always abundant in industrialized countries. The limited mitochondrial capacity may lead to overloading of mitochondria by nutrients, and eventually increased production of mitochondrion-derived reactive oxygen species (44), which is known to play a critical/necessary role in the development of insulin resistance (54–56). Moreover, limited mitochondrial capacity may aggravate fat accumulation, in particular ectopic fat accumulation, which promotes insulin resistance directly or indirectly through reactive oxygen species (3, 4). Therefore, insulin suppression of mitochondrial production and function may be a major contributor to the development of insulin resistance.
Acknowledgments
We thank Dr. Sheila Collins for advice and Dr. Morris Birnbaum for providing the recombinant adenoviruses encoding the MyrAkt.
This work was supported, in whole or in part, by National Institutes of Health Grant R01DK076039 (to W. C.). This work was also supported by the Investigator Development Fund from the Hamner Institutes for Health Sciences (to W. C.) and American Heart Association Grant SDG-0530244N (to W. C.).
The on-line version of this article (available at http://www.jbc.org) contains supplemental Figs. S1 and S2 and Tables S1 and S2.
Footnotes
The abbreviations used are: T1DM, type 1 diabetes mellitus; CREB, cAMP-response element-binding protein; PKA, protein kinase A; PGC-1α, peroxisome proliferator-activated receptor α; STZ, streptozotocin; COX, cyclooxygenase; IBMX, isobutylmethylxanthine; mtDNA, mitochondrial DNA; SREBP, sterol regulatory element-binding protein; PDE, phosphodiesterase.
H.-Y. Liu and W. Cao, unpublished data.
References
- 1.Bluher, M., Kahn, B. B., and Kahn, C. R. (2003) Science 299 572–574 [DOI] [PubMed] [Google Scholar]
- 2.Accili, D. (2004) Diabetes 53 1633–1642 [DOI] [PubMed] [Google Scholar]
- 3.Kim, J. Y., van de Wall, E., Laplante, M., Azzara, A., Trujillo, M. E., Hofmann, S. M., Schraw, T., Durand, J. L., Li, H., Li, G., Jelicks, L. A., Mehler, M. F., Hui, D. Y., Deshaies, Y., Shulman, G. I., Schwartz, G. J., and Scherer, P. E. (2007) J. Clin. Investig. 117 2621–2637 [DOI] [PMC free article] [PubMed] [Google Scholar]
- 4.Wang, M. Y., Grayburn, P., Chen, S., Ravazzola, M., Orci, L., and Unger, R. H. (2008) Proc. Natl. Acad. Sci. U. S. A. 105 6139–6144 [DOI] [PMC free article] [PubMed] [Google Scholar]
- 5.Burns, J. M., Donnelly, J. E., Anderson, H. S., Mayo, M. S., Spencer-Gardner, L., Thomas, G., Cronk, B. B., Haddad, Z., Klima, D., Hansen, D., and Brooks, W. M. (2007) Neurology 69 1094–1104 [DOI] [PubMed] [Google Scholar]
- 6.Cole, G. M., and Frautschy, S. A. (2007) Exp. Gerontol. 42 10–21 [DOI] [PubMed] [Google Scholar]
- 7.Crowell, J. A., Steele, V. E., and Fay, J. R. (2007) Mol. Cancer Ther. 6 2139–2148 [DOI] [PubMed] [Google Scholar]
- 8.Moreira, P. I., Santos, M. S., Seica, R., and Oliveira, C. R. (2007) J. Neurol. Sci. 257 206–214 [DOI] [PubMed] [Google Scholar]
- 9.Danford, H. G., Galvin, R. D., and Horita, A. (1956) J. Clin. Investig. 35 1205–1212 [DOI] [PMC free article] [PubMed] [Google Scholar]
- 10.Al-Regaiey, K. A., Masternak, M. M., Bonkowski, M., Sun, L., and Bartke, A. (2005) Endocrinology 146 851–860 [DOI] [PubMed] [Google Scholar]
- 11.Civitarese, A. E., Carling, S., Heilbronn, L. K., Hulver, M. H., Ukropcova, B., Deutsch, W. A., Smith, S. R., and Ravussin, E. (2007) PLoS Med. 4 e76. [DOI] [PMC free article] [PubMed] [Google Scholar]
- 12.Holzenberger, M., Dupont, J., Ducos, B., Leneuve, P., Geloen, A., Even, P. C., Cervera, P., and Le Bouc, Y. (2003) Nature 421 182–187 [DOI] [PubMed] [Google Scholar]
- 13.Lagouge, M., Argmann, C., Gerhart-Hines, Z., Meziane, H., Lerin, C., Daussin, F., Messadeq, N., Milne, J., Lambert, P., Elliott, P., Geny, B., Laakso, M., Puigserver, P., and Auwerx, J. (2006) Cell 127 1109–1122 [DOI] [PubMed] [Google Scholar]
- 14.Katic, M., Kennedy, A. R., Leykin, I., Norris, A., McGettrick, A., Gesta, S., Russell, S. J., Bluher, M., Maratos-Flier, E., and Kahn, C. R. (2007) Aging Cell 6 827–839 [DOI] [PMC free article] [PubMed] [Google Scholar]
- 15.Kones, R. J., and Phillips, J. H. (1975) Cardiology 60 280–303 [DOI] [PubMed] [Google Scholar]
- 16.Southgate, R. J., Bruce, C. R., Carey, A. L., Steinberg, G. R., Walder, K., Monks, R., Watt, M. J., Hawley, J. A., Birnbaum, M. J., and Febbraio, M. A. (2005) FASEB J. 19 2072–2074 [DOI] [PubMed] [Google Scholar]
- 17.Li, X., Monks, B., Ge, Q., and Birnbaum, M. J. (2007) Nature 447 1012–1016 [DOI] [PubMed] [Google Scholar]
- 18.Puigserver, P., Wu, Z., Park, C., Graves, R., Wright, M., and Spiegelman, B. (1998) Cell 92 829–839 [DOI] [PubMed] [Google Scholar]
- 19.Huang, X., Eriksson, K. F., Vaag, A., Lehtovirta, M., Hansson, M., Laurila, E., Kanninen, T., Olesen, B. T., Kurucz, I., Koranyi, L., and Groop, L. (1999) Diabetes 48 1508–1514 [DOI] [PubMed] [Google Scholar]
- 20.Stump, C. S., Short, K. R., Bigelow, M. L., Schimke, J. M., and Nair, K. S. (2003) Proc. Natl. Acad. Sci. U. S. A. 100 7996–8001 [DOI] [PMC free article] [PubMed] [Google Scholar]
- 21.Turko, I. V., and Murad, F. (2003) J. Biol. Chem. 278 35844–35849 [DOI] [PubMed] [Google Scholar]
- 22.Cao, W., Collins, Q. F., Becker, T. C., Robidoux, J., Lupo, J., Xiong, Y., Daniel, K., Floering, L., and Collins, S. (2005) J. Biol. Chem. 280 42731–42737 [DOI] [PubMed] [Google Scholar]
- 23.Xiong, Y., Collins, Q. F., Lupo, J., Liu, H. Y., Jie, A., Liu, D., and Cao, W. (2006) J. Biol. Chem. 282 4975–4982 [DOI] [PubMed] [Google Scholar]
- 24.Collins, Q. F., Xiong, Y., Lupo, J., Liu, H. Y., and Cao, W. (2006) J. Biol. Chem. 281 24336–24344 [DOI] [PubMed] [Google Scholar]
- 25.Collins, Q. F., Liu, H. Y., Pi, J., Liu, Z., Quon, M. J., and Cao, W. (2007) J. Biol. Chem. 282 30143–30149 [DOI] [PMC free article] [PubMed] [Google Scholar]
- 26.Liu, H. Y., Collins, Q. F., Xiong, Y., Moukdar, F., Lupo, J., Liu, Z., and Cao, W. (2007) J. Biol. Chem. 282 14205–14212 [DOI] [PubMed] [Google Scholar]
- 27.Liu, H. Y., Collins, Q. F., Fatiha, M., Zguo, D., Han, J., Hong, T., Collins, S., and Cao, W. (2008) J. Biol. Chem. 283 12056–12063 [DOI] [PMC free article] [PubMed] [Google Scholar]
- 28.Liu, H. Y., Wen, G. B., Han, J., Hong, T., Zhuo, D., Liu, Z., and Cao, W. (2008) J. Biol. Chem. 283 30642–30649 [DOI] [PMC free article] [PubMed] [Google Scholar]
- 29.Pendergrass, W., Wolf, N., and Poot, M. (2004) Cytometry A 61 162–169 [DOI] [PubMed] [Google Scholar]
- 30.Cunningham, J. T., Rodgers, J. T., Arlow, D. H., Vazquez, F., Mootha, V. K., and Puigserver, P. (2007) Nature 450 736–740 [DOI] [PubMed] [Google Scholar]
- 31.Matthias, A., Ohlson, K. B. E., Fredriksson, J. M., Jacobsson, A., Nedergaard, J., and Cannon, B. (2000) J. Biol. Chem. 275 25073–25081 [DOI] [PubMed] [Google Scholar]
- 32.Lin, Y., Berg, A. H., Iyengar, P., Lam, T. K., Giacca, A., Combs, T. P., Rajala, M. W., Du, X., Rollman, B., Li, W., Hawkins, M., Barzilai, N., Rhodes, C. J., Fantus, I. G., Brownlee, M., and Scherer, P. E. (2005) J. Biol. Chem. 280 4617–4626 [DOI] [PubMed] [Google Scholar]
- 33.Palmeira, C. M., Rolo, A. P., Berthiaume, J., Bjork, J. A., and Wallace, K. B. (2007) Toxicol. Appl. Pharmacol. 225 214–220 [DOI] [PubMed] [Google Scholar]
- 34.Garcia-Roves, P., Huss, J. M., Han, D. H., Hancock, C. R., Iglesias-Gutierrez, E., Chen, M., and Holloszy, J. O. (2007) Proc. Natl. Acad. Sci. U. S. A. 104 10709–10713 [DOI] [PMC free article] [PubMed] [Google Scholar]
- 35.Tanaka, T., Yamamoto, J., Iwasaki, S., Asaba, H., Hamura, H., Ikeda, Y., Watanabe, M., Magoori, K., Ioka, R. X., Tachibana, K., Watanabe, Y., Uchiyama, Y., Sumi, K., Iguchi, H., Ito, S., Doi, T., Hamakubo, T., Naito, M., Auwerx, J., Yanagisawa, M., Kodama, T., and Sakai, J. (2003) Proc. Natl. Acad. Sci. U. S. A. 100 15924–15929 [DOI] [PMC free article] [PubMed] [Google Scholar]
- 36.Meijer, A. J. (2003) J. Nutr. 133 2057S–2062S [DOI] [PubMed] [Google Scholar]
- 37.Wijkander, J., Landstrom, T. R., Manganiello, V., Belfrage, P., and Degerman, E. (1998) Endocrinology 139 219–227 [DOI] [PubMed] [Google Scholar]
- 38.Nisoli, E., Cozzi, V., and Carruba, M. O. (2008) Am. J. Cardiol. 101 22E–25E [DOI] [PubMed] [Google Scholar]
- 39.Yin, X. M., Ding, W. X., and Gao, W. (2008) Hepatology 47 1773–1785 [DOI] [PubMed] [Google Scholar]
- 40.Levine, B., and Kroemer, G. (2008) Cell 132 27–42 [DOI] [PMC free article] [PubMed] [Google Scholar]
- 41.Petersen, K. F., Befroy, D., Dufour, S., Dziura, J., Ariyan, C., Rothman, D. L., DiPietro, L., Cline, G. W., and Shulman, G. I. (2003) Science 300 1140–1142 [DOI] [PMC free article] [PubMed] [Google Scholar]
- 42.Petersen, K. F., Dufour, S., Befroy, D., Garcia, R., and Shulman, G. I. (2004) N. Engl. J. Med. 350 664–671 [DOI] [PMC free article] [PubMed] [Google Scholar]
- 43.Petersen, K. F., Dufour, S., and Shulman, G. I. (2005) PLoS Med. 2 e233. [DOI] [PMC free article] [PubMed] [Google Scholar]
- 44.Wallace, D. C. (2005) Annu. Rev. Genet. 39 359–407 [DOI] [PMC free article] [PubMed] [Google Scholar]
- 45.Sugden, M. C., and Holness, M. J. (2002) Curr. Drug Targets Immune Endocr. Metabol. Disord. 2 151–165 [PubMed] [Google Scholar]
- 46.Roche, T. E., and Hiromasa, Y. (2007) Cell Mol. Life Sci. 64 830–849 [DOI] [PMC free article] [PubMed] [Google Scholar]
- 47.Mukherjee, C., and Jungas, R. L. (1975) Biochem. J. 148 229–235 [DOI] [PMC free article] [PubMed] [Google Scholar]
- 48.Nishino, N., Tamori, Y., and Kasuga, M. (2007) Kobe J. Med. Sci. 53 99–106 [PubMed] [Google Scholar]
- 49.Larsson, N. G., Wang, J., Wilhelmsson, H., Oldfors, A., Rustin, P., Lewandoski, M., Barsh, G. S., and Clayton, D. A. (1998) Nat. Genet. 18 231–236 [DOI] [PubMed] [Google Scholar]
- 50.Beattie, D. S., Basford, R. E., and Koritz, S. B. (1967) J. Biol. Chem. 242 4584–4586 [PubMed] [Google Scholar]
- 51.Menzies, R. A., and Gold, P. H. (1971) J. Biol. Chem. 246 2425–2429 [PubMed] [Google Scholar]
- 52.Menzies, R. A., and Gold, P. H. (1972) J. Neurochem. 19 1671–1683 [DOI] [PubMed] [Google Scholar]
- 53.Puigserver, P., Rhee, J., Lin, J., Wu, Z., Yoon, J., Zhang, C., Krauss, S., Mootha, V., Lowell, B., and Spiegelman, B. (2001) Mol. Cell 8 971–982 [DOI] [PubMed] [Google Scholar]
- 54.Houstis, N., Rosen, E. D., and Lander, E. S. (2006) Nature 440 944–948 [DOI] [PubMed] [Google Scholar]
- 55.Pospisilik, J. A., Knauf, C., Joza, N., Benit, P., Orthofer, M., Cani, P. D., Ebersberger, I., Nakashima, T., Sarao, R., Neely, G., Esterbauer, H., Kozlov, A., Kahn, C. R., Kroemer, G., Rustin, P., Burcelin, R., and Penninger, J. M. (2007) Cell 131 476–491 [DOI] [PubMed] [Google Scholar]
- 56.Kumashiro, N., Tamura, Y., Uchida, T., Ogihara, T., Fujitani, Y., Hirose, T., Mochizuki, H., Kawamori, R., and Watada, H. (2008) Diabetes 57 2083–2091 [DOI] [PMC free article] [PubMed] [Google Scholar]


