

Abstract
Heparanase is an endoglycosidase that specifically cleaves heparan sulfate side chains, a class of glycosaminoglycans abundantly present in the extracellular matrix and on the cell surface. Heparanase activity is strongly implicated in tumor metastasis attributed to remodeling of the subepithelial and subendothelial basement membranes resulting in dissemination of metastatic cancer cells. Moreover, heparanase up regulation was noted in an increasing number of primary human tumors, correlating with tumors larger in size, increased microvessel density, and reduced post operative survival rate, implying that heparanase function is not limited to tumor metastasis. This notion is supported by recent findings revealing induction of signaling molecules (i.e., Akt, p38) and gene transcription (i.e., tissue factor, VEGF) by enzymatically-inactive heparanase. Here, we provide evidence that active and inactive heparanase proteins enhance EGF-receptor (EGFR) phosphorylation. Enhanced EGFR phosphorylation was associated with increased cell migration, cell proliferation, and colony formation which were attenuated by Src inhibitors. Similarly, heparanase gene silencing by means of siRNA was associated with reduced Src and EGFR phosphorylation levels and decreased cell proliferation. Moreover, heparanase expression correlated with increased phospho-EGFR levels and progression of head and neck carcinoma, providing a strong clinical support for EGFR modulation by heparanase. Thus, heparanase appears to modulate two critical systems involved in tumor progression, namely VEGF expression and EGFR activation. Neutralizing heparanase enzymatic and non-enzymatic functions is therefore expected to profoundly affect tumor growth, angiogenesis, and metastasis.
Keywords: Heparanase, EGFR, phosphorylation, Src, Head and Neck carcinoma
Introduction
Heparanase is an endo-β-D-glucuronidase capable of cleaving heparan sulfate (HS) side chains at a limited number of sites, yielding HS fragments of still appreciable size (~4–7 kDa). Heparanase activity has long been correlated with the metastatic potential of tumor-derived cells, attributed to enhanced cell dissemination as a consequence of HS cleavage and remodeling of the extracellular matrix (ECM) barrier (1, 2). More recently, heparanase up-regulation was documented in an increasing number of human carcinomas and hematological malignancies (3, 4). In many cases, heparanase induction correlated with increased tumor metastasis, vascular density, and shorter post operative survival of cancer patients, thus providing a strong clinical support for the pro-metastatic and pro-angiogenic functions of the enzyme and positioning heparanase as an attractive target for the development of anti-cancer drugs (5–7). Apart of the well studied catalytic feature of the enzyme, heparanase was noted to exert biological functions apparently independent of its enzymatic activity. Non enzymatic functions of heparanase include enhanced cell adhesion (8–11) and induction of p38 and Akt phosphorylation (8, 11–13). Moreover, enzymatically active and inactive heparanase were noted to induce vascular endothelial growth factor (VEGF) expression in a Src-dependent manner (14), thus providing, among other mechanisms (15), a molecular basis for the potent pro-angiogenic capacity of heparanase. We hypothesized that Src stimulation by heparanase will facilitate the phosphorylation and activation of Src substrates such as EGF-receptor (EGFR). Here, we provide evidence that heparanase over expression or exogenous addition enhances EGFR phosphorylation. Enhanced EGFR phosphorylation correlated with increased cell migration and proliferation which was attenuated by Src inhibitors. Similarly, heparanase gene silencing was associated with reduced Src and EGFR phosphorylation levels and decreased cell proliferation. Moreover, heparanase expression correlated with increased phospho-EGFR levels and progression of head and neck carcinoma, thus providing a strong clinical support for EGFR modulation by heparanase.
Materials and methods
Antibodies and reagents
The following antibodies were purchased from Santa Cruz Biotechnology (Santa Cruz, CA): anti Src (sc-18 and sc-19), anti phosphotyrosine (sc-7020), anti Akt (sc-5298), anti EGFR (sc-03), anti pEGFR (Tyr1173, sc-12351R).
Polyclonal antibodies to phospho-Src (Tyr416), phospho-Akt (Ser473), and phospho- EGFR (Tyr845, Tyr1068, Tyr1148) were purchased from Cell Signaling (Beverly, MA). Anti actin antibody was purchased from Sigma (St. Louis, MO) and anti p120cat was purchased from Becton Dickinson (Palo Alto, CA). Bromodeoxyuridine (BrdU) was purchased from GE Healthcare (Buckinghamshire, England), and anti-BrdU monoclonal antibody-HRP conjugated was purchased from Roche (Mannheim, Germany). Anti-heparanase #1453 and #733 antibodies have previously been characterized (16). The selective p38 (SB 203580), PI 3-kinase (LY 294002), MAPK (PD 98059), Src (PP1, PP2, Src inhibitor I), and EGFR (AG1478) inhibitors were purchased from Calbiochem (San Diego, CA) and were dissolved in DMSO as stock solutions. DMSO was added to the cell culture as a control.
Cell culture and transfection
Human U87-MG glioma, Daoy meduloblastoma, LNCaP prostate carcinoma, MDA-MB-231 breast carcinoma, and A431 epidermoid carcinoma cells were purchased from the American Type Culture Collection (ATCC). Cells were cultured in Dulbecco’s Modified Eagle’s Medium (DMEM) supplemented with glutamine, pyruvate, antibiotics and 10% fetal calf serum in a humidified atmosphere containing 8% CO2 at 37°C. For stable transfection, cells were transfected with heparanase gene constructs using the FuGene reagent according to the manufacturer’s (Roche) instructions, selected with Zeocin (Invitrogen, Carlsbad, CA) for 2 weeks, expanded and pooled. Wild type and double mutated [glutamic acid residues 225 and 343; (DM)] recombinant heparanase proteins were purified from the conditioned medium of transfected HEK 293 cells, as described elsewhere (11).
Cell lysates, immunoprecipitation and protein blotting
Preparation of cell lysates, immunoprecipitation, and protein blotting was performed essentially as described (8, 11, 16, 17) and detailed in supplementary “Materials and Methods” section.
Cell proliferation
For growth curves, cells (5×10⁴) were seeded into 6 cm culture dishes in duplicates. Cells were dissociated with trypsin/EDTA and counted every other day using a Coulter Counter, and cell numbers were further confirmed by counting with a hemacytometer. Additionally, cell proliferation was analyzed by BrdU incorporation using cell proliferation labeling reagent (1:1000, GE Healthcare), as described (11). At least 1000 cells were counted for each cell type.
Colony formation in soft agar
Three ml of DMEM containing 0.5% Low Melt Agarose (Bio-Rad, Hercules, CA) and 10% fetal calf serum were poured into 60 mm Petri dish. The layer was covered with cell suspension (0.5×10⁴ cells) in 1.5 ml DMEM containing 0.3% Low Melt Agarose and 10% fetal calf serum, followed by addition of 2 ml DMEM containing 10% fetal calf serum. Medium was exchanged every 3 days. Colonies were visualized and counted under a microscope after three weeks, as described (11).
Heparanase silencing and PCR analysis
Transfection and analysis of cells with anti-heparanase siRNA and control siRNA vectors were carried out essentially as described (12, 14, 18, 19). Anti-heparanase, anti-Src, anti-Yes and control anti-green fluorescent protein (GFP) siRNA oligonucleotides (siGENOME ON-TARGET plus SMART pool duplex) were purchased from Dharmacon (Thermo Fisher Scientific Inc, Waltham, MA) and transfection was carried out with DharmaFECT reagent, according to the manufacturer’s (Dharmacon) instruction. Total RNA was extracted with TRIzol (Gibco BRL Life Technologies, Rockville, MD) and RNA (1 μg) was amplified using one step PCR amplification kit, according to the manufacturer’s (ABgene, Epsom, UK) instructions. The PCR primer sets were: Heparanase F- 5′-AGGTCTGCATATGGAGGCGG-3′, Heparanase R- 5′-TGAACTTCCTGGCCGGAGAG-3′; GAPDH F-5′ CCAGCCGAGCCACATCGCTC-3′, and GAPDH R-5′ATGAGCCCCAGCCTTCTCCAT-3′.
Immunocytochemistry and cell migration
Immunofluorescent and cell migration assays were performed essentially as described (8, 11, 16) and detailed in supplementary “Materials and Methods” section.
Immunostaining
Staining of formalin-fixed, paraffin-embedded 5 micron sections for phospho EGFR (Tyr1173) was performed essentially as described (20, 21) and detailed in supplementary “Material and Methods” section.
Tumorigenicity
Cells from exponential cultures of control (Vo) or heparanase transfected U87 cells were dissociated with trypsin/EDTA, washed with PBS and brought to a concentration of 5×10⁷cells/ml. Cell suspension (5×10⁶/0.1 ml) was inoculated subcutaneously at the right flank of 5-weeks old female Balb/C nude mice (n=7). Xenograft size was determined twice a week by externally measuring tumors in two dimensions using a caliper. Tumor volume (V) was determined by the equation V=L × W2 × 0.5, where L is the length and W the width of the xenograft. At the end of the experiment, mice were sacrificed and xenografts were resected, weighted and fixed in formalin. Paraffin-embedded 5 micron sections were stained with anti-phospho-Src (Tyr416) and anti-phospho-EGFR (Tyr1173) antibodies, using the Envision kit, according to the manufacturer’s instructions (Dako, Glostrup, Denmark), as described (20, 21). All animal experiments were approved by the Animal Care Committee of the Technion, Haifa, Israel.
Heparanase activity assay
Preparation of ECM-coated 35 mm dishes and determination of heparanase activity were performed as described in detail elsewhere (22, 23) and in supplementary “Materials and Methods” section.
Statistics
Univariate association between heparanase parameters (intensity and extent of staining) and clinical and pathological parameters as well as patients’ outcome, were analyzed using Chi Square tests (Pearson, Fisher exact test). Multivariable logistic regression was performed to detect independent parameters that affect patients’ status and to estimate relevant Odd’s ratio (OR) with 95% confidence interval (CI). A multivariable Cox’s proportional hazard model was perform with stepwise selection, to identify independent predictors of survival (p for enter and p to stay were set as 0.1). The model included all parameters with p<0.2 by the univariate analysis.
All experiments were repeated at least three times, with similar results. EGFR and Src phosphorylation is presented as mean ± SE of at least 5 independent experiments quantified by densitometry analysis.
Results
Heparanase facilitates EGFR phosphorylation
In order to explore the ability of heparanase to activate signaling cascades, heparanase was stable transfected into LNCaP prostate carcinoma cells and high levels of expression were confirmed by heparanase activity assay (Fig. 1A, upper panel) and immunoblotting (Fig. 1A, second panel). Increased EGFR phosphorylation levels were observed in cells over expressing heparanase by subjecting cell lysates to immunoprecipitation (IP) with an antibody directed against phosphotyrosine (PY), followed by immunoblotting with anti-EGFR antibody (Fig. 1A, third panel), or by employing the reciprocal experiment (i.e., IP for EGFR, blot for PY; Fig. 1A, fourth panel). Moreover, a marked elevation of EGFR phosphorylation was observed by employing an antibody directed against the phosphorylated state of tyrosine 1173 localized at the protein C-terminus (Fig. 1A, lower panel). We further applied this antibody and confirmed elevation of EGFR phosphorylation levels following heparanase over expression in Daoy medulloblastoma (Fig. 1B), U87 glioma (Fig. 1C), and A431 epidermoid carcinoma (Fig. 1D) cells (third panels). A consistent, 3–5 fold increase in EGFR phosphorylation following heparanase over expression was calculated by densitometry analysis of at least 5 independent experiments (Fig. 1B–D, bottom panels; Suppl. Fig. 1A). Immunofluorescent staining of heparanase transfected A431 (Fig. 2A, upper panel) and LNCaP cells (not shown) further revealed elevation of EGFR phosphorylation levels and, moreover, localization of the phosphorylated receptors to the cell surface of cultured cells (Fig. 2A, upper panel), and tumor xenografts (Fig. 2A, lower panel). In order to further substantiate these findings, purified recombinant latent heparanase (WT) was exogenously added to U87 glioma cells and EGFR phosphorylation was examined by immunoblotting. Increased EGFR phosphorylation on Tyr1173 was noted already 15 min following heparanase addition, peaked at 30 min and decreased thereafter (Fig. 2B, upper panel; Suppl. Fig. 1B, left). Similar results were observed following addition of heparanase to A431 and Daoy cells (not shown). Importantly, elevation of EGFR phosphorylation following heparanase addition correlated with a comparable ~5 fold increase in Akt phosphorylation levels (Fig. 2B, third panel; Suppl. Fig. 1B, left), a prominent signaling component down stream the EGFR, thus indicating EGFR activation (24–26). Although the latent 65 kDa heparanase protein was employed in these experiments, contamination with active (50+8 kDa) enzyme, and the consequent release of HS-bound growth factors (i.e., HB-EGF) can not be excluded. In order to verify this aspect, heparanase point mutated at amino acids critical for enzymatic catalysis (glutamic acids 225 and 343; DM) (27) was similarly employed. Addition of the double mutated heparanase facilitated EGFR phosphorylation 30 min following its addition to a magnitude comparable with the wild type heparanase protein (Fig. 2B, DM, right; Suppl. Fig. 1B, right), indicating that EGFR activation by heparanase does not involve enzymatic aspects, but likely protein secretion (see below). In order to further substantiate the correlation between heparanase expression and EGFR phosphorylation levels noted in heparanase transfected cells (Fig. 1A, B), we undertook the opposite approach and inhibited heparanase expression by means of anti-heparanase siRNA oligonucleotides. This approach was successfully applied to study the role of heparanase in tumor metastasis, angiogenesis, inflammation, and activation of signaling cascades (12, 14, 19, 28). As demonstrated in figure 2C, anti-heparanase siRNA effectively inhibited heparanase expression compared with control anti-GFP siRNA. Notably, heparanase down regulation correlated with a marked, 5-fold decrease in EGFR phosphorylation (Fig. 2C, third and bottom panels), indicating that endogenous heparanase is intimately involved in EGFR regulation.
Figure 1.

Heparanase modulates EGFR phosphorylation levels-gene transfection. LNCaP prostate carcinoma (A), Daoy medulloblastoma (B), U87 glioma (C) and A431 epidermoid carcinoma (D) cells (upper panels) were transfected with heparanase cDNA (Hepa) or control, empty vector (Vo). Enhanced heparanase expression was revealed by activity assay (top panels; ◆-control Vo cells,  -heparanase transfected cells) and immunoblotting, applying anti heparanase antibody (second panels, Hepa). EGFR phosphorylation was examined by subjecting cell lysates to immunoprecipitation (IP) with anti-phosphotyrosine (PY) antibody, followed by immunoblotting with anti EGFR antibody (A, third panel), or by employing the reciprocal experiment (IP for EGFR, blot with anti PY; fourth panel). Elevation of EGFR phosphorylation following heparanase transfection was also revealed by immunoblotting with anti phospho-EGFR (Tyr1173) antibody (A, lower panel), and this antibody was further employed to examine EGFR phosphorylation in Daoy (B), U87 (C), and A431 (D) cells (third panels, p-EGFR). Equal EGFR loading is shown in the fourth panels (B–D; EGFR). EGFR phosphorylation index was calculated by densitometry analysis of phosphorylated EGFR (Tyr1173) levels divided by the total EGFR values. Data is presented as fold increase of EGFR phosphorylation compared with control, Vo cells, set arbitrary to a value of 1 (B–D, lower panels).
Figure 2.

Heparanase modulates EGFR phosphorylation levels-exogenous addition and gene silencing. A. Immunostaining. Control, Vo and heparanase transfected A431 cells (Hepa, upper panels), or 5 micron sections of tumor xenograft produced by these cells (second panels) were subjected to immunofluorescent (upper panels) or immunohistochemistry staining with anti phospho-EGFR antibody (Tyr1173). B. Heparanase addition. U87 glioma cells were left untreated as control (0) or incubated with recombinant 65 kDa heparanase protein (WT; 1 μg/ml) for the time indicated (min; left panels). Cell lysates were subjected to immunoblotting with anti-phospho- EGFR (Tyr1173, upper panel), anti-EGFR (second panel), anti-phospho-Akt (p-Akt; third panel), and anti-Akt (fourth panel) antibodies. Elevation of EGFR phosphorylation (Tyr1173) following exogenous addition of double-mutated (DM), inactive heparanase (1 μg/ml) is shown in the right panels. C. Heparanase gene silencing. LNCaP prostate carcinoma cells were left untreated as control (Con) or transfected with anti-GFP or anti-heparanase siRNA oligonucleotides. Total RNA was extracted two days following transfection and heparanase expression was examined by RT-PCR analysis (upper panel). GAPDH transcript was used as an internal control for RNA loading (second panel). Cell lysates were prepared from corresponding cultures and subjected to immunoblotting with anti-phospho-EGFR (Tyr1173, third panel), and anti-EGFR (fourth panel) antibodies. Densitometry analysis of EGFR phosphorylation levels following anti-heparanase siRNA treatment is shown in the lower panel. Control cells were arbitrary set to a value of 1.
EGFR activation by heparanase involves Src
We have previously reported that heparanase induces the expression of VEGF, and that this effect is mediated by Src (14). We therefore suspected that EGFR activation by heparanase is similarly mediated by Src and examined this possibility by exposing heparanase transfected U87 (Suppl. Fig. 2A, upper two panels) and A431 (Suppl. Fig. 2A, lower two panels) cells to specific inhibitors of key signaling molecules. No significant decrease in EGFR phosphorylation levels was observed following cell treatment with PI 3-kinase (LY), p38 (SB), or MAPK (PD) inhibitors (Suppl. Fig. 2A, upper and third panels). In contrast, EGFR phosphorylation was markedly reduced in cells treated with the Src inhibitor PP2 (Suppl. Fig. 2A), and a similar decrease was noted in cells treated with two additional pharmacological inhibitors of Src (PP1 and Src inhibitor I; not shown). As little as 5 μM PP2 resulted in a significant inhibition of EGFR phosphorylation on tyrosine 1173 (Suppl. Fig. 2B, upper panel), and correlated with decreased Akt phosphorylation (Suppl. Fig. 2B, fourth panel). These findings suggest that heparanase enhances EGFR phosphorylation via activation of Src. This notion is supported by the following experiments. Enhanced phosphorylation of Src on tyrosine 416, thought to represent activated Src kinase, was observed following heparanase over expression in U87 (Hepa, Fig. 3A, third panel), A431, and LNCaP cells (Suppl. Fig. 2C, middle panels), and correlated with a comparable elevation of EGFR phosphorylation (Fig. 3A, upper panel; Suppl. Fig. 2C, upper panels). Notably, EGFR and Src activation requires heparanase secretion. Thus, heparanase variant that fail to get secreted (Fig. 3A; Δ15) (18) did not induce EGFR and Src phosphorylation. In contrast, enzymatically inactive heparanase variant which is secreted and accumulates extracellularly to high levels due to deletion of its heparin binding domain (Fig. 3A, Δ10) (18) effectively stimulated EGFR and Src phosphorylation, clearly deciphering HS-independent heparanase function. Likewise, Src (Fig. 3B, third panels) and EGFR (Fig. 3B, upper panels) phosphorylation were noted to be induced following heparanase over expression (Fig. 2B, left, 0), or exogenous addition of wild type (Fig. 3B, middle, WT, 0) or mutated, enzymatically inactive (DM; Fig. 3B, right, 0) heparanase proteins, and this effect was markedly attenuated in cells treated with 5 μM of the Src inhibitor, PP2 (Fig. 3B, 5; Suppl. Fig. 3). In agreement with this notion, we found reduced Src phosphorylation levels following heparanase gene silencing by means of anti-heparanase siRNA (Fig. 3C, left; Suppl. Fig. 2E), further supporting a role of endogenous heparanase in Src and EGFR (Fig. 2C) regulation. Similarly, treatment of heparanase transfected LNCaP cells with anti-Src siRNA oligonucleotides resulted in a marked decrease in Src (Fig. 3C, middle, upper panel) and EGFR (Fig. 3C, middle, third panel) phosphorylation levels. Likewise, induction of Src and EGFR phosphorylation was evident following exogenous addition of heparanase to LNCaP cells transfected with control siRNA oligonucleotides (Fig. 3C, right, si-GFP) and this induction was neglected in cells transfected with anti-Src si-RNA oligos (Fig. 3C, right, si-Src). In contrast, treatment with anti-Yes siRNA did not affect EGFR phosphorylation levels (not shown). Moreover, heparanase over expression (Suppl. Fig. 2F) or exogenous addition (not shown) was noted to induce the phosphorylation of p120 catenin on tyrosine residues, a protein originally identified as a Src substrate (29), in agreement with our previous findings (14). Ligands induce dimerization of EGFR, resulting in rapid autophosphorylation of tyrosine residues at positions 992, 1068, 1086, 1148, and 1173 (30). Src activation, however, can lead to phosphorylation of additional tyrosine residues of the EGFR (i.e., at positions 703, 845, 1101, 1148, and 1173) (30). Among these, tyrosine 845 is considered most important to EGFR signaling (30–32). We, therefore, utilized antibodies directed against the phosphorylated state of tyrosine residue 845 and examined EGFR phosphorylation following heparanase addition or over expression. We found that tyrosine 845 is phosphorylated upon heparanase addition, in magnitude and kinetics comparable with tyrosine 1173 (Suppl. Fig. 4A). Moreover, heparanase over expression induced the phosphorylation of both tyrosine residues to a similar extent, and this effect was attenuated by the Src inhibitor PP2 (Fig. 3D; Suppl. Fig. 4B), or by Src gene silencing (Fig. 3C, fourth panels). In contrast, no significant elevation in the phosphorylation levels of tyrosine residues 1068 or 1148 could be detected following heparanase stimulation (not shown). We concluded that heparanase stimulates EGFR on selected tyrosine residues such as 845 and 1173, likely involving Src activation.
Figure 3.

EGFR activation by heparanase is mediated via Src. A. U87 cells were transfected with control empty vector (Vo), or plasmids encoding wild type heparanase, heparanase lacking the heparin binding domain (Gln270-Lys280; Δ10) that results in accumulation of heparanase in the culture medium (18), or lacking the heparin binding domain (Lys158-Asn171; Δ15) resulting in a non-secreted protein (18). Cell lysates were subjected to immunoblotting with anti-phospho-EGFR (Tyr1173; upper panel), anti-EGFR (second panel), anti-phospho-Src (Tyr416; third panel), and anti-Src (lower panel) antibodies. Note that enhanced EGFR and Src phosphorylation requires heparanase secretion. B. Control (Vo) and heparanase transfected (Hepa) LNCaP cells were left untreated (0) or incubated with the Src inhibitor PP2 (5 μM). Cell lysates were subjected to immunoblotting with anti-phospho-EGFR (Tyr1173, upper panel), anti-EGFR (second panel), anti-phospho-Src (Tyr416; third panel), and anti-Src (fourth panel) antibodies. EGFR and Src phosphorylation levels were similarly evaluated in control untreated parental LNCaP cells (Con) and following addition of the wild type (WT, middle panels) or double mutated (DM; right panels) heparanase proteins, without (0) or with 5 μM PP2 (5). C. Gene silencing. Heparanase: LNCaP cells were transfected with anti-GFP or anti-heparanase siRNA oligonucleotides and cell lysates were subjected to immunoblotting with anti-phospho-Src (p-Src; upper panel) and anti-Src (lower panel) antibodies. Note decreased Src phosphorylation following heparanase down regulation. Src gene silencing. Heparanase transfected LNCaP cells were transfected anti-GFP or anti-Src siRNAs and cell lysates were subjected to immunoblotting applying anti-phospho-Src (p-Src, upper panel), anti-Src (second panel), anti-phospho-EGFR (1173, third panel), anti-phospho-EGFR (845, fourth panel), and anti-EGFR (lower panel) antibodies (middle panels). Parental LNCaP cells were similarly transfected with anti-GFP or anti-Src siRNA oligonucleotides and incubated (30 min, 37°C) without (−) or with (+) purified recombinant heparanase protein. Cell lysates were subjected to immunoblotting applying the above mentioned antibodies (right panels). D. Heparanase transfected LNCaP cells were untreated (Hepa) or incubated with the indicated concentration of Src inhibitor PP2 (μM) for 30 min. Mock transfected cells were used as control (Vo). Cell lysates were then subjected to immunoblotting with anti-phospho-EGFR (Tyr1173, upper panel), anti-phospho-EGFR (Tyr845, second panel), anti-EGFR (third panel), anti-phospho-Src (Tyr416; fourth panel), and anti-Src (lower panel) antibodies.
Figure 5.
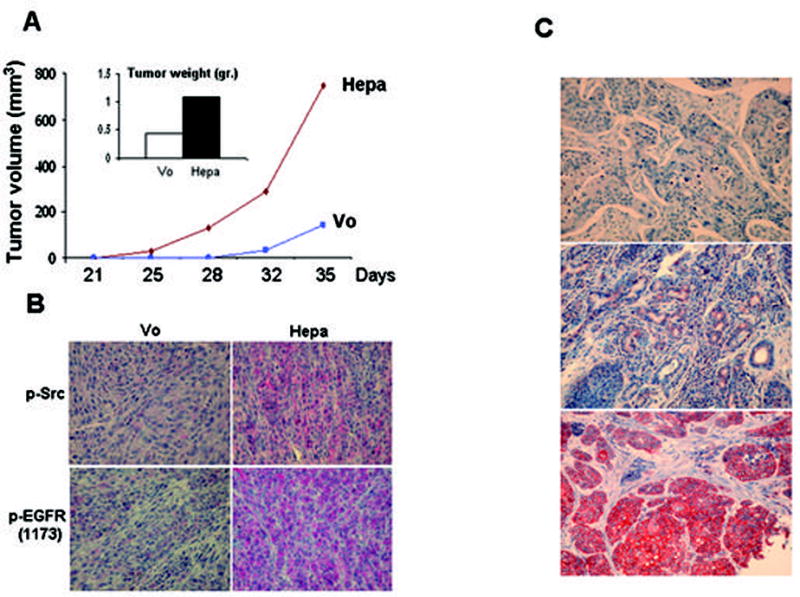
Tumor xenograft and biopsy specimens. U87 cells transfected with control empty vector (Vo) or heparanase plasmid (Hepa) were inoculated subcutaneously (5×10⁶/0.1ml) and tumor volume was measured twice a week starting on day 21 (A). At the end of the experiment on day 35, tumors were resected, weighted (A, inset) and fixed in formalin. Paraffin-embedded 5 micron sections were stained with anti-phospho-EGFR (Tyr1173, B, lower panels), and anti-phospho-Src (Tyr416, B, upper panels) antibodies. C. Immunohistochemical staining of phospho-EGFR in human head and neck tumor specimens. Formalin-fixed, paraffin-embedded 5 micron sections of head and neck tumors were subjected to immunostaining of phosphorylated EGFR, applying anti-phospho-EGFR (Tyr1173) antibody, as described under ‘Materials and Methods’. Shown are representative photomicrographs of phospho-EGFR negative (upper panel), and positively stained specimens scored as weak (+1; second panel) and strong (+2; third panel) intensity.
Heparanase stimulates cell proliferation that is mediated by Src and EGFR
We, next, examined the cellular consequences of Src and EGFR activation by heparanase. Heparanase over expression in LNCaP prostate carcinoma cells resulted in a nearly 2-fold increase in cell number (Fig. 4A, Hepa) and treatment with EGFR (Fig. 4A, Hepa+1478) or Src (Suppl. Fig. 5A, Hepa+PP2) inhibitors brought cell number to the level of control (Vo). Enhanced, 2.5-fold increase in cell proliferation was further confirmed by BrdU incorporation (Fig. 4B). Notably, heparanase transfected LNCaP cells placed in soft agar produced significantly larger colonies compared with control (Vo) cells (Fig. 4C, Hepa), while treatment with EGFR (Fig. 4C, Hepa+1478) or Src (Fig. 4C, Hepa+PP2) inhibitors brought colony size to the level of control. Exposing control (Vo) cells to PP2 or 1478 compounds did not affect colony size (Suppl. Fig. 5B). In order to further explore the involvement of heparanase in cell proliferation we examined BrdU incorporation following treatment with anti-heparanase siRNA oligonucleotides. We found a consistent, 2–3 fold decrease in BrdU incorporation following heparanase gene silencing in LNCaP (Fig. 4D, left), MDA-MB-231 (Fig. 4D, middle) and U87 (Fig. 4D, right) cells. These results suggest that endogenous heparanase plays a role in the regulation of cancer cell proliferation, likely by modulating the phosphorylation levels and activity of Src kinase and EGFR. An in vivo support for this notion is demonstrated in a tumor xenograft model. Heparanase over expression in U87 glioma cells resulted in a 4- and 2.5-fold increase in tumor volume and weight, respectively (Fig. 5A), in agreement with previous findings (11). Notably, immunostaining of tumor xenograft sections revealed a marked enhancement of phospho Src (Tyr416) and phospho EGFR (Tyr1173) reactivity (Fig. 5B), further supporting a causal relationship between heparanase, the phosphorylation status of Src and EGFR, and tumor progression.
Figure 4.

Heparanase modulates cell proliferation. Heparanase transfected LNCaP cells were plated at 5×10⁴ cells per dish without (Hepa) or with EGFR inhibitor (Hepa+1478; 5μM) and cell number was determined 3, 5, and 7 days following plating by a Coulter counter and hemacytometer. Mock transfected cells (Vo) incubated without or with the EGFR inhibitor (Vo+1478; 5μM) were used as control. B. BrdU incorporation. Direct measurement of DNA synthesis is demonstrated by BrdU incorporation. Sub-confluent cultures of control (Vo) and heparanase transfected (Hepa) LNCaP cells were grown in serum-free medium for 20 h followed by incubation with BrdU (1:1000) for 2 h. Cells were then fixed and immunostained with anti BrdU monoclonal antibodies. Positively stained, red-brown nuclei were counted vs. blue, hematoxilin counter-stained nuclei. At least 1000 cells were counted for each cell type and the percentage of positively stained cells is noted in each panel. C. Colony formation in soft agar. Control (Vo) and heparanase transfected LNCaP cells (5×10³ cells/dish) were mixed with soft agar and cultured for 3 weeks in the absence (Hepa) or presence of Src (Hepa+PP2; 5μM) or EGFR (Hepa+1478; 10μM) inhibitors. Shown are photomicrographs of colonies at low (×10; upper panels) and high (×100; lower panels) magnification. D. Gene silencing. LNCaP (left panels), MDA-MB-231 (middle panels), and U87 (right panels) cells were transfected with anti-GFP (si-GFP; upper panels) or anti-heparanase (si-Hepa; lower panels) siRNA oligonucleotides and BrdU incorporation was evaluated as above, except that cells were not serum-starved. Note 2.5–4 fold decrease in cell proliferation following heparanase gene silencing.
Heparanase expression correlates with the phosphorylation status of EGFR in squamous cell carcinoma of the head and neck
We have recently reported that heparanase expression by head and neck carcinomas correlates with tumor progression and inversely correlates with patients’ status (21). In order to investigate the clinical significance of our findings, we subjected this cohort of tumor biopsies to immunostaining with phospho-specific EGFR antibodies (Tyr1173) and correlated the staining intensity and extent (i.e., percent of positively stained cells) with heparanase staining (21) and clinical parameters. Among the 67 biopsies available for staining, 22 (33%) stained negative for phospho-EGFR (Tyr1173; Fig. 5C, upper panel) and 45 (67%) were positive. The phospho-EGFR-positive group was further categorized according to the intensity and extent of staining. Thus, weak staining (+1; Fig. 5C, middle panel) was found in 64% (29/45) of positive specimens, while 36% (16/45) stained strongly (+2; Fig. 5C, lower panel) for phospho-EGFR. According to the extent criteria, 51% (23/45) of the specimens that positively stained for phospho-EGFR were scored as low extent (+1), and 49% (22/45) were scored as high extent (+2). Phospho-EGFR staining intensity correlated with tumor size (T; p=0.006; Suppl. Table 1), and a similar correlation was found between phospho-EGFR staining extent and tumor size (T; p=0.01; Suppl. Table 2), in agreement with the critical role of EGFR activation in head and neck tumor progression (33), and similar to the correlation found between heparanase expression and head and neck tumor progression (21). Notably, statistically significant correlation was found between heparanase expression and phospho-EGFR staining (p=0.05). Even more significant was the correlation between the cellular localization of heparanase and phospho-EGFR staining intensity. Thus, while most cases (73%) exhibiting nuclear localization of heparanase were found negative for phospho-EGFR (Tyr1173), 69% of the cases with cytoplasmic heparanase stained strongly (+2) for phospho-EGFR (Table 1; p=0.03). This finding is in agreement with a significant association between nuclear localization of heparanase and good prognosis of head and neck cancer patients (29). Logistic regression analysis revealed that both heparanase staining extent and EGFR phosphorylation (Tyr1173) are significant parameters for tumor T stage (p=0.04 and 0.01, respectively). We further employed multivariate logistic regression analysis to examine the contribution of different parameters to patients’ status, including heparanase cellular localization and EGFR phosphorylation (Suppl. Table 3). The most significant parameter that influenced the status of patients was heparanase localization (cytoplasmic vs. nuclear, p=0.003), while EGFR phosphorylation (Tyr1173) was not significant (p=0.23). When tumor T stage (T0-2 vs. T3-4) was included, heparanase localization continued to be the most significant parameter for patients’ status (p=0.006), followed by the T stage (p=0.03), while EGFR phosphorylation appeared insignificant (p=0.69) (Suppl. Table 4). Similar results were obtained applying Cox’s Proportional Hazard Model (not shown). These findings support our in vitro studies and suggest that heparanase facilitates the progression of head and neck carcinomas, and possibly other human malignancies, by modulating the phosphorylation levels and activity of selected signaling molecules such as Src and EGFR.
Table 1.
Enhanced EGFR phosphorylation correlates with cytoplasmic, rather than nuclear localization of heparanase.
| p-EGFR Intensity | Cytoplasmic n (%) | Nuclear n (%) | Total |
|---|---|---|---|
| 0 | 6 (27) | 16 (73) | 22 |
| 1 | 12 (41) | 17 (59) | 29 |
| 2 | 11 (69) | 5 (31) | 16 |
| 29 | 38 | 67 |
P=0.03
Discussion
Heparanase activity has long been correlated with the metastatic potential of tumor-derived cells, a notion that is now well supported experimentally and clinically, urging the development of heparanase inhibitors (3–7, 34). Heparanase up regulation was found in most human carcinomas (3), yet its role in primary tumor progression is poorly understood. In some cases, heparanase up regulation correlated with tumors larger in size (3, 21), finding that was recapitulated in tumor xenograft models (11, 35, 36). Enhanced tumor progression is likely due, at least in part, to the induction of an angiogenic response. Elevation of microvessel density correlated with heparanase induction in solid (3) and hematological (37) malignancies, and was also evident in tumor xenografts produced by cells over expressing heparanase (11, 35, 36) and in heparanase treated wounds (38, 39). The angiogenic capacity of heparanase has been traditionally attributed to its enzymatic activity, facilitating the sprouting of endothelial cells through the underlying basement membrane to form new capillaries, and releasing HS-bound angiogenic growth factors such as bFGF and VEGF (15). More recently, heparanase was noted to induce the expression of angiogenic mediators such as tissue factor and VEGF in a manner that involves no enzymatic activity and is mediated by p38 and Src activation (13, 14), thus expanding the scope of heparanase function. Here, we report the ability of heparanase to activate Src in a variety of human tumor-derived cell lines. This was demonstrated by over expressing or following exogenous addition of heparanase and, moreover, by employing heparanase gene silencing approach (Fig. 3; Suppl. Figs. 2–4), indicating that the endogenous levels of heparanase are intimately engaged in Src modulation. Activated Src, in turn, can induce the phosphorylation of EGFR on selected tyrosine residues (i.e., 845 and 1173), leading to enhanced cell proliferation (Fig. 4) and migration (Suppl. Fig. 5C,D). Significantly, heparanase gene silencing by means of siRNA oligonucleotides was associated with reduced BrdU incorporation in several cancer cell lines (Fig. 4), critically supporting a role of endogenous heparanase in tumor cell proliferation. This notion is best exemplified by the strong clinical correlation found between heparanase expression, EGFR phosphorylation and tumor progression in head and neck cancer patients (Tables 1; Suppl. Tables 1–4) (21), depending on heparanase localization. Thus, while cytoplasmic heparanase correlated with intense staining of phospho-EGFR, most cases exhibiting nuclear localization of heparanase were scored negative for phospho-EGFR (73%; Table 1), in agreement with favorable outcome of these patients (21). These findings further support the good prognosis associated with nuclear heparanase in gastric and esophageal carcinomas (40, 41), due, possibly, to reduced EGFR activation. Over expression of EGFR has been reported in ~80% of head and neck tumors compared with low levels in normal mucosa, representing an early event in head and neck carcinogenesis (33, 42).
However, while EGFR up-regulation is well implicated in tumor aggressiveness, it may under signify the role of EGFR in primary tumor growth. Indeed, progress in the field has uncovered multiple mechanisms that lead to EGFR activation by various proteins and stimuli including, among others, cytokine receptors, integrins, cellular stress such as UV irradiation and oxidants, and G protein-coupled receptors (32, 43, 44). The latter was shown to be mediated by shedding of membrane-tethered HB-EGF by metalloproteases (44, 45). Notably, EGFR activation by heparanase does not involve enzymatic aspects since phosphorylation of EGFR to comparable levels was observed following the addition of enzymatically active or inactive heparanase proteins (Figs. 2B, 3B; Suppl. Fig. 1B). The ability of exogenously added heparanase to stimulate EGFR and Src phosphorylation suggests that heparanase secretion, rather than activity, is required. This is best exemplified by cells transfected with a gene construct lacking the heparin binding domains of heparanase (Fig. 2A). Thus, deletion of the region Lys158-Asn171, which results in a protein variant that is not secreted (18), failed to induce EGFR phosphorylation (Δ15, Fig. 3A), while deletion of Gln270-Lys280, which results in accumulation of the protein to high levels in the culture medium (18), efficiently stimulated the phosphorylation of both Src and EGFR (Δ10, Fig. 3A). The ability of heparanase protein lacking the heparin binding domain (Δ10) to induce EGFR phosphorylation also excludes the release of HB-EGF, or other HS-bound growth factors, by non-enzymatic means (i.e., competition for HS binding sites).
In other cases, transactivation of EGFR was considered ligand-independent and was therefore attributed to intracellular mechanisms. c-Src has been shown to mediate ligand-independent EGFR phosphorylation on multiple sites, most notably tyrosine 845 (30, 32, 44, 46). Stimulation with heparanase induced EGFR phosphorylation on tyrosine 845 and 1173 to comparable levels (Fig. 3; Suppl. Fig. 4), which was suppressed by Src inhibitors (Fig. 3; Suppl. Figs. 3,4). This is in agreement with the role of Src in coupling various extracellular and intracellular signals to EGFR activation (47–49).
EGFR activation appears to be more prevalent in tumor cells that over express a variety of proteins while increase in EGFR levels is not evident (50). Heparanase over expression by human carcinomas emerges as such a protein that affects EGFR phosphorylation. Indeed, most of our studies were carried out with cells lines that express relatively low levels of EGFR (i.e., U87, LNCaP), with the exception of A431 cells. Thus, EGFR phosphorylation, rather than expression levels, evident by staining with phospho-specific antibodies such as those directed against Tyr845 or Tyr1173 (Fig. 5), may be employed for tumor diagnosis and determination of patients prevalence for treatment with anti-EGFR small molecule inhibitors such as gefitinib or erlotinib.
Taken together, our results emphasize the notion that heparanase facilitates signaling cascades and modulates the activation state of Src, independent of its enzymatic activity. Activated Src, in turn, phosphorylates EGFR on selected tyrosine residues, leading to enhanced cell migration, cell proliferation and tumor growth. Thus, apart of its enzymatic activity involved in cancer metastasis and angiogenesis (3–9), heparanase appears to modulate two critical systems responsible for tumor progression, namely VEGF (14) and EGFR. The ability of heparanase to function in an apparently enzymatic independent manner and to activate signaling molecules such as Akt, p38, and Src (8–14) is intriguing and affects the way the protein is envisioned. Thus, while attention was mainly focused on compounds that inhibit heparanase enzymatic activity, no information is available on protein domains responsible for the non-enzymatic functions of heparanase. In this respect, identification of a putative heparanase receptor, possibly residing in lipid rafts (12) is a major future challenge.
Neutralizing heparanase enzymatic and non-enzymatic functions is therefore expected to profoundly affect tumor progression and metastasis. Similarly, co-administration of EGFR and heparanase inhibitors may be more efficacious than each inhibitor alone. Studies examining this possibility are currently underway.
Supplementary Material
Acknowledgments
This work was supported by grants from the Israel Science Foundation (grant 549/06); National Cancer Institute, NIH (grant RO1-CA106456); the DKFZ-MOST cooperation program in cancer research; and the Rappaport Family Institute Fund. The author is a Research Professor of the Israel Cancer Research Fund.
References
- 1.Vlodavsky I, Friedmann Y. Molecular properties and involvement of heparanase in cancer metastasis and angiogenesis. J Clin Invest. 2001;108:341–7. doi: 10.1172/JCI13662. [DOI] [PMC free article] [PubMed] [Google Scholar]
- 2.Parish CR, Freeman C, Hulett MD. Heparanase: a key enzyme involved in cell invasion. Biochim Biophys Acta. 2001;1471:M99–108. doi: 10.1016/s0304-419x(01)00017-8. [DOI] [PubMed] [Google Scholar]
- 3.Ilan N, Elkin M, Vlodavsky I. Regulation, function and clinical significance of heparanase in cancer metastasis and angiogenesis. Int J Biochem Cell Biol. 2006;38:2018–39. doi: 10.1016/j.biocel.2006.06.004. [DOI] [PubMed] [Google Scholar]
- 4.Vreys V, David G. Mammalian heparanase: what is the message? J Cell Mol Med. 2007;11:427–52. doi: 10.1111/j.1582-4934.2007.00039.x. [DOI] [PMC free article] [PubMed] [Google Scholar]
- 5.Ferro V, Hammond E, Fairweather JK. The development of inhibitors of heparanase, a key enzyme involved in tumour metastasis, angiogenesis and inflammation. Mini Rev Med Chem. 2004;4:693–702. doi: 10.2174/1389557043403729. [DOI] [PubMed] [Google Scholar]
- 6.Miao HQ, Liu H, Navarro E, Kussie P, Zhu Z. Development of heparanase inhibitors for anti-cancer therapy. Curr Med Chem. 2006;13:2101–11. doi: 10.2174/092986706777935230. [DOI] [PubMed] [Google Scholar]
- 7.Vlodavsky I, Ilan N, Naggi A, Casu B. Heparanase: structure, biological functions, and inhibition by heparin-derived mimetics of heparan sulfate. Curr Pharm Des. 2007;13:2057–73. doi: 10.2174/138161207781039742. [DOI] [PubMed] [Google Scholar]
- 8.Gingis-Velitski S, Zetser A, Flugelman MY, Vlodavsky I, Ilan N. Heparanase induces endothelial cell migration via protein kinase B/Akt activation. J Biol Chem. 2004;279:23536–41. doi: 10.1074/jbc.M400554200. [DOI] [PubMed] [Google Scholar]
- 9.Goldshmidt O, Zcharia E, Cohen M, et al. Heparanase mediates cell adhesion independent of its enzymatic activity. FASEB J. 2003;17:1015–25. doi: 10.1096/fj.02-0773com. [DOI] [PubMed] [Google Scholar]
- 10.Sotnikov I, Hershkoviz R, Grabovsky V, et al. Enzymatically quiescent heparanase augments T cell interactions with VCAM-1 and extracellular matrix components under versatile dynamic contexts. J Immunol. 2004;172:5185–93. doi: 10.4049/jimmunol.172.9.5185. [DOI] [PubMed] [Google Scholar]
- 11.Zetser A, Bashenko Y, Miao H-Q, Vlodavsky I, Ilan N. Heparanase affects adhesive and tumorigenic potential of human glioma cells. Cancer Res. 2003;63:7733–41. [PubMed] [Google Scholar]
- 12.Ben-Zaken O, Gingis-Velitski S, Vlodavsky I, Ilan N. Heparanase induces Akt phosphorylation via a lipid raft receptor. Biochem Biophys Res Commun. 2007;361:829–34. doi: 10.1016/j.bbrc.2007.06.188. [DOI] [PMC free article] [PubMed] [Google Scholar]
- 13.Nadir Y, Brenner B, Zetser A, et al. Heparanase induces tissue factor expression in vascular endothelial and cancer cells. J Thromb Haemost. 2006;4:2443–51. doi: 10.1111/j.1538-7836.2006.02212.x. [DOI] [PubMed] [Google Scholar]
- 14.Zetser A, Bashenko Y, Edovitsky E, Levy-Adam F, Vlodavsky I, Ilan N. Heparanase induces vascular endothelial growth factor expression: correlation with p38 phosphorylation levels and Src activation. Cancer Res. 2006;66:1455–63. doi: 10.1158/0008-5472.CAN-05-1811. [DOI] [PubMed] [Google Scholar]
- 15.Elkin M, Ilan N, Ishai-Michaeli R, et al. Heparanase as mediator of angiogenesis: mode of action. FASEB J. 2001;15:1661–3. doi: 10.1096/fj.00-0895fje. [DOI] [PubMed] [Google Scholar]
- 16.Zetser A, Levy-Adam F, Kaplan V, et al. Processing and activation of latent heparanase occurs in lysosomes. J Cell Sci. 2004;117:2249–58. doi: 10.1242/jcs.01068. [DOI] [PubMed] [Google Scholar]
- 17.Gingis-Velitski S, Zetser A, Kaplan V, et al. Heparanase uptake is mediated by cell membrane heparan sulfate proteoglycans. J Biol Chem. 2004;279:44084–92. doi: 10.1074/jbc.M402131200. [DOI] [PubMed] [Google Scholar]
- 18.Levy-Adam F, Abboud-Jarrous G, Guerrini M, Beccati D, Vlodavsky I, Ilan N. Identification and characterization of heparin/heparan sulfate binding domains of the endoglycosidase heparanase. J Biol Chem. 2005;280:20457–66. doi: 10.1074/jbc.M414546200. [DOI] [PubMed] [Google Scholar]
- 19.Edovitsky E, Elkin M, Zcharia E, Peretz T, Vlodavsky I. Heparanase gene silencing, tumor invasiveness, angiogenesis, and metastasis. J Natl Cancer Inst. 2004;96:1219–30. doi: 10.1093/jnci/djh230. [DOI] [PubMed] [Google Scholar]
- 20.Ben-Izhak O, Kaplan-Cohen V, Ilan N, Gan S, Vlodavsky I, Nagler R. Heparanase expression in malignant salivary gland tumors inversely correlates with long-term survival. Neoplasia. 2006;8:879–84. doi: 10.1593/neo.06382. [DOI] [PMC free article] [PubMed] [Google Scholar]
- 21.Doweck I, Kaplan-Cohen V, Naroditsky I, Sabo E, Ilan N, Vlodavsky I. Heparanase localization and expression by head and neck cancer: correlation with tumor progression and patient survival. Neoplasia. 2006;8:1055–61. doi: 10.1593/neo.06577. [DOI] [PMC free article] [PubMed] [Google Scholar]
- 22.Levy-Adam F, Miao HQ, Heinrikson RL, Vlodavsky I, Ilan N. Heterodimer formation is essential for heparanase enzymatic activity. Biochem Biophys Res Commun. 2003;308:885–91. doi: 10.1016/s0006-291x(03)01478-5. [DOI] [PubMed] [Google Scholar]
- 23.Vlodavsky I, Friedmann Y, Elkin M, et al. Mammalian heparanase: gene cloning, expression and function in tumor progression and metastasis. Nat Med. 1999;5:793–802. doi: 10.1038/10518. [DOI] [PubMed] [Google Scholar]
- 24.Bunn PA, Jr, Franklin W. Epidermal growth factor receptor expression, signal pathway, and inhibitors in non-small cell lung cancer. Semin Oncol. 2002;29 (Suppl 5):38–44. doi: 10.1053/sonc.2002.35646. [DOI] [PubMed] [Google Scholar]
- 25.Scaltriti M, Baselga J. The epidermal growth factor receptor pathway: a model for targeted therapy. Clin Cancer Res. 2006;12:5268–72. doi: 10.1158/1078-0432.CCR-05-1554. [DOI] [PubMed] [Google Scholar]
- 26.Senderowicz AM. Targeting cell cycle and apoptosis for the treatment of human malignancies. Curr Opin Cell Biol. 2004;16:670–8. doi: 10.1016/j.ceb.2004.09.014. [DOI] [PubMed] [Google Scholar]
- 27.Hulett MD, Hornby JR, Ohms SJ, et al. Identification of active-site residues of the pro-metastatic endoglycosidase heparanase. Biochemistry. 2000;39:15659–67. doi: 10.1021/bi002080p. [DOI] [PubMed] [Google Scholar]
- 28.Edovitsky E, Lerner I, Zcharia E, Peretz T, Vlodavsky I, Elkin M. Role of endothelial heparanase in delayed-type hypersensitivity. Blood. 2006;107:3609–16. doi: 10.1182/blood-2005-08-3301. [DOI] [PMC free article] [PubMed] [Google Scholar]
- 29.Reynolds AB. p120-catenin: Past and present. Biochim Biophys Acta. 2007;1773:2–7. doi: 10.1016/j.bbamcr.2006.09.019. [DOI] [PMC free article] [PubMed] [Google Scholar]
- 30.Bromann PA, Korkaya H, Courtneidge SA. The interplay between Src family kinases and receptor tyrosine kinases. Oncogene. 2004;23:7957–68. doi: 10.1038/sj.onc.1208079. [DOI] [PubMed] [Google Scholar]
- 31.Biscardi JS, Ishizawar RC, Silva CM, Parsons SJ. Tyrosine kinase signalling in breast cancer: epidermal growth factor receptor and c-Src interactions in breast cancer. Breast Cancer Res. 2000;2:203–10. doi: 10.1186/bcr55. [DOI] [PMC free article] [PubMed] [Google Scholar]
- 32.Haskell MD, Slack JK, Parsons JT, Parsons SJ. c-Src tyrosine phosphorylation of epidermal growth factor receptor, P190 RhoGAP, and focal adhesion kinase regulates diverse cellular processes. Chemical Rev. 2001;101:2425–40. doi: 10.1021/cr0002341. [DOI] [PubMed] [Google Scholar]
- 33.Kalyankrishna S, Grandis JR. Epidermal growth factor receptor biology in head and neck cancer. J Clin Oncol. 2006;24:2666–72. doi: 10.1200/JCO.2005.04.8306. [DOI] [PubMed] [Google Scholar]
- 34.McKenzie EA. Heparanase: a target for drug discovery in cancer and inflammation. Br J Pharmacol. 2007;151:1–14. doi: 10.1038/sj.bjp.0707182. [DOI] [PMC free article] [PubMed] [Google Scholar]
- 35.Cohen I, Pappo O, Elkin M, et al. Heparanase promotes growth, angiogenesis and survival of primary breast tumors. Int J Cancer. 2006;118:1609–17. doi: 10.1002/ijc.21552. [DOI] [PubMed] [Google Scholar]
- 36.Doviner V, Maly B, Kaplan V, et al. Spatial and temporal heparanase expression in colon mucosa throughout the adenoma-carcinoma sequence. Mod Pathol. 2006;19:878–88. doi: 10.1038/modpathol.3800603. [DOI] [PubMed] [Google Scholar]
- 37.Kelly T, Miao H-Q, Yang Y, et al. High heparanase activity in multiple myeloma is associated with elevated microvessel density. Cancer Res. 2003;63:8749–56. [PubMed] [Google Scholar]
- 38.Elkin M, Cohen I, Zcharia E, et al. Regulation of heparanase gene expression by estrogen in breast cancer. Cancer Res. 2003;63:8821–6. [PubMed] [Google Scholar]
- 39.Zcharia E, Zilka R, Yaar A, et al. Heparanase accelerates wound angiogenesis and wound healing in mouse and rat models. FASEB J. 2005;19:211–21. doi: 10.1096/fj.04-1970com. [DOI] [PubMed] [Google Scholar]
- 40.Ohkawa T, Naomoto Y, Takaoka M, et al. Localization of heparanase in esophageal cancer cells: respective roles in prognosis and differentiation. Lab Invest. 2004;84:1289–304. doi: 10.1038/labinvest.3700159. [DOI] [PubMed] [Google Scholar]
- 41.Takaoka M, Naomoto Y, Ohkawa T, et al. Heparanase expression correlates with invasion and poor prognosis in gastric cancers. Lab Invest. 2003;83:613–22. doi: 10.1097/01.lab.0000067482.84946.bd. [DOI] [PubMed] [Google Scholar]
- 42.Ford AC, Grandis JR. Targeting epidermal growth factor receptor in head and neck cancer. Head Neck. 2003;25:67–73. doi: 10.1002/hed.10224. [DOI] [PubMed] [Google Scholar]
- 43.Fischer OM, Hart S, Gschwind A, Prenzel N, Ullrich A. Oxidative and osmotic stress signaling in tumor cells is mediated by ADAM proteases and heparin-binding epidermal growth factor. Mol Cell Biol. 2004;24:5172–83. doi: 10.1128/MCB.24.12.5172-5183.2004. [DOI] [PMC free article] [PubMed] [Google Scholar]
- 44.Fischer OM, Hart S, Gschwind A, Ullrich A. EGFR signal transactivation in cancer cells. Biochemical Society Transactions. 2003;31:1203–8. doi: 10.1042/bst0311203. [DOI] [PubMed] [Google Scholar]
- 45.Gschwind A, Zwick E, Prenzel N, Leserer M, Ullrich A. Cell communication networks: epidermal growth factor receptor transactivation as the paradigm for interreceptor signal transmission. Oncogene. 2001;20:1594–600. doi: 10.1038/sj.onc.1204192. [DOI] [PubMed] [Google Scholar]
- 46.Ishizawar R, Parsons SJ. c-Src and cooperating partners in human cancer. Cancer Cell. 2004;6:209–14. doi: 10.1016/j.ccr.2004.09.001. [DOI] [PubMed] [Google Scholar]
- 47.Benhar M, Engelberg D, Levitzki A. Cisplatin-induced activation of the EGF receptor. Oncogene. 2002;21:8723–31. doi: 10.1038/sj.onc.1205980. [DOI] [PubMed] [Google Scholar]
- 48.Moro L, Dolce L, Cabodi S, et al. Integrin-induced epidermal growth factor (EGF) receptor activation requires c-Src and p130Cas and leads to phosphorylation of specific EGF receptor tyrosines. J Biol Chem. 2002;277:9405–14. doi: 10.1074/jbc.M109101200. [DOI] [PubMed] [Google Scholar]
- 49.Sturla LM, Amorino G, Alexander MS, Mikkelsen RB, Valerie K, Schmidt-Ullrichr RK. Requirement of Tyr-992 and Tyr-1173 in phosphorylation of the epidermal growth factor receptor by ionizing radiation and modulation by SHP2. J Biol Chem. 2005;280:14597–604. doi: 10.1074/jbc.M413287200. [DOI] [PubMed] [Google Scholar]
- 50.Carraway KL, 3rd, Sweeney C. EGF receptor activation by heterologous mechanisms. Cancer Cell. 2002;1:405–6. doi: 10.1016/s1535-6108(02)00076-4. [DOI] [PubMed] [Google Scholar]
Associated Data
This section collects any data citations, data availability statements, or supplementary materials included in this article.