

Abstract
Background: No evidence-based recommendations exist concerning what dietary macronutrient composition optimizes weight loss during lactation while maintaining milk production.
Objectives: The study was designed to test the following hypotheses: compared with a reduced-calorie, high-carbohydrate (H-CHO) diet, an isonitrogenous, isocaloric high-fat (H-F) diet will decrease milk production and carbohydrate oxidation, increase gluconeogenesis and hexoneogenesis, and not affect energy balance.
Design: Seven healthy lactating mothers and their infants were studied on 2 occasions in random order for 8 d separated by 1–2 wk. On one occasion, the subjects received the H-F (30% of energy as carbohydrate and 55% as fat) diet and on the other occasion received the H-CHO (60% of energy as carbohydrate and 25% as fat) diet. Milk production, infant intakes, and substrate and hormone concentrations were measured. Glucose rates of appearance, production, gluconeogenesis, glycogenolysis, and hexoneogenesis were measured by using stable-isotope gas chromatography–mass spectrometric techniques, and energy expenditure and substrate oxidation were measured by using indirect calorimetry.
Results: Milk volume, lactose, and protein concentrations were unaffected. Milk fat, energy, and infant intakes were higher (P < 0.05) during the H-F diet. Neither gluconeogenesis nor hexoneogenesis was different. During the H-F diet, energy expenditure and fat and protein oxidation rates were higher (P < 0.05), and the daily energy balance deficit was greater (P < 0.01).
Conclusions: Milk fat, energy output, and energy expenditure were higher during the H-F diet, which resulted in a greater negative energy balance. The lactating mothers adapted to a low carbohydrate intake by decreasing carbohydrate oxidation. Additional studies are warranted to determine whether a hypocaloric H-F diet might promote weight loss to a greater extent than the H-CHO diet while maintaining milk production.
INTRODUCTION
Obesity is an increasingly serious health concern. The evidence that excessive postpartum weight retention contributes to the development of obesity (1, 2) and obesity-related diseases underscores the need for guidelines for weight loss during lactation. The use of low-calorie and/ or low-carbohydrate diets to facilitate body weight loss during lactation could result in reduced milk production, elevated plasma lipids, prolonged ketosis, and diet-related deficiencies in micronutrients and fiber. However, no published studies have compared the effects of low-carbohydrate with high-carbohydrate diets on maternal health and/or milk volume and composition (3).
Numerous metabolic adaptations occur during lactation to support milk synthesis without jeopardizing maternal substrate homeostasis while optimizing the delivery of appropriate amounts of substrates for the suckling infant (4). We previously showed that, in the postabsorptive state, lactating women have a glucose production rate that is 35% higher than that of control women. This elevated glucose production resulted from a higher rate of glycogenolysis because the rates of gluconeogenesis were essentially identical between the lactating and control women (5). In addition, we showed that a significant portion of lactose is derived from de novo synthesis of glucose and galactose within the breast—a process that was termed hexoneogenesis (6). This might serve to compensate for dietary carbohydrate in maintaining lactose production.
In the present studies, we addressed the effect of the dietary macronutrient distribution in the context of a reduced calorie intake on metabolic events and milk production. We hypothesized that, when compared with a reduced-calorie high-carbohydrate (H-CHO) diet over an 8-d period, an isonitrogenous, isocaloric high-fat (H-F) diet will 1) decrease milk production; 2) decrease endogenous carbohydrate oxidation, increase glucose production via gluconeogenesis, and increase hexoneogenesis in the mammary gland; and 3) not affect the energy deficit (index of weight loss).
SUBJECTS AND METHODS
Subjects
After the protocol was approved by the Institutional Review Board and the Scientific Advisory Committee of the General Clinical Research Center (GCRC) at Baylor College of Medicine, written consent was obtained from 7 healthy females. The initial recruitment was initiated in October 2006. No attempt was made to select subjects on the basis of ethnicity, which resulted in 2 African American, 2 white, and 3 Hispanic women. The women [age: 29.3 ± 1.0 y; weight: 60.0 ± 1.0 kg; BMI (in kg/m2) 23.2 ± 0.5] and their infants (age: 10.0 ± 2.0 wk; weight: 5.4 ± 0.5 kg) had normal results from physical examinations and liver function tests and normal fasting blood glucose and hemoglobin concentrations. None of the women had a history of gestational diabetes or had a first-degree relative with diabetes. Other than routine postpartum vitamins and mineral supplements prescribed by their physician, none was taking any medications. All women studied had a negative pregnancy test at the time of study. To exclude any pregnancy or immediate postpartum-related changes, all lactating women were studied between 6 and 14 wk postpartum.
Protocol
Each woman was studied on 2 occasions for 8 d separated by 1–2 wk. On each study occasion, the subject was admitted to the GCRC for 4 d and 3 nights. The subjects were randomly assigned to receive either a low-carbohydrate, high-fat (H-F: 30% carbohydrate, 55% fat, and 15% protein) diet on one occasion and a high-carbohydrate, low-fat (H-CHO: 60% carbohydrate, 25% fat, and 15% protein) diet on the other occasion. The fructose content of both diets was approved at 20% of the total carbohydrate content (7).
Total energy intake for each woman was calculated as 1.3 times the basal metabolic rate (BMR). BMR was estimated by using the Harris Benedict equation:
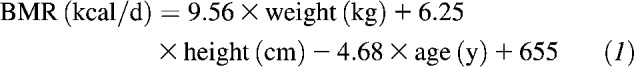 |
The 1.3 BMR value corresponds to a low activity level, which was the case for these breastfeeding mothers. We estimated that the deficit in calories would be equal to milk energy output, which was ≈500 kcal/d on average. Subjects were interviewed by the research dietitian, and food preferences were established from a list of common commercially available foods of known macronutrient composition. Diets were then created to achieve the designed macronutrient composition. For 4 d before admission, 3 meals and 3 snacks daily were weighed, prepacked, and sent to the subject's home by our research kitchen. An example of a 1-d menu of the H-F and H-CHO diets is presented elsewhere (see Supplemental Appendix 1 under “Supplemental data” in the online issue). The subjects were asked to report any additional foods consumed and were thoroughly instructed that they were to eat only the food provided. Nonconsumed food was returned to the kitchen and examined for constituents; the energy and macronutrient composition of the consumed food was calculated by subtracting the nonconsumed food from the total food delivered to the subject. Our research dietitian was in frequent telephone contact with the subjects to ensure compliance with the diet. If necessary, the amount and/or food items were adjusted during the first couple of days; although the macronutrient composition and intake were maintained. We made no independent assessment about whether any of the subjects consumed any additional food. The total energy intake and distribution of energy from carbohydrate, fat, and protein were analyzed by using the Minnesota Database System (NDS 2007; University of Minnesota, Minneapolis, MN) as previously described (7). Throughout the study period at home, the women were asked to feed their infants on demand. When the feeding was complete, they were instructed to use a breast pump to empty their breasts of residual milk and to become familiar with the pump.
After the 4-d diet period at home, the subjects were admitted at (≈1600) to the GCRC for 4 d and 3 nights. During the first 3 d, the subjects received the same intake and diet composition as that consumed at home. During the stay in the GCRC, the women breastfed their infants every 3 h and expressed 2.5 mL milk from each breast at the beginning, middle, and end of feeding (a total of 15 mL per feeding). Milk samples for each collection time were pooled for milk analyses. The infants were weighed before and after each breastfeeding to estimate the milk volume consumed (assuming the density of milk is 1.03 g/mL) (8). After breastfeeding, the mothers again were asked to empty their breasts completely using the breast pump. This extra milk was weighed. The milk volume produced during each feeding was calculated from the sum of what the baby fed and pumped milk. Over study days 2–3, a 24-h urine collection was performed for measurement of total urinary nitrogen.
On the evening of day 3, the subjects were served dinner at 1800 and a snack at 2000. Thereafter, except for water, the subjects fasted until 0900 the following morning (day 4). In the evening of study day 3, 2 intravenous catheters were placed after the application of ELAMAX cream analgesia (Astra Pharmaceuticals, Wayne, PA). One catheter was placed in an antecubital vein for isotope infusion and a second in a vein in the contralateral arm for blood sampling. At 0400 on study day 4, a primed constant infusion of [U-13C]glucose (61 ± 0.7 μmol/kg, 1.02 ± 0.01 μmol · kg−1 · min−1) was initiated to measure the glucose rate of appearance (Ra) and glucose production from gluconeogenesis. At 0300, a baseline blood sample (10 mL) was obtained. Subsequently, 5 mL blood was drawn at 0700 and every 15 min from 0800 to 0900.
From 0900 to 1600, the women consumed small meals every 15 min. The food had the same composition and provided the same calories as that consumed over the previous week. At the initiation of the feedings, a second priming dose of [U-13C]glucose (161 ± 4 μmol/kg) was given, and the infusion rate was increased to 2.7 ± 0.1 μmol · kg−1 · min−1 to maintain sufficient [U-13C]glucose enrichment to measure accurately the rate of gluconeogenesis. Blood was subsequently drawn at 1400 and every 15 min from 1500 to 1600. A baseline milk sample was obtained at 0300 followed by the collection of samples at 0900, 1200, and 1600 to determine the enrichment of [U-13C]glucose and [U-13C]galactose in milk lactose. Finally, indirect calorimetry was performed hourly between 0700 and 0900 and from 1400 to 1600 for the measurement of substrate oxidation rates.
Materials
β-Galactosidase (Escherichia coli, grade VIII, 740,000 U/g) was obtained from Sigma-Aldrich Corp (St Louis, MO). Barium hydroxide (0.3 N), zinc sulftae (0.3 N), D-(+)glucose (dextrose, corn sugar), D-(+)galactose, and D-lactose (monohydrate) were purchased from Sigma-Aldrich Corp. All organic solvents were HPLC grade. [U-13C] glucose (99 atom%) was purchased from Cambridge Isotope Laboratory (Andover, MA).
Substrate and hormone concentrations
Plasma glucose was measured by using an enzyme-specific method (YSI Glucose Analyzer; YSI, Yellow Springs, OH). Plasma insulin and C-peptide were measured by using commercially available enzyme-linked immunosorbent assay kits (Linco Research Inc, St Charles, MO). Plasma free fatty acids and β-hydroxybutyrate were measured by microfluorometric enzyme analyses as previously described (9). Enrichments of [U-13C]glucose and the glucose isotopomers in plasma and in glucose and galactose in milk lactose were performed by using the pentaacetate derivative and gas chromatography–mass spectrometry as previously described (6). All measurements were made in the Stable Isotope Core Laboratory of the Children's Nutrition Research Center.
Indirect calorimetry
Indirect calorimetry was determined by using a MedGraphic Model Indirect Calorimeter (MedGraphics Inc, Minneapolis, MN). Oxidation rates of protein, glucose, and lipids and resting energy expenditure were calculated by using the gaseous exchange equations according to Frayn (10).
Milk analysis
Lipid extraction was carried out according to standard techniques (11), and the total lipid content was quantified gravimetrically. The concentration of protein was measured by using a bicinchoninic acid protein assay kit (Novagen, Madison, WI) (12). Milk lactose was measured by using an enzyme-specific method (YSI Glucose Analyzer). All of the above analyses were performed in each individual milk sample (8 samples daily). To calculate the energy content of milk, the mass of each macronutrient was multiplied by a standard factor (9 kcal for 1 g fat and 4 kcal for both carbohydrate and proteins). The 24-h milk production or composition was calculated on the basis of the sum of each variable (volume, energy content, protein, fat, or lactose) measured in the 8 samples collected daily. Subsequently, these values were averaged over the 3 d of the inpatient study. In a similar fashion, the daily intake of the infants was determined on the basis of the milk volume consumed and the energy content of the milk.
Calculations
The Ra of glucose and the rate of gluconeogenesis were determined by using mass isotopomer distribution analysis during infusion of [U-13C]glucose under steady state conditions as previously described (13).
Briefly, the Ra (Ratotal) of glucose during infusion of [U-13C]glucose was obtained using standard isotope dilution equation:
 |
where Ei and Ep are the enrichments of [U-13C]glucose in the infusate and the plasma, respectively, and I is the rate of infusion of [U-13C]glucose.
In the fasting state, the glucose production rate (GPR) was calculated by subtracting the amount of infused [U-13C]glucose from the glucose Ra:
 |
Gluconeogenesis (GNG) as a fraction of glucose Ra was calculated as follows (13):
 |
is the dilution of tracer.
Rates of GNG and glycogenolysis were calculated by using the following equations:
 |
 |
During fasting, Rameal equals zero; during feeding, we estimated the rate of dietary carbohydrate entry into the systemic circulation to be 85% of orally ingested glucose based on previous findings in lactating mothers (5). The fraction of glucose and galactose (product pool) in milk lactose that was derived from plasma glucose (precursor pool) and the fraction derived from de novo synthesis were calculated as previously described (6).
Statistical analysis
All data are expressed as means ± SEMs. Paired Student's t test was used to compare the effect of the diets on the average volume and the macronutrient content of milk and infant intake over the 3 d of the study in the GCRC. Similarly, the effect of the diets on glucose Ra, GPR, gluconeogenesis, glycogenolysis, hexoneogenesis, substrate and hormone concentrations, energy expenditure, and substrate oxidation rates measured on day 4 during both fasting (from 0700 to 0900) and feeding (from 1400 to 1600) conditions were compared by using paired Student's t test. Significance was defined as P < 0.05. SPSS software (version 16; SPSS Inc, Chicago, IL) was used for all statistical analyses.
RESULTS
Energy intake
The daily energy intake and dietary macronutrient distributions are provided in (Table 1). The intakes of carbohydrate were 59% and 31% and of fat were 26% and 54% of total energy during the H-CHO and H-F diets, respectively.
TABLE 1.
Daily intake of macronutrients during the high-carbohydrate (H-CHO) and high-fat (H-F) diets1
| H-CHO | H-F | |
| EI (kcal/d) | 1782 ± 16 | 1787 ± 31 |
| Fat | ||
| (g/d) | 51 ± 1 | 107 ± 22 |
| (% of EI) | 26 ± 0 | 54 ± 02 |
| Carbohydrate | ||
| (g/d) | 265 ± 4 | 137 ± 22 |
| (% of EI) | 59 ± 1 | 31 ± 02 |
| Protein | ||
| (g/d) | 69 ± 2 | 69 ± 1 |
| (% of EI) | 16 ± 0 | 15 ± 0 |
All values are means ± SEMs; n = 7. EI, energy intake.
Significantly different from H-CHO, P < 0.01 (paired t test).
Milk production and infant intake
Overall, milk volume produced during both studies was 828 ± 24 mL/d, which was similar during the H-CHO and H-F diets: 829 ± 41 and 821 ± 33 mL/d, respectively (Table 2). There was no effect of the diet on either milk lactose or protein expressed as g/dL or g/d. However, the milk fat concentration (4.8 ± 0.3 and 4.3 ± 0.3 g/dL; P = 0.01) and the corresponding daily milk fat content (39 ± 2 and 34 ± 2 g/d; P = 0.02) were higher during the H-F diet. Accordingly, the energy output of milk was higher (P = 0.02) during the H-F diet (654 ± 24 kcal/d) than during the H-CHO diet (619 ± 23 kcal/d). The infants' milk intake expressed as mL/d did not differ significantly between the 2 diets. However, the infants' energy intake expressed as kcal/d (486 ± 24 compared with 452 ± 23) or as kcal · kg−1 · d−1 (87 ± 4 compared with 81 ± 3) was higher (P < 0.05) during the H-F diet. Infants' intake was affected by maternal intake in that, the fat intake, whether, expressed as a percentage of energy or as g/d was higher (P < 0.05) during the H-F diet. There was no difference in the infants' intakes of carbohydrate (lactose) or protein between the 2 diets.
TABLE 2.
Effect of the macronutrient composition of the high-carbohydrate (H-CHO) and high-fat (H-F) diets on milk production and infant consumption1
| Milk composition |
Infant intake |
|||
| H-CHO | H-F | H-CHO | H-F | |
| Milk volume (mL/d) | 829 ± 41 | 821 ± 33 | 611 ± 41 | 612 ± 41 |
| Energy content | ||||
| (kcal/d) | 619 ± 23 | 654 ± 242 | 452 ± 23 | 486 ± 242 |
| (kcal · kg−1 · d−1) | — | — | 81 ± 3 | 87 ± 42 |
| Lactose | ||||
| (g/dL) | 7.3 ± 0.2 | 7.3 ± 0.2 | — | — |
| (g/d) | 0 ± 3 | 60 ± 2 | 45 ± 3 | 44 ± 3 |
| (% of EI) | — | — | 40 ± 1 | 37 ± 2 |
| Protein | ||||
| (g/dL) | 1.8 ± 0.1 | 1.9 ± 0.1 | — | — |
| (g/d) | 15 ± 0.9 | 16 ± 0.8 | 11 ± 1 | 11 ± 0 |
| (% of EI) | — | — | 10 ± 1 | 10 ± 1 |
| Fat | ||||
| (g/dL) | 4.3 ± 0.3 | 4.8 ± 0.32 | — | — |
| (g/d) | 34 ± 2 | 39 ± 22 | 25 ± 1 | 29 ± 22 |
| (% of EI) | — | — | 50 ± 1 | 54 ± 12 |
All values are means ± SEMs; n = 7. EI, energy intake.
Significantly different from H-CHO, P < 0.05 (paired t test).
Plasma substrate and hormone concentrations
Plasma glucose concentrations were higher (P < 0.05) during both the fasted (4.7 ± 0.2 compared with 4.4 ± 0.2 mmol/L) and fed (5.9 ± 0.2 compared with 5.5 ± 0.2 mmol/L) states during the consumption of the H-CHO diet (Table 3). Similarly, insulin and C-peptide concentrations in both the fasted and fed states were higher (P < 0.05) during the H-CHO diet than during the H-F diet. The plasma lactate concentration was higher during the H-CHO diet during the fed state (1.1 ± 0 compared with 0.8 ± 0 mmol/L; P < 0.01). The triglyceride concentration during the fed state was higher (P < 0.05) during the H-F diet than during the H-CHO diet. β-Hydroxybutyrate concentrations (mmol/L) were higher (P < 0.05) during the H-F diet during both the fast and the fed states. Similarly, plasma free fatty acid concentrations were higher during the H-F diet during both the fasted (0.8 ± 0.1 compared with 0.6 ± 0.1 mmol/L; P < 0.05) and the fed (0.6 ± 0.1 compared with 0.2 ± 0.0 mmol/L; P < 0.01) states.
TABLE 3.
Effect of the macronutrient composition of the high-carbohydrate (H-CHO) and high-fat (H-F) diets on substrate and hormone concentrations during fasting and fed states1
| Fasting |
Fed |
|||
| H-CHO | H-F | H-CHO | H-F | |
| Glucose (mmol/L) | 4.7 ± 0.2 | 4.4 ± 0.22 | 5.9 ± 0.2 | 5.5 ± 0.22 |
| Insulin (μU/mL) | 4.2 ± 0.8 | 2.9 ± 0.72 | 23.1 ± 4.6 | 14.8 ± 3.82 |
| C-peptide (ng/mL) | 1.4 ± 0.2 | 1.0 ± 0.22 | 4.5 ± 0.5 | 3.1 ± 0.63 |
| Lactate (mmol/L) | 0.68 ± 0.1 | 0.64 ± 0.0 | 1.11 ± 0.0 | 0.77 ± 0.03 |
| Cholesterol (mg/dL) | 174 ± 10 | 183 ± 10 | 179 ± 9 | 170 ± 15 |
| HDL (mg/dL) | 67 ± 9 | 64 ± 8 | 71 ± 10 | 68 ± 8 |
| LDL (mg/dL) | 98 ± 10 | 109 ± 10 | 94 ± 11 | 100 ± 10 |
| Triglycerides (mg/dL) | 47 ± 7 | 50 ± 14 | 69 ± 16 | 90 ± 192 |
| β-Hydroxybutyrate (mmol/L) | 0.29 ± 0.11 | 0.80 ± 0.162 | 0.11 ± 0.04 | 0.25 ± 0.052 |
| FFAs (mmol/L) | 0.58 ± 0.12 | 0.79 ± 0.102 | 0.19 ± 0.03 | 0.62 ± 0.053 |
All values are means ± SEMs; n = 7. FFAs, free fatty acids.
Significantly different from H-CHO (paired t test): 2P < 0.05, 3P < 0.01.
Glucose kinetics
After an overnight fast, the glucose production rate (μmol · kg−1 · min−1) was higher during the H-CHO diet than during the H-F diet because of higher glycogenolysis (P < 0.05), whereas gluconeogenesis was unchanged (Figure 1). As a result of a higher dietary glucose intake during the H-CHO diet, the glucose Ra was higher during the H-CHO diet than during the H-F diet in the fed state (26.4 ± 1.2 compared with 18.0 ± 0.9 μmol · kg−1 · min−1; P < 0.01). Gluconeogenesis was not affected by either the H-CHO (with high insulin) or the H-F (low insulin) diet during the fasted or fed states.
FIGURE 1.

Effect of the macronutrient composition of the high-carbohydrate (H-CHO) and the high-fat (H-F) diets on glucose kinetic parameters during the fasting and fed states. The rate of glucose production (GPR) is the sum of gluconeogenesis and glycogenolysis. The total glucose rate of appearance is the sum of GPR and exogenous glucose. Results are presented as means ± SEMs for 7 subjects. *, **The statistical evaluation of the data was performed by using a paired Student's t test: *P < 0.05, **P < 0.01.
Source of lactose hexoses
Neither the fraction of milk galactose or glucose derived from plasma glucose nor that derived from hexoneogenesis was affected by maternal diet (Table 4).
TABLE 4.
Source of milk lactose from the high-carbohydrate (H-CHO) and high-fat (H-F) diets during the fasting and fed states1
| Fasting |
Fed |
|||
| H-CHO | H-F | H-CHO | H-F | |
| Milk glucose from plasma glucose (%) | 67 ± 5 | 64 ± 5 | 86 ± 6 | 88 ± 4 |
| Milk glucose from hexoneogenesis (%) | 33 ± 5 | 36 ± 5 | 14 ± 6 | 12 ± 4 |
| Milk galactose from plasma (%) | 48 ± 4 | 47 ± 4 | 68 ± 3 | 64 ± 4 |
| Milk galactose from hexoneogenesis (%) | 52 ± 4 | 53 ± 4 | 32 ± 3 | 36 ± 4 |
| Milk lactose from plasma (%) | 58 ± 4 | 55 ± 5 | 77 ± 4 | 76 ± 4 |
| Milk lactose from hexoneogenesis (%) | 42 ± 4 | 45 ± 5 | 23 ± 4 | 24 ± 4 |
All values are means ± SEMs; n = 7. None of the variables differed significantly between diets (paired t test).
Resting energy expenditure
Energy expenditure was higher (P < 0.01) during the H-F diet than during the H-CHO diet in the fasted (1241 ± 19 compared with 1162 ± 10 kcal/d) but not in the fed (1455 ± 22 compared with 1411 ± 14 kcal/d; NS) state (Table 5). Carbohydrate oxidation expressed as g/d or as a percentage of energy expenditure was higher (P < 0.01) during the H-CHO diet than during the H-F diet in both the fasted (35 ± 3 compared with 17 ± 4) and the fed (43 ± 4 compared with 12 ± 2) states. Fat oxidation expressed as g/d or as a percentage of energy expenditure was higher (P < 0.01) during the H-F diet than during the H-CHO diet in both the fasted (66 ± 5 compared with 50 ± 3) and the fed (73 ± 3 compared with 44 ± 4) states. Similarly, protein oxidation expressed as g/d or as a percentage of energy expenditure was higher (P < 0.05) during the H-F diet than during the H-CHO diet in both the fasted (17 ± 1 compared with 15 ± 1) and the fed (15 ± 1 compared with 13 ± 1) states.
TABLE 5.
Effect of the macronutrient composition of the high-carbohydrate (H-CHO) and high-fat (H-F) diets on substrate oxidation rate during the fasting and fed states1
| Fasting |
Fed |
|||
| H-CHO | H-F | H-CHO | H-F | |
| NPRQ | 0.82 ± 0.0 | 0.77 ± 0.02 | 0.84 ± 0.0 | 0.76 ± 0.02 |
| EE (kcal/d) | 1162 ± 10 | 1241 ± 192 | 1411 ± 14 | 1455 ± 22 |
| Fat | ||||
| (g/d) | 64 ± 5 | 91 ± 62 | 68 ± 7 | 117 ± 62 |
| (% of EE) | 50 ± 4 | 66 ± 52 | 44 ± 4 | 73 ± 32 |
| Carbohydrate | ||||
| (g/d) | 102 ± 9 | 50 ± 142 | 147 ± 13 | 45 ± 82 |
| (% of EE) | 35 ± 3 | 16.5 ± 42 | 43 ± 4 | 12 ± 22 |
| Protein | ||||
| (g/d) | 43 ± 2 | 54 ± 32 | 43 ± 2 | 54 ± 32 |
| (% of EE) | 15 ± 1 | 17 ± 13 | 13 ± 1 | 15 ± 12 |
All values are means ± SEMs; n = 7. NPRQ, nonprotein respiratory quotient; EE, energy expenditure.
Significantly different from H-CHO (paired t test): 2P < 0.01, 3P < 0.05.
Energy balance
The estimated average energy expenditure (assuming 14 h of feeding and 10 h of fasting daily) was higher (P < 0.03) during the H-F diet (1368 ± 15 kcal/d) than during the H-CHO diet (1283 ± 24 kcal/d). The sum of energy expenditure plus milk energy output was higher (P < 0.01) during the H-F diet (2022 ± 35 kcal/d) than during the H-CHO diet (1910 ± 40 kcal/d). Thus, the deficit in energy balance [intake – (energy expenditure + milk output)] was greater (P < 0.01) during the H-F diet (−235 ± 39 kcal/d) than during the H-CHO diet (−119 ± 48 kcal/d) (Figure 2).
FIGURE 2.

Effect of the macronutrient composition of the high-carbohydrate (H-CHO) and the high-fat (H-F) diets on daily energy expenditure (EE), EE plus milk energy output, maternal calorie intake, and daily energy balance. Results are presented as means ± SEMs for 7 subjects. *, **The statistical evaluation of the data was performed by using a paired Student's t test: *P < 0.05, **P < 0.01.
DISCUSSION
The present study showed that the macronutrient composition under isonitrogenous, isocaloric conditions of the maternal diet had no short-term effect on milk volume or its aqueous components (ie, protein and lactose). However, we showed that the H-F diet increased the milk fat concentration and content by ≈13% and 15%, respectively, when compared with the H-CHO diet. This resulted in an increase in the calorie content (kcal/d) of the milk. In addition, this increase in milk fat led to increased fat and calorie intakes by the infant whether expressed as kcal/d or as kcal · kg−1 · d−1. Our findings agree with those of Park et al (14), who reported that women who consumed a diet low in dairy fat had lower milk fat than when they consumed more dairy fat.
In addition we observed that, under moderate calorie restriction (1785 ± 22 kcal/d), overall milk production (828 ± 24 mL/d) and milk energy output (623 ± 15 kcal/d) were comparable with published values for well-nourished lactating women (15–19). Studies in lactating women from the United States (15–17, 20, 21) and Sweden (19) concluded that women can successfully breastfeed their infants if they have been provided calorie intakes of 1800–2200 kcal/d. Collectively, these observations indicate that the intakes recommended by the Institute of Medicine (during the first 6 mo = estimated energy requirement + 330 kcal/d; during the second 6 mo = estimated energy requirement + 400 kcal/d) for lactating women (22) may be in significant excess of their true needs, and, should women accurately follow these recommendations, it might hinder their ability to lose weight in the postpartum period.
Both glucose concentrations and glucose production rates were higher with the H-CHO diet after an overnight fast than with the H-F diet as a result of increased glycogenolysis, because gluconeogenesis was unaffected by dietary macronutrient composition. The insulin and C-peptide concentrations were most likely higher as a result of the higher plasma glucose concentrations when compared with the H-F diet. It is not surprising that, after meal ingestion, the glucose, insulin, and C-peptide concentrations were higher with the H-CHO diet because of the larger glucose load.
We previously showed that the human mammary epithelium is capable of de novo synthesis of lactose by a process we termed “hexoneogenesis” (6). Thus, a potential compensatory mechanism for maintaining lactose production under the conditions of a hypocaloric, low-carbohydrate diet could be by increasing hexoneogenesis. Our data, however, show that the macronutrient composition of the mother's diet had no effect on this process. Collectively, our findings indicate that, during an H-F diet, the lactating mother does not increase glucose production via gluconeogenesis or glycogenolysis nor does she increase mammary gland production of lactose via hexoneogenesis. Thus, an alternative mechanism for adaptation to a hypocaloric H-F diet would be to decrease the rate of carbohydrate oxidation. This is precisely what was observed. Lactating mothers who consumed the H-F low-calorie diet decreased carbohydrate oxidation and increased fat oxidation. In keeping with this, both plasma free fatty acids and β-hydroxybutyrate concentrations were higher under both the fasted and fed conditions with the H-F diet. It is of interest to note that, during consumption of the H-F diet, the absolute amount as well as the percentage of energy expenditure derived from carbohydrate oxidation was unaffected by feeding. One might speculate that the dietary carbohydrate may have been preferentially directed to milk production in the mammary gland.
We found that energy expenditure was higher during the H-F diet than during the H-CHO diet during fasting but not during feeding. This finding agrees with the findings of Cooling and Blundell (23), who reported a significantly higher BMR in lean men who consumed a high-fat diet (BMR = 1624 kcal/d) than in lean men who consumed a low-fat diet (BMR = 1455 kcal/d).
The estimated average daily energy expenditure was higher during the H-F diet than during the H-CHO diet. When increased milk energy output is added to the maternal energy expenditure, the deficit in energy balance was almost double during consumption of the H-F diet when compared with the H-CHO diet. This suggests that lactating mothers might lose more weight while consuming an H-F diet than a H-CHO diet. This speculation is consistent with the finding reported by Brehm et al (24) in healthy, nonlactating, obese females. In that study (24), the group that consumed the low-carbohydrate diet lost more weight (8.5 ± 1.0 compared with 3.9 ± 1.0 kg; P < 0.001) and more body fat (4.8 ± 0.7 compared with 2.0 ± 0.8 kg; P < 0.01) than did the group that consumed the low fat (H-CHO) diet over the 6-mo period of study. Recently, these authors found similar results in a second group of subjects (25). In contrast, despite the finding that the low-carbohydrate diet produced a greater weight loss (absolute difference: ≈4%) than did the H-CHO diet for the first 6 mo, the differences were not significant at 1 y (26).
In this short-term dietary intake study (8 d), no difference in cholesterol, LDL, or HDL was observed between the 2 diets after an overnight fast or during feeding. Only plasma triglycerides were higher during feeding (90 compared with 60 mg/dL) in response to the H-F diet (normal range in our pathology laboratory: 20–150 mg/dL) but not after an overnight fast (50 compared with 47 mg/dL). Triglycerides could be used as an energy source and/or as a substrate for milk fat synthesis. The fact that triglycerides return to fasting concentrations after an overnight fast is reassuring. With regard to infants' intake, the H-F diet induced a higher milk fat content (13%), a higher energy intake (7%), and a higher percentage of energy from fat (8%) than did the H-CHO diet. Despite these changes, it is our contention that infants adapt readily to these modest changes in macronutrient intake. However, neither of these issues can be addressed in the present study and will require a long-term investigation.
In conclusion, under moderate calorie restriction, milk production was not affected by maternal diet composition. Milk fat, energy content, and infant energy intake were higher during the H-F diet, which resulted in a greater negative energy balance. The lactating mothers adapted to the increased demand of glucose and low carbohydrate intakes via decreased glucose oxidation but not via increased glucose production. Additional studies are warranted to determine whether a modest hypocaloric H-F diet might promote greater weight loss during lactation than would an H-CHO diet while maintaining sufficient milk production.
Supplementary Material
Acknowledgments
We thank the volunteers whose participation made this study possible. We gratefully acknowledge and thank the technicians in our laboratory (Susan Sharma, Marcia Ekworomadu, Shaji Chacko, and Dan Donaldson), our research coordinators (Amy Pontius, Cindy Bryant, and Linda Pleasant), the staff in the Metabolic Research Unit and kitchen, and the General Clinical Research Center for greatly facilitating the execution of these studies.
The authors' responsibilities were as follows—MAM: contributed to the study design, oversaw the studies, performed the biochemical and statistical analyses, and drafted the manuscript; ALS: contributed to the study design, revised the biochemical and statistical data analyses, and critically revised the manuscript; and MWH: designed and funded the study, oversaw the data quality and data analysis, and critically revised the manuscript. All of the authors contributed intellectually, interpreted the results, wrote the manuscript, and accepted the final version. None of the authors had a personal or financial conflict of interest.
REFERENCES
- 1.Williamson DF, Madans J, Pamuk E, Flegal KM, Kendrick JS, Serdula MK. A prospective study of childbearing and 10-year weight gain in US white women 25 to 45 years of age. Int J Obes Relat Metab Disord 1994;18:561–9. [PubMed] [Google Scholar]
- 2.Wolfe WS, Sobal J, Olson CM, Frongillo EA., Jr Parity-associated body weight: modification by sociodemographic and behavioral factors. Obes Res 1997;5:131–41. [DOI] [PubMed] [Google Scholar]
- 3.Heinig MJ, Doberne K. Weighing the risks: the use of low-carbohydrate diets during lactation. J Hum Lact 2004;20:283–5. [DOI] [PubMed] [Google Scholar]
- 4.Bauman DE, Currie WB. Partitioning of nutrients during pregnancy and lactation: a review of mechanisms involving homeostasis and homeorhesis. J Dairy Sci 1980;63:1514–29. [DOI] [PubMed] [Google Scholar]
- 5.Tigas S, Sunehag A, Haymond MW. Metabolic adaptation to feeding and fasting during lactation in humans. J Clin Endocrinol Metab 2002;87:302–7. [DOI] [PubMed] [Google Scholar]
- 6.Sunehag AL, Louie K, Bier JL, Tigas S, Haymond MW. Hexoneogenesis in the human breast during lactation. J Clin Endocrinol Metab 2002;87:297–301. [DOI] [PubMed] [Google Scholar]
- 7.Sunehag AL, Toffolo G, Campioni M, Bier DM, Haymond MW. Effects of dietary macronutrient intake on insulin sensitivity and secretion and glucose and lipid metabolism in healthy, obese adolescents. J Clin Endocrinol Metab 2005;90:4496–502. [DOI] [PubMed] [Google Scholar]
- 8.Kent JC, Mitoulas LR, Cregan MD, Ramsay DT, Doherty DA, Hartmann PE. Volume and frequency of breastfeedings and fat content of breast milk throughout the day. Pediatrics 2006;117:e387–95. [DOI] [PubMed] [Google Scholar]
- 9.Miles J, Glasscock R, Aikens J, Gerich J, Haymond M. A microfluorometric method for the determination of free fatty acids in plasma. J Lipid Res 1983;24:96–9. [PubMed] [Google Scholar]
- 10.Frayn KN. Calculation of substrate oxidation rates in vivo from gaseous exchange. J Appl Physiol 1983;55:628–34. [DOI] [PubMed] [Google Scholar]
- 11.Folch J, Lees M, Sloane Stanley GH. A simple method for the isolation and purification of total lipides from animal tissues. J Biol Chem 1957;226:497–509. [PubMed] [Google Scholar]
- 12.Keller RP, Neville MC. Determination of total protein in human milk: comparison of methods. Clin Chem 1986;32:120–3. [PubMed] [Google Scholar]
- 13.Haymond MW, Sunehag AL. The reciprocal pool model for the measurement of gluconeogenesis by use of [U-(13)C]glucose. Am J Physiol Endocrinol Metab 2000;278:E140–5. [DOI] [PubMed] [Google Scholar]
- 14.Park Y, McGuire MK, Behr R, McGuire MA, Evans MA, Shultz TD. High-fat dairy product consumption increases delta 9c,11t-18:2 (rumenic acid) and total lipid concentrations of human milk. Lipids 1999;34:543–9. [DOI] [PubMed] [Google Scholar]
- 15.Butte NF, Garza C, Stuff JE, Smith EO, Nichols BL. Effect of maternal diet and body composition on lactational performance. Am J Clin Nutr 1984;39:296–306. [DOI] [PubMed] [Google Scholar]
- 16.Dusdieker LB, Hemingway DL, Stumbo PJ. Is milk production impaired by dieting during lactation? Am J Clin Nutr 1994;59:833–40. [DOI] [PubMed] [Google Scholar]
- 17.McCrory MA, Nommsen-Rivers LA, Mole PA, Lonnerdal B, Dewey KG. Randomized trial of the short-term effects of dieting compared with dieting plus aerobic exercise on lactation performance. Am J Clin Nutr 1999;69:959–67. [DOI] [PubMed] [Google Scholar]
- 18.Mepham T. Biosynthesis of milk. : Mepham TB, Physiology of lactation. Philadelphia, PA: Open University Press, 1987:71–93. [Google Scholar]
- 19.Sadurskis A, Kabir N, Wager J, Forsum E. Energy metabolism, body composition, and milk production in healthy Swedish women during lactation. Am J Clin Nutr 1988;48:44–9. [DOI] [PubMed] [Google Scholar]
- 20.Brewer MM, Bates MR, Vannoy LP. Postpartum changes in maternal weight and body fat depots in lactating vs nonlactating women. Am J Clin Nutr 1989;49:259–65. [DOI] [PubMed] [Google Scholar]
- 21.Lovelady CA, Garner KE, Moreno KL, Williams JP. The effect of weight loss in overweight, lactating women on the growth of their infants. N Engl J Med 2000;342:449–53. [DOI] [PubMed] [Google Scholar]
- 22.Panel on Macronutrients, Subcommittees on Upper Reference Levels of Nutrients and Interpretation and Uses of Dietary Reference Intakes, and the Standing Committee on the Scientific Evaluation of Dietary Reference Intakes, Food and Nutrition Board, Institute of Medicine. Dietary reference intakes for energy, carbohydrate, fiber, fat, fatty acids, cholesterol, protein, and amino acids. Washington, DC: National Academies Press, 2005. [Google Scholar]
- 23.Cooling J, Blundell J. Differences in energy expenditure and substrate oxidation between habitual high fat and low fat consumers (phenotypes). Int J Obes Relat Metab Disord 1998;22:612–8. [DOI] [PubMed] [Google Scholar]
- 24.Brehm BJ, Seeley RJ, Daniels SR, D'Alessio DA. A randomized trial comparing a very low carbohydrate diet and a calorie-restricted low fat diet on body weight and cardiovascular risk factors in healthy women. J Clin Endocrinol Metab 2003;88:1617–23. [DOI] [PubMed] [Google Scholar]
- 25.Brehm BJ, Spang SE, Lattin BL, Seeley RJ, Daniels SR, D'Alessio DA. The role of energy expenditure in the differential weight loss in obese women on low-fat and low-carbohydrate diets. J Clin Endocrinol Metab 2005;90:1475–82. [DOI] [PubMed] [Google Scholar]
- 26.Foster GD, Wyatt HR, Hill JO, et al. A randomized trial of a low-carbohydrate diet for obesity. N Engl J Med 2003;348:2082–90. [DOI] [PubMed] [Google Scholar]
Associated Data
This section collects any data citations, data availability statements, or supplementary materials included in this article.