Abstract
Objectives
LAT-1 (L-type amino acid transporter 1) is a system L, Na+-independent amino acid transporter responsible for transport of large neutral amino acids. Dysregulated expression of LAT-1 is characteristic of many primary human cancers and is related to tumor invasion. Primary rat hepatocytes in culture increase LAT-1 mRNA in response to amino acid depletion. Transformed hepatic cell lines demonstrate constitutive expression of LAT-1. These observations suggest that LAT-1 expression confers a growth and survival advantage under limited amino acid availability. LAT-1 is highly expressed in the placenta. It has been shown previously that amino acids are fundamental regulators of cell function and energy metabolism in pre-implantation embryos. Our objectives were to analyze qualitatively and quantitatively LAT-1 expression in pre-implantation stages of mouse embryo development and to identify cell types expressing LAT-1 in post implantation stages.
Methods
LAT-1 was quantified by real-time qPCR. Localization of expression was by laser capture microdissection, in situ hybridization and immunohistochemistry.
Results
Our results show increasing mRNA levels of LAT-1 as the embryo develops from zygote to blastocyst with highest levels at hatching blastocyst. Expression studies of LAT-1 on microdissected samples from developing mouse placenta show highest levels of LAT-1 mRNA in trophoblast giant cells (TGC’s) at the time of implantation (E7.5), followed by maternal decidua, ectoplacental cone and epiblast. At later stages of development (E9.5 and E11.5) no differential expression of LAT-1 was observed. In situ hybridization and immunohistochemistry also showed differential expression of LAT-1 mRNA and protein, respectively, with darkest staining in TGC’s at E7.5. By E9.5 and E11.5 mRNA expression was no longer preferentially localized to TGC’s, hybridization was equal across the different cell types and regions. LAT-1 protein expression, however, still showed highest intensity of staining in TGC’s at E9.5 and E11.5.
Conclusions
Since trophoblast giant cells are invasive cells that displace and phagocytose the uterine epithelial cells, these data suggest that LAT-1 may play a role in the invasive phenotype. The mechanism of LAT-1 regulation during placentation, therefore, might provide valuable clues to its role in tumor progression and invasion.
INTRODUCTION
Amino acid transport across plasma membranes is mediated by transporter proteins. Amino acid transporter systems are characterized according to functional criteria such as substrate specificity and sodium dependence [1]. Over a dozen of these transporter systems have been identified in the placenta [1,2]. LAT-1 (L-type amino acid transporter 1) is a Na+-independent amino acid transporter and belongs to the amino acid transport system L. System L is a major nutrient transport system responsible for the transport of large neutral amino acids including several essential amino acids [3–5]. For plasma membrane transport, LAT-1 must heterodimerize with the heavy chain of the cell surface antigen 4F2 [5,6]. 4F2 was originally identified as an activation antigen of lymphocytes and forms a heterodimer consisting of the type II membrane glycosylated protein of around 80 kDa heavy chain, 4F2hc, and a non-glycosylated lighter chain proteins of around 40 kDa linked by a disulfide-bond [7,8]. It has been shown that LAT-1 corresponds to a 4F2 light chain (4F2lc) [5, 9–10].
LAT-1 is identical to TA1, tumor associated gene 1 [10]. TA1 was identified by expression screening with a monoclonal antibody [11]. Whereas 4F2hc is widely expressed [5], LAT-1 expression is highly tissue specific. It is expressed in restricted sites such as brain, fetal liver, bone marrow, spleen, testis, ovary and placenta [3, 5–6]. Investigations have shown that LAT-1 may play an important role in carcinogenesis. Over expression of LAT-1 is characteristic of many primary human cancers and may be related to tumor progression [12–14]. Studies of rat primary hepatocyte cultures demonstrated that LAT-1 RNA levels were increased in response to amino acid depletion. Upregulation of LAT-1 following amino acid restriction is associated with enhanced protein synthesis, shortened cell cycle progression and enhanced proliferation, suggesting adaptive nutrient regulation [15–16]. In contrast, LAT-1 expression in transformed hepatic cell lines is not similarly responsive to media amino acid concentrations. In transformed cells LAT-1 is constitutively expressed[15–16]. These observations indicate that LAT-1 expression may confer a growth and survival advantage under the limited amino acid availability that accompanies rapid tumor growth.
During early embryonic development amino acids are fundamental regulators of cell function. In culture medium, amino acids stimulate the attachment and invasion of mouse blastocysts [17]. It has also been shown that active transport of amino acids is required for successful implantation and placentation. The external presence of amino acids however is not sufficient [18]. The placenta is a highly proliferative, highly invasive tissue and its growth is highly regulated. As such, studies of the mechanism(s) regulating placental invasion have been suggested as a model for tumor invasion [19]. We hypothesize that LAT-1 plays an important role in embryo implantation and placentation. In this study our objectives were to analyze qualitatively and quantitatively LAT-1 expression in pre- and post-implantation stages of mouse embryos and to identify the cell types expressing LAT-1 during placental development.
METHODS
Embryo collection
Outbred CD-1 female mice (Charles River Laboratory) 5–7 weeks old were induced to superovulate by standard hormonal treatments using an I.P. injection of 7.5 IU of pregnant mare serum gonadotropin (PMSG) followed 48 hr later by an I.P. injection of 7.5 IU of human chorionic gonadotropin (hCG). After overnight mating with males of the same strain, females were inspected for vaginal plugs the next day. This was defined as day 0.5. Thereafter, either oviducts or uterine horns were removed at the stages of development indicated below and in the Results. Embryos were recovered by flushing the oviducts and uterine horns with modified HTF medium with 0.4% bovine serum albumin (BSA). Preimplantation embryos (zygote, 2-cell, 4-cell, morula, blastocyst and hatching blastocyst) were collected at the proper time of development. Likewise, embryos at E7.5, E9.5 and E11.5 of gestation were obtained by time-dated, natural mating of CD-1 animals. On the appropriate day following the detection of a vaginal plug, uteri with implantation sites were removed. The uterus was cut between each implantation site and embryos were either snap frozen in liquid nitrogen for LCM or fixed and dehydrated with graded sucrose solutions for imunohistochemistry and in situ hybridization. All tissues were stored at −80°C.
Cryostat Sectioning
Embryos were embedded in OCT medium (Tissue Tek) using peel-a-way disposable embedding molds (Thermo Electron Corporation). Ten-micron sections were prepared in the cryotome (Thermo Electron Corporation). For immunohistochemistry and in-situ hybridization 10 μm sections were mounted on Colorfrost™ plus slides and for LCM 10 μm sections were mounted on Colorfrost™ uncharged slides and stored at −80°C.
Laser Capture Microdissection (LCM)
Isolation of cells by LCM was performed with minor modifications of the manufacturer’s instructions (Arcturus™, Mountain View, CA). The frozen embryo sections were thawed at room temperature, fixed in 70% ethanol and stained with an abbreviated hematoxylin and eosin staining protocol for LCM. Slides were cleared with xylene for 5 min and then air-dried and stored in a desiccator. LCM was performed the same day under a microscope attached to a Pixcell II™ laser capture microscope using the following settings: excitation wavelength, 495 nm ; laser power, 35–45 milliwatts; duration, 2.5 ms, and laser spot size, 15 μm. Each CapSure™ HS LCM cap was used to capture about 100 cells (100 laser shots) from indicated regions of the embryo or placenta. Caps were placed into tubes containing 100 μL of denaturing buffer and stored at −80°C.
RNA Extraction and Reverse Transcription
For pre-implantation embryos and LCM samples, RNA was isolated using the Micro RNA Isolation Kit (Stratagene, La Jolla, CA) that uses guanidinium isothiocyanate to lyse cells and inactivate nucleases. This method was carried out according to the manufacturer’s instructions. In pre-implantation samples used for quantitative Real-Time PCR analysis, 0.5 pg/embryo of exogenous Luciferase Control RNA (Promega Corporation, Madison, WI, USA) was added to each pool of embryos prior to RNA extraction.
First-strand complementary DNA (cDNA) synthesis was performed using random hexamers and the SuperScript™ First-Strand Synthesis System for RT-PCR (Invitrogen, Carlsbad, CA) according to the manufacturer’s instructions.
PCR
Pre-implantation stages of mouse development (oocyte, zygote, 2-cell, 4-cell, 8-cell, morula, blastocyst and hatching blastocyst) and post-implantation LCM samples of various regions of the developing embryo (EPC, GC’s, labyrinthine zone, spongiotrophoblast, decidua, and epiblast) were amplified with real-time PCR TaqMan gene expression assays on demand (LAT-1 Assay Cat.# Mm00441516_m1 and GAPDH Cat. # 4352339E-0506006). For pre-implantation embryos, data was normalized to exogenous Luciferase control (ABI TaqMan Left Primer # 185628791-1, Right Primer # 185628791-2, Vic Probe # 185632673-1) and, for post-implantation LCM samples, data was normalized to endogenous GAPDH. The Delta Delta CT method was used for quantitation of mRNA.
Conventional PCR for amplification of LAT-1 was carried out with the following primers:Forward 5′-GGGCACTACCATCTCAAAGTCAGG-3′; Reverse 5′-TTCGTCAGCACATAGACCAGGGTG-3′ (573 bp product with annealing temp=60°C).
Tissue Preparation and in situ hybridization
Implantation sites (E7.5, E9.5, and E11.5) were dissected in phosphate buffered saline (PBS) and fixed overnight in 4% paraformaldehyde (PFA) in PBS at 4°C. Tissues were rinsed three times with PBS (5 min) before going through graded sucrose solutions (10% and 25% in PBS) overnight. Tissues were then embedded in the OCT (Tissue Tek) and stored at −80°C. Ten micron sections were cut on a cryostat (Thermo Electron Corporation), mounted on Super Frost Plus slides and stored at −80°C. In situ hybridization was carried out with two methods. For Pl-1 (Placental Lactogen 1), Plf (Proliferin) and Tpbpα (Trophoblast specific protein alpha) probes, sections were re-hydrated in PBS, post-fixed in 4% PFA for 10 min, treated with proteinase K (15 μg/mL) for 10 min at room temperature, acetylated for 10 min (acetic anhydride, 0.25%) and hybridized with digoxigenin-labeled probes overnight at 65°C. Digoxigenin labeling was done according to the manufacturers instructions (Roche). Hybridization buffer contained 1× salts (200 mM sodium chloride, 13 mM tris, 5 mM sodium phosphate monobasic, 5 mM sodium phosphate dibasic, 5 mM EDTA), 50% formamide, 10% dextran sulfate, 1 mg/ml yeast tRNA (Roche), 1× Denhardt’s (1% w/v bovine serum albumin, 1% w/v Ficoll, 1% w/v polyvinylpyrrolidone), and DIG-labeled probe (final dilution of 1:2000 from reaction with 1 μg template DNA). Two 65 °C post-hybridization washes were carried out (1× SSC, 50% formamide, 0.1% tween-20) followed by two RT washes in 1×MABT (150 mM sodium chloride, 100 mM maleic acid, 0.1% tween-20, pH 7.5), and 30 min RNAse treatment (400 mM sodium chloride, 10 mM tris pH7.5, 5 mM EDTA, 20 μg/ml RNAse A). Sections were blocked in 1×MABT, 2% blocking reagent (Roche), 20% heat inactivated goat serum for 1 h, and incubated overnight in block with anti-DIG antibody (Roche) at a 1:2500 dilution. After four 20 min washes in 1× MABT, slides were rinsed in 1× NTMT (100 mM NaCl, 50 mM MgCl, 100 mM tris pH 9.5, 0.1% tween-20) and incubated in NBT/BCIP in NTMT according to the manufacturer’s instructions (Roche). Slides were counterstained with nuclear fast red, dehydrated and cleared in xylene, and mounted in cytoseal mounting medium. For LAT-1 and PolydT probes, sections were re-hydrated in PBS, post-fixed in 4% PFA for 10 min and hybridized to GeneDetect GreenStar*Digoxigenin (DIG)-hyperlabeled oligonucleotide probe according to the manufacturer’s protocol (GeneDetect.com/Laboratory Methods). Slides were counterstained with nuclear fast red, dehydrated, cleared in xylene, and mounted in cytoseal mounting medium. All sections were viewed and photographed using an up-right microscope (Nikon Eclipse 80i).
Immunocytochemistry
Ten micron sections of E7.5, E9.5, and E11.5 mouse embryos were washed 3X with PBS (5 min each wash) and blocked for one hour in room temperatures with 5% goat serum, 1% BSA in PBS. Sections were incubated with 1° LAT-1 polyclonal rabbit antibody (Capralogics, Inc Cat # P00801) overnight at 4°C in the humidified chamber. They were then washed 3X with PBS (5 min each wash) and once in 1% BSA in PBS (5 min), incubated with biotinylated secondary antibody for 1 hour, washed 3X in PBS (5 min each wash), incubated in ABC solution (Vectastain Elite ABC Kit, Vector Laboratories, CA) for 30 min and washed 3 X in PBS (5 min each wash). The sections were then developed color in 0.05% diaminobenzidine (DAB) in PBS for 2 min. The peroxidase reaction was stopped by rinsing the slides in running tap water. The slides were dehydrated, cleared in xylene, and mounted in Cytoseal™ mounting medium. Sections were viewed and photographed on a Nikon Eclipse 80i microscope.
Statistical Analysis
All results are presented as the mean ± S.E. Data represent results from at least three independent experiments. Statistical significance was evaluated using a one-way ANOVA and/or t-test where appropriate. Differences were considered significant when p≤0.05.
RESULTS
LAT-1 expression in pre-implantation stages of mouse embryo development
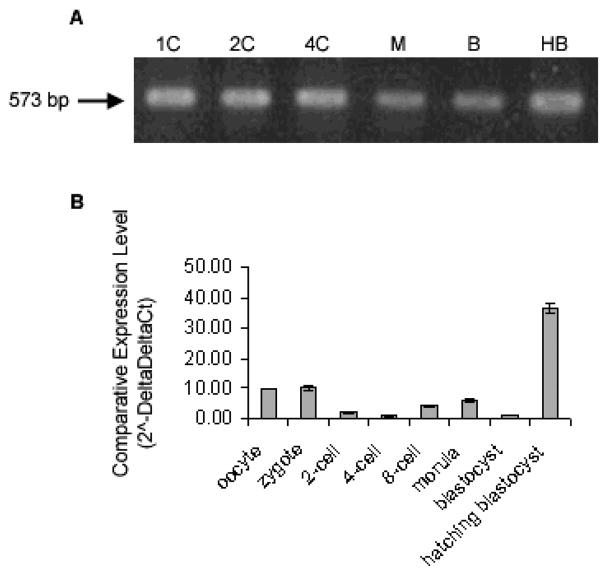
Conventional PCR was used to confirm LAT-1 expression in preimplantation samples. The stages tested included zygote, 2 cell, 4 cell, morula, blastocyst, and hatching blastocyst (Fig. 1A). LAT-1 mRNA was detected in all stages of pre-implantation mouse embryos tested. Quantitative analysis of LAT-1 mRNA expression in pre-implantation stages of mouse embryo was carried out using real time PCR. Data were normalized to exogenous Luciferase control and reported using the Delta Delta Ct method (Fig. 1B). The results show LAT-1 mRNA at all stages of embryo as it developed from zygote to day 5 blastocyst with highest expression at the hatching blastocyst stage.
Fig 1. Detection of mRNA Transcripts encoding LAT1 during Mouse Preimplantation Development.
RT-PCR product encoding LAT1 was detected in cDNA from one (I) embryo equivalent at timed stages of development 1C, 1-cell; 2C, 2-cell; 4C, 4-cell; 8C, 8-cell; M, morula; B, blastocyst; HB, hatching blastocyst (A). Representative image of three independent replicates. Quantitative analysis of LAT1 are shown in (B). mRNA transcript levels in a developmental series of mouse preimplantation embryos by Real-Time RT-PCR. Data were normalized to external Luciferase control (0.5pg/embryo) and relative to 4-cell target gene mRNA levels. Relative mRNA levels are presented as the mean ± s.e, representative of three independent replicates. Bars with different letters represent significant differences in relative mRNA levels between embryo stages (p≤0.05).
LAT-1 expression in post-implantation stages of mouse embryo development Laser capture microdissection and Real Time PCR analysis
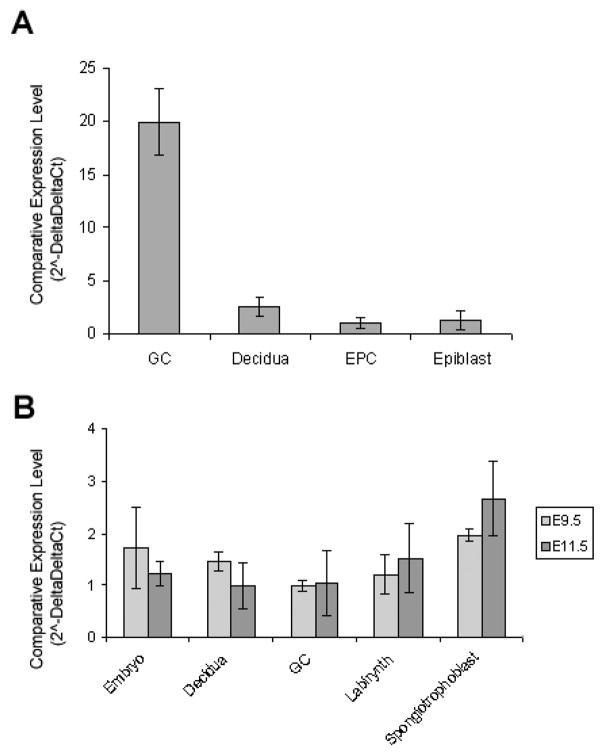
Three post- implantation developmental stages were selected for evaluation of cell specific LAT-1 expression using laser capture, E7.5, E9.5 and E11.5. At embryonic day 7.5 four cell types were microdissected: ectoplacental cone (EPC), epiblast (E), trophoblast giant cells (TGC’s) and maternal decidua (D). All gene expression results were normalized to the house keeping gene GAPDH. Quantitative analysis of mRNA expression in these captured regions showed the highest expression of LAT-1 in trophoblast giant cells, followed by maternal decidua, ectoplacental cone and epiblast (Fig. 2A). At embryonic day 9.5 and 11.5 regions were microdissected as follows: labyrinthine zone (L), spongiotrophoblast (S), trophoblast giant cells (TGC’s), epiblast (E) and maternal decidua (D). Quantitative analysis of LAT-1 mRNA levels showed expression in each of these regions. By those stages of development there was no difference among cells or regions analyzed (Fig. 2B).
Fig. 2. Detection of mRNA Transcripts Encoding LAT1 at Early Stages of Mouse Embryo and Placental Development.
mRNA transcript levels at E7.5 (A), E9.5 and E11.5 (B) in laser captured samples of mouse embryo and placenta by Real-Time RT-PCR. Data was normalized to GAPDH and relative to EPC for E7.5 and GC’s for E9.5 and E11.5 target gene mRNA levels. Relative mRNA levels are presented as the mean ± s.e. representative of three independent replicates. Bars with different letters represent significant differences in relative mRNA levels between tissues (p≤0.05).
In-situ hybridization
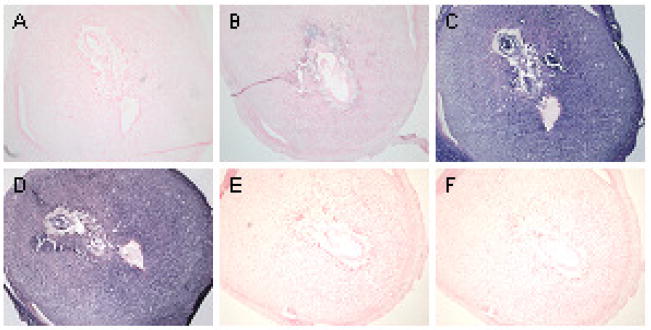
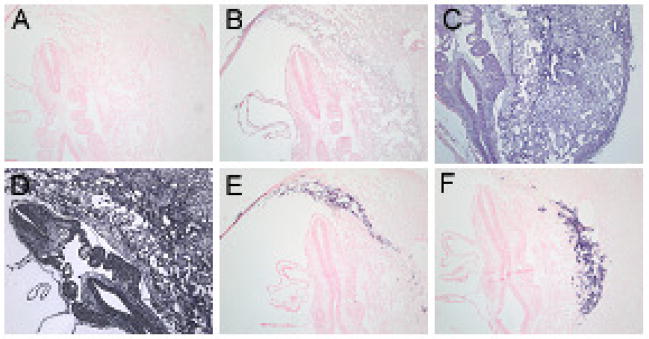
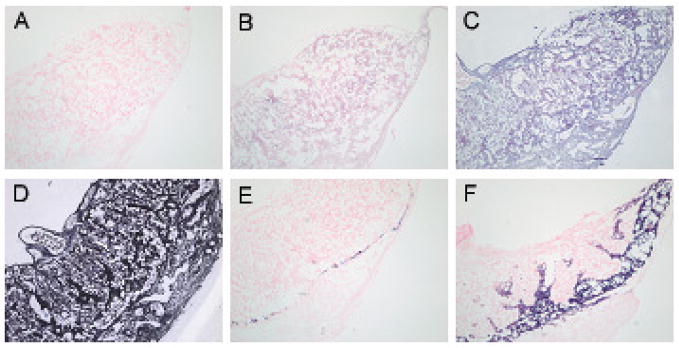
In situ hybridization was used to evaluate regional and cell specific expression of LAT-1 at different stages of embryonic development. Consistent with the laser capture data, differential LAT-1 mRNA expression was only seen at E 7.5 with darkest staining in the trophoblast giant cells. At this stage of development the intensity of hybridization was followed by maternal decidua, ectoplacental cone and epiblast (Fig. 3C). The markers for giant cells (Pl1 and Plf) and marker for spongiotrophoblast cells (Tpbpa) are not seen at this stage of development which is consistent with other observations. By E9.5 and E11.5 LAT-1 expression was no longer preferentially localized to TGCs and hybridization was equal across the different cell types and regions (Fig. 4 and Fig. 5). At those stages both Pl1 and Tpbpa mark the appropriate cell types [20].
Fig. 3. In situ hybridization of LAT-1 in E7.5 stage of mouse embryo and placenta.
No probe (A), sense probe for LAT1 (B), anti-sense probe for LAT1 (C), anti-sense probe for PolydT (D), anti-sense probe for Pl1 (E), and anti-sense probe for Tpbpα (F). TGC’s lining the implantation site, separating the maternal decidua from the ectoplacental cone as well as ectoplacental cone itself express LAT1 at highest level (C) compared to other tissues. All negative controls (A, B, E, F) and positive control (D) show no staining and homogenous staining across all tissues, respectively. Markers for TGC’s such as Pl1 (E) and Plf (not shown) are not expressed at that stage of embryo development.
Fig. 4. In situ hybridization on E9.5 stage of mouse embryo development.
No probe (A), sense probe for LAT1 (B), anti-sense probe for LAT1 (C), anti-sense probe for PolydT (D), anti-sense probe for Pl1 (E), and anti-sense probe for Tpbpα (F). More homogenous expression of LAT1 is seen at E9.5 embryo development with slightly darker staining for TGC’s lining the implantation site (C). All negative controls (A, B) show no staining and positive controls (D, E, F) show either homogenous staining across all tissues for PolydT (D), or TGC specific staining for Pl1 (E) and Plf (not shown) and Spongiotrophoblast specific staining for Tpbpα (F).
Fig 5. In situ hybridization on E11.5 stage of mouse embryo development.
No probe (A), sense probe for LAT1 (B), anti-sense probe for LAT1 (C), anti-sense probe for PolydT (D), anti-sense probe for Pl1 (E) and anti-sense probe for Tpbpα (F). Homogenous expression of LAT1 is seen at E11.5 embryo development (C). All negative controls (A, B) show no staining and positive controls (D, E, F) show either homogenous staining across all tissues for PolydT (D), or TGC specific staining for Pl1 (E) and Plf (not shown) and spongiotrophoblast specific staining for Tpbpα (F).
Immunohistochemistry and immunofluorescence
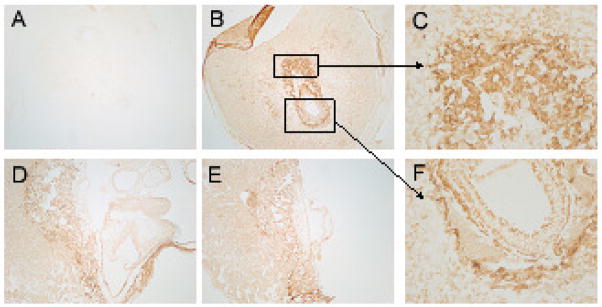
Tissue protein expression level of LAT-1 was assessed using immunohistochemical and immunofluorescent staining. The results are shown in Figure 6. Both immunohistochemistry and immunofluorescence showed the same results (therefore only immunohistochemistry is shown). As was seen with the results from LCM and in situ hybridization, LAT-1 protein expression showed the highest intensity of staining in trophoblast giant cells. This was particularly apparent at E7.5 but was also evident at E9.5 and E11.5.
Fig 6. Immunohistochemichemical Detection of LAT1 at Early Stages of Mouse Embryo Development.
No 1°Ab control (A), LAT1 at E7.5 (B, C, F), LAT1 at E9.5 (D) and LAT1 at E11.5 (E). Very distinct expression pattern was seen at E7.5 with highest protein localization in TGC’s and ectoplacental cone (B). (4X) Higher power of magnification of TGC’s and ectoplacental cone is shown in (C) and (F), respectively. (20X) At E9.5 (D) and E11.5 (E) LAT1 protein is more uniformly distributed among all tissues although TGC’s still show highest protein localization.
DISCUSSION
The placenta is the first complex mammalian organ to form during embryogenesis and its function is crucial to successful pregnancy. It is composed of many specialized, trophoblast cell types, each having a particular function and pattern of gene expression [21]. All trophoblast cell types are derived from the trophectoderm, which forms an outer shell of cells surrounding the inner cell mass (ICM) at the blastocyst stage of development. The cells of mural trophectoderm, not in direct contact with ICM, stop dividing and differentiate into trophoblast giant cells (TGC’s) that line the implantation site and invade the maternal decidua. In contrast, the cells in direct contact with ICM, polar trophectoderm, continue to proliferate and give rise to the trophoblast cell types that form the placenta [21].
Over expression of LAT-1 is characteristic of many primary human cancers and may be related to tumor progression [12–14]. Its expression has been marked immunohistochemically, correlated with survival and it may respresent a therapeutic target [22,23] The placenta has been employed by many investigators as a valuable experimental model for cancer biology. Like cancer, trophoblast cells are highly proliferative and can express and invasive phenotype. We sought to correlate the expression of LAT-1 with these properties. We examined ths cell specific and temporal expression of LAT-1 by different trophoblast cell types. Our data show that unlike most other transport systems known to be important in later embryonic evelopment, LAT-1 was expressed in preimplantation stages. In the earliest stage examined after implantation (E7.5) LAT-1 expression was restricted to trophoblast giant cells (TGS’s). This result was observed for both mRNA (in situ hybridization) and protein expression (immunohistochemistry). Later, when TGC’s have already made contact with the uterine epithelium and begun to invade and placentation is more advanced (E11.5), mRNA expression was more widely distributed and the level of differential expression was somewhat reduced. At this stage however, protein expression was still greatest in TGC’s. This observation is consistent with enhanced LAT-1 expression in invasive cancers [22,23]
Amino acids are critical not only as nutrients for the mammalian embryo but also as regulators of cell motility during implantation and continued development [25–30]. Trophoblast invasion is controlled by very sophisticated systems that specifically regulate motility, independently of many aspects of trophectoderm (TE) differentiation. Regulated motility confers the ability of developing trophoblast cells to initiate invasion. Amino acid signaling in the embryo is regulated in part through the ambient amino acid concentration in uterine environment [30]. LAT-1 is one of the earliest transporters expressed (Fig 1). Unlike most other transport systems known to be important in later embryonic development [31], only LAT-1 is expressed in preimplantation stages. Amino acid uptake and signaling thus provides one way for uterine and embryo developmental changes to be coordinated to the local environment. Culture of embryos in Eagle’s non-essential amino acids and glutamine decreases the time required for the first three cell divisions of mouse embryos [28] and stimulates blastocyst formation in vitro [29]. The culture of embryos in Eagle’s essential amino acids inhibits a development prior to the 8 cell stage. The same media, however, promotes blastocyst development and cell number when introduced after 8 cell stage [29]. A combination of non-essential amino acids and glutamine before the 8- to 16- cell stages and all amino acids after the 8- to 16-cell stages were found to be the best combination to improve embryo viability in vitro [32]. A similar combination of amino acids has been shown to improve human embryo viability in vitro and to increase embryo viability post transfer [33–35]. These findings, thus, have let to a significant decrease in the number of embryos that need to be transferred to achieve pregnancy. Amino acids thus play a critical role in preimplantation embryo development. Less is known, however, about the effect of amino acids and their transporters post embryo implantation and during later differentiation.
In vitro studies have suggested that embryo implantation is also regulated by the availability of amino acids. Embryos cultured in medium lacking amino acids can not form trophoblast cell outgrowths on fibronectin (an in vitro model of implantation) [18]. However, these embryos remain viable for up to 3 days in culture and can be reactivated to form outgrowths upon transfer to complete medium. Also, the window for trophoblast activation by amino acids is very precise during the development. Prior to 120 h post-hCG, alteration of amino acid concentration in culture does not affect later trophoblast outgrowth, whereas after 120 h post-hCG blastocyst will not progress to implantation –competent state unless provided with exogenous amino acids. However, contact with amino acids is needed for only a 4- to 8-h period at 120 h post-hCG. Further exposure to amino acids is not needed for development of trophoblast motility [18]. Amino acid signaling thus acts as a developmental checkpoint.
Amino acid dependent regulation of intracellular signaling pathways has been described in many systems [36]. Amino acid signaling activates the serine-threonine kinase mammalian target of rapamycin (mTOR), which then phosphorylates at least two proteins involved in regulation of translation initiation, p70S6K and PHAS-I [35]. The initiation of trophoblast cell motility also depends on amino acid signaling through mTOR. Treatment with rapamycin, a specific inhibitor of mTOR, inhibits initiation of trophoblast motility and spreading behavior. Rapamycin also blocks amino acid –initiated trophoblast motility and spreading behavior, whereas competitive inhibition of rapamycin with FK506 restores the amino acid stimulation. Under conditions of amino acid deprivation or rapamycin treatment, p70S6K remains un-phosphorylated, confirming that mTOR activation is inhibited in both cases [18]. These results show that amino acid-dependent mTOR signaling is involved in the development of trophoblast cell motility and initiation of implantation.
Since intracellular amino acids are not sufficient to activate mTOR signaling, de novo transport of amino acids, and particularly of leucine, is necessary for this activation. It has been proposed by Martin and Sutherland that the activity of the broad-scope and yet leucine- selective amino acid transport system B0,+ could produce such increases in intracellular amino acid concentrations. System B0,+ uses a Na+ gradient to drive amino acid uptake, and the Na+ concentration in uterine secretions increases by nearly two-fold about 18hrs before implantation. The resultant mTOR signaling could trigger polyamine, insulin-like growth factor II, and nitric oxide production in blastocysts and the increased cell motility which is sometimes associated with synthesis of these bioactive molecules [18].
Mouse blastocysts express at least 14 amino acid transporters. In the preimplantation embryos the activities of at least half of these transporter systems increase significantly upon blastocyst formation [29]. Of note, the B0,+ transport system is not expressed in preimplantation stages. Our data show that LAT-1 mRNA expression uniquely increases in early stages as the embryo develops to form blastocyst. Given its earlier expression than other transport systems, we believe it is likely that the LAT-1 transporter plays an important role in preimplantation embryo development and subsequent implantation. As mentioned above further studies examining its role in trophoblast motility will provide us with more insights on the mechanism of embryo implantation.
In summary, our results demonstrate that LAT-1 is expressed in all stages of the pre-implantation embryo. We further demonstrate quantitative changes expression as the embryo develops from zygote to blastocyst. Our data show that the cells expressing the highest level of LAT-1 at both the protein and RNA level during early post-implantation stages are TGCs. Trophoblast giant cells, which arise from the mural trophectoderm cells of the blastocyst, transform at the time of implantation into invasive cells that displace and phagocytose the uterine epithelial cells, penetrate the uterine stroma, and make vascular connections with the maternal blood supply. Our findings suggest that LAT-1 may play a critical role in trophoblast GCs migratory phenotype. Further studies investigating the migration of trophoblast cells using gain of function and/or disruption of LAT-1 expression will reveal its role in the trophoblast cell motility and invasion.
Acknowledgments
The authors thank Dr. James Cross, Dr. David Simmons and Dr. David Natale for their assistance in this work. This study was supported by NIEHS T32ESOO7272 Training in Environmental Pathology Grant, the Departments of Pathobiology and Pediatrics at Brown University and by a Center of Biomedical Research Excellence (COBRE) grant NCRR P20 RR018728.
Footnotes
Publisher's Disclaimer: This is a PDF file of an unedited manuscript that has been accepted for publication. As a service to our customers we are providing this early version of the manuscript. The manuscript will undergo copyediting, typesetting, and review of the resulting proof before it is published in its final citable form. Please note that during the production process errors may be discovered which could affect the content, and all legal disclaimers that apply to the journal pertain.
References
- 1.Jansson T. Amino Acid Transporters in the Human Placenta. Pediatr Res. 2001;49:141–147. doi: 10.1203/00006450-200102000-00003. [DOI] [PubMed] [Google Scholar]
- 2.Kudo Y, Boyd CAR. Human Placental Amino Acid Transporter Genes: Expression and Funtion. Reproduction. 2002;124:593–600. doi: 10.1530/rep.0.1240593. [DOI] [PubMed] [Google Scholar]
- 3.Kanai Y, Segawa H, Miyamoto K, Uchino H, Takeda E, Endou H. Expression Cloning and Characterization of a Transporter for Large Neutral Amino Acids Activated by the Heavy Chain of 4F2 Antigen (CD98) J Biol Chem. 1998;273:23629–23632. doi: 10.1074/jbc.273.37.23629. [DOI] [PubMed] [Google Scholar]
- 4.Christensen HN. Role of Amino Acid Transport and Countertransport in Nutrition and Metabolism. Physiol Rev. 1990;70:43–77. doi: 10.1152/physrev.1990.70.1.43. [DOI] [PubMed] [Google Scholar]
- 5.Nakamura E, Sato M, Yang H, Miyagawa F, Harasaki M, Tomita K, Matsuoka S, Noma A, Iwai K, Minato N. 4F2 (CD98) Heavy Chain Is Associated Covalently with an Amino Acid Transporter and Controls Intracellular Trafficking and Membrane Topology of 4F2 Heterodimer. J Biol Chem. 1999;274:3009–3016. doi: 10.1074/jbc.274.5.3009. [DOI] [PubMed] [Google Scholar]
- 6.Prasad PD, Wang H, Huang W, Kekuda R, Rajan DP, Leibach FH, Ganapathy V. Human LAT1, a Subunit of System L Amino Acid Transporter: Molecular Cloning and Transport Function. Biochem Biophys Res Commun. 1999;255:283–288. doi: 10.1006/bbrc.1999.0206. [DOI] [PubMed] [Google Scholar]
- 7.Haynes BF, Hemler ME, Mann DL, Eisenbarth GS, Shelhamer J, Mostowski HS, Thomas CA, Strominger Jl, Fauci AS. Characterization of a Monoclonal Antibody (4F2) that Binds to Human Monocytes and to a Subset of Activated Lymphocytes. J Immunol. 1981;126:1409–1414. [PubMed] [Google Scholar]
- 8.Hemler ME, Strominger JL. Characterization of the Antigen Recognized by the Monoclonal Antibody (4F2): Different Molecular Forms on Human T and B Lymphoblastoid Cell Lines. J Immunol. 1982;129:623–628. [PubMed] [Google Scholar]
- 9.Mastroberardino L, Spindler B, Pfeiffer R, Skelly PJ, Loffing J, Shoemaker CB, Varrey F. Amino-Acid Transport by Heterodimers of 4F2hc/CD98 and Members of a Permease Family. Nature. 1998;395:288–291. doi: 10.1038/26246. [DOI] [PubMed] [Google Scholar]
- 10.Mannion BA, Kolesnikova TV, Lin S-H, Thompson NL, Hemler ME. The Light Chain of CD98 Is Identified as E16/TA1 Protein. J Biol Chem. 1998;273:33127–33129. doi: 10.1074/jbc.273.50.33127. [DOI] [PubMed] [Google Scholar]
- 11.Sang J, Lim Y-P, Panzica M, Finch P, Thompson NL. TA1, a Highly Conserved Oncofetal Complementary DNA from Rat Hepatoma, Encodes an Integral Membrane Protein Associated with Liver Development, Carcinogenesis, and Cell Activation. Cancer Res. 1995;55:1152–1159. [PubMed] [Google Scholar]
- 12.Kim DK, Ahn SG, Park JC, Kanai Y, Endou H, Yoon JH. Expression of L-type Amino Acid Transporter 1 (LAT1) and 4F2 Heavy Chain (4F2hc) in Oral Squamous Cell Carcinoma and its Precursor Lesions. Anticancer Res. 2004;24:1671–1675. [PubMed] [Google Scholar]
- 13.Kim DK, Kanai Y, Choi HW, Tangtrongsup S, Chairoungdua A, Babu E, Tachampa K, Anzai N, Iribe Y, Endou H. Characterization of the System L Amino Acid Transporter in T24 Human Bladder Carcinoma Cells. Biochim Biophys Acta. 2002;1565:112–122. doi: 10.1016/s0005-2736(02)00516-3. [DOI] [PubMed] [Google Scholar]
- 14.Yanagida O, Kanai Y, Chairoungdua A, Kim DK, Segawa H, Nii T, Cha SH, Matsuo H, Fukasawa Y, Tani Y, Teketani Y, Uchino H, Kim JY, Inatomi J, Okayasu I, Miyamoto K, Tekeda E, Goya T, Endou E. Human L-type Amino Acid Transporter 1 (LAT1): Characterization of Expression in Tumor Cell Lines. Biochim Biophys Acta. 2001;1514:291–302. doi: 10.1016/s0005-2736(01)00384-4. [DOI] [PubMed] [Google Scholar]
- 15.Campbell WA, Sah DE, Medina MM, Albina JE, Coleman WB, Thompson NL. TA1/LAT1/CD98 Light Chain and System L Activity, but not 4F2/CD98 Heavy Chain, Respond to Arginine Availability in Rat Hepatic Cells. Loss of Response in Tumor Cells. J Biol Chem. 2000;275:5347–5354. doi: 10.1074/jbc.275.8.5347. [DOI] [PubMed] [Google Scholar]
- 16.Campbell WA, Thompson NL. Overexpression of LAT1/CD98 Light Chain is Sufficient to Increase System L-Amino Acid Transport Activity in Mouse Hepatocytes but not Fibroblasts. J Biol Chem. 2001;276:16877–16884. doi: 10.1074/jbc.M008248200. [DOI] [PubMed] [Google Scholar]
- 17.Gwatkin RB. Amino Acid Requirements for Attachment and Outgrowth of the Mouse Blastocyst in vitro. J Cell Physiol. 1966;68:335–344. [Google Scholar]
- 18.Martin PM, Sutherland AE. Exogenous Amino Acids Regulate Trophectoderm Differentiation Through an mTOR-dependent pathway. Dev Biol. 2001;240:182–193. doi: 10.1006/dbio.2001.0461. [DOI] [PubMed] [Google Scholar]
- 19.Lala PK, Lee BP, Xu G, Chakraborty C. Human Placental Trophoblast as an in vitro Model for Tumor Progression. Can J Physiol Pharmacol. 2002;80:142–149. doi: 10.1139/y02-006. [DOI] [PubMed] [Google Scholar]
- 20.Simmons DG, Fortier AL, Cross JC. Diverse Subtypes and Developmental Origins of Trophoblast Giant Cells in the Mouse Placenta. Dev Biol. 2007;304:567–78. doi: 10.1016/j.ydbio.2007.01.009. [DOI] [PubMed] [Google Scholar]
- 21.Cross JC, Werb Z, Fisher SJ. Implantation and the Placenta: Key Pieces of the Development Puzzle. Science. 1994;266:1508–1518. doi: 10.1126/science.7985020. [DOI] [PubMed] [Google Scholar]
- 22.Chatot CL, Ziomek CA, Bavister BD, Lewis JL, Torres I. An Improved Culture Medium Supports Development of Random-bred 1-cell Mouse Embryos in Vitro. J Reprod Fertil. 1989;86:679–88. doi: 10.1530/jrf.0.0860679. [DOI] [PubMed] [Google Scholar]
- 23.Nawashiro H, Otani N, Shinomiya N, Fukui S, Ooigawa H, Shima K, Matsuo H, Kanai Y, Endou H. L-type amino acid transporter 1 as a potential molecular target in human astrocytic tumors. Int J Cancer. 2006;119:484–92. doi: 10.1002/ijc.21866. [DOI] [PubMed] [Google Scholar]
- 24.Kaira K, Oriuchi N, Imai H, Shimizu K, Yanagitani N, Sunaga N, Hisada T, Kawashima O, Iijima H, Ishizuka T, Kanai Y, Endou H, Nakajima T, Mori M. Expression of L-type amino acid transporter 1 (LAT1) in neuroendocrine tumors of the lung. Pathol Res Pract. 2008;204:553–61. doi: 10.1016/j.prp.2008.02.003. [DOI] [PubMed] [Google Scholar]
- 25.Mehta TS, Kiessling AA. Development Potential of Mouse Embryos Conceived in Vitro and Cultured in Ethylenediaminetetraacetic Acid with and without Amino Acids or Serum. Biol. Reprod. 1990;43:600–606. doi: 10.1095/biolreprod43.4.600. [DOI] [PubMed] [Google Scholar]
- 26.Gardner DK, Lane M. Amino Acids and Ammonium Regulate Mouse Embryo Development in Culture. Biol Reprod. 1993;48:377–385. doi: 10.1095/biolreprod48.2.377. [DOI] [PubMed] [Google Scholar]
- 27.Devreker F, Hardy K, Van den Bergh M, Vannin AS, Emiliani S, Englert Y. Amino Acids Promote Human Blastocyst Development in Vitro. Hum Reprod. 2001;16:749–756. doi: 10.1093/humrep/16.4.749. [DOI] [PubMed] [Google Scholar]
- 28.Lane M, Gardner DK. Nonessential Amino Acids and Glutamine Decrease the Time of the First Three Cleavage Divisions and Increase Compaction of Mouse Zygotes in vitro. J Assist Reprod Genet. 1997;14:398–403. doi: 10.1007/BF02766148. [DOI] [PMC free article] [PubMed] [Google Scholar]
- 29.Lane M, Gardner DK. Differential Regulation of Mouse Embryo Development and Viability by Amino Acids. J Reprod Fertil Dev. 1997;109:153–164. doi: 10.1530/jrf.0.1090153. [DOI] [PubMed] [Google Scholar]
- 30.Bavister BD, McKiernan SH. Regulation of Hampster Embryo Development in Vitro by Amino Acids. In: Bavister B, editor. Preimplantation Embryo Development. Springer-Verlag; New York: 1993. p. 57. [Google Scholar]
- 31.Van Winkle LJ. Amino Acid Transport Regulation and Early Embryo Development. Biol Reprod. 2001;64:1–12. doi: 10.1095/biolreprod64.1.1. [DOI] [PubMed] [Google Scholar]
- 32.Steeves TE, Gardner DK. Temporal and Differential effects of Amino Acids on Bovine Embryo Development in Culture. Biol Reprod. 1999;61:731–740. doi: 10.1095/biolreprod61.3.731. [DOI] [PubMed] [Google Scholar]
- 33.Gardner DK, Schoolcraft WB, Wagley L, Schlenker T, Stevens J, Hesla J. A Prospective Randomized Trial of Blastocyst Culture and Transfer in in-vitro Fertilization. Hum Reprod. 1998;13:3434–3440. doi: 10.1093/humrep/13.12.3434. [DOI] [PubMed] [Google Scholar]
- 34.Gardner DK, Vella P, Lane M, Wagley L, Schlenker T, Schoolcraft WB. Culture and Transfer of Human Blastocysts Iincreases Implantation Rates and Reduces the Need for Multiple Embryo Transfers. Fertil Steril. 1998;69:84–88. doi: 10.1016/s0015-0282(97)00438-x. [DOI] [PubMed] [Google Scholar]
- 35.Jones GM, Trounson AO, Gardner DK, Kausche A, Lolatgis N, Wood C. Evolution of a Culture Protocol for Successful Blastocyst Development and Pregnancy. Hum Reprod. 1998;13:169–77. doi: 10.1093/humrep/13.1.169. [DOI] [PubMed] [Google Scholar]
- 36.Kimball SR, Jefferson LS. Regulation of protein synthesis by branched-chain amino acids. Curr Opin Clin Nutr Metab Care. 2001;4:39–43. doi: 10.1097/00075197-200101000-00008. Review. [DOI] [PubMed] [Google Scholar]
- 37.Martin PM, Sutherland AE, Von Winkle LJ. Amino Acid Transport Regulates Blastocyst Implantation. Biol Reprod. 2003;69:1101–1108. doi: 10.1095/biolreprod.103.018010. [DOI] [PubMed] [Google Scholar]


