Abstract
Electron transfer dissociation (ETD) of multi-protonated 6 - 20-mer oligonucleotides and 12- and 14-mer duplexes is compared to collision activated dissociation (CAD). ETD causes efficient charge reduction of the multi-protonated oligonucleotides in addition to limited backbone cleavages to yield sequence ions of low abundance. Subsequent CAD of the charge-reduced oligonucleotides formed upon electron transfer, in a net process termed electron transfer collision activated dissociation (ETcaD), results in rich fragmentation in terms of w, a, z, and d products, with a marked decrease in the abundance of base loss ions and internal fragments. Complete sequencing was possible for nearly all oligonucleotides studied. ETcaD of an oligonucleotide duplex resulted in specific backbone cleavages, with conservation of weaker non-covalent bonds.
Introduction
There is ongoing interest in exploring alternative electron-based ion activation/dissociation methods, such as electron capture dissociation (ECD),1,2 electron detachment dissociation (EDD),3,4 and ion-ion reactions,5-13 for sequencing nucleic acids. Collision activated dissociation (CAD) of deprotonated oligonucleotides is initiated by loss of a neutral or charged base, followed by subsequent backbone fragmentation into complementary w and a - B ions.14 In contrast, the dissociation of radical oligonucleotide anions, first illustrated by McLuckey et al.7 through ion-ion reactions, provides additional and complementary information to that afforded by CAD, with a significant decrease in base loss ions and substantial formation of w and a ions. For ion-ion reactions of oligonucleotide anions, the majority of reactants studied, including benzoquinoline and C4H9+,5 protonated pyridine,10,11 trifluoroacetic acid,12 Xe+• 7,13 and CCl3+,7 exclusively promote charge reduction by either proton transfer or electron transfer. In the case of Xe+• and CCl3+, CAD of the resulting charge-reduced odd-electron products subsequently resulted in the formation of w and a ions with no observable base loss.7 Backbone fragmentation was observed upon reaction of oligonucleotide anions with O2+• 5 and Ar+, Kr+, Xe+,13 and the degree of fragmentation was found to be related to the exothermicity of the ion-ion reaction.5
ECD of protonated oligonucleotides generates radical cations and a complex array of low abundance product ions, including w/d ions, a/z ions, c/x ions, and both wH/dH+• and aH/zH+• radical ions, in addition to those that entail base loss from many of the fragment ions (w/d - B, c/x - B, a/x - B), a feature which complicates spectral interpretation.1 (In palindromic sequences, w and d, a and z, and c and x ions have the same m/z values.) For the non-palindromic sequence dGCATGC, one zH+• and one wH+• ions were observed.1 Despite the significant number of product ions observed, sequence coverage was extensive but not complete for several of the six-mers studied.1,2
EDD of oligonucleotide anions generates radical and non-radical products similar to those obtained by ECD.3,4 Upon EDD, w/d and a•/z• series were observed for palindromic oligonucleotide sequences, and one z• ion was observed for the non-palindromic sequence dGCATGC.4 EDD of a small (6-mer) oligonucleotide duplex4 and several large (15-mer) oligonucleotide hairpins3 did not result in disruption of the fragile non-covalent interactions of the base pairs.
Because near-thermal electrons cannot be stabilized simultaneously with analyte ions of interest in ion traps that use radio frequency electrostatic fields, molecular anions were developed as vehicles for delivering electrons to multiply charged peptide and protein cations, an ion activation process termed electron transfer dissociation (ETD).15 Upon electron transfer, which is typically initiated by using the fluoranthene radical anion as an electron donor, the resulting charge-reduced peptides, which are radical cations and no longer even-electron ions, are unstable and undergo subsequent dissociation. The process of ETD in linear ion traps is similar to ECD in FTICR mass spectrometers.15-17 Like ECD, ETD provides a significant increase in sequence coverage for highly charged peptides (charge > 3),16 and several methods have been implemented to increase ETD efficiency for doubly protonated peptides.18,19 ETD has not yet been studied for oligonucleotide cations, which is the focus of the present study; however, related work by McLuckey et al. has entailed the exploration of several ion-ion reactions of positively-charged nucleic acids. For protonated oligonucleotides, reactions with perfluorocarbon anions results exclusively in charge reduction by proton transfer.6,8 No backbone fragmentation was observed.
Another electron-based ion activation method compatible with ion traps is electron photodetachment dissociation, EPD.20,21 In this process, oligonucleotide anions are irradiated with 260 nm photons, and then the resulting electron-detached species are subjected to CAD. In addition to neutral losses, a large number of products identified as w, d, a•, and z• ions were observed. Good sequence coverage was obtained for single strand oligonucleotides up to 20 nucleotides in length for this technique.20,21
In the present study, we explore the fragmentation patterns of positively charged oligonucleotides, both single strands and duplexes, using ETD. In all cases, ETD causes efficient charge reduction of the multi-protonated oligonucleotide cations, producing oligonucleotide radical cations. Subsequent CAD of these charge-reduced oligonucleotide radical ions, in a net process termed ETcaD,22 results in backbone fragmentation which is more extensive than that promoted by CAD of the corresponding even-electron species.
Experimental
Chemicals
The following oligodeoxynucleotides were obtained from Integrated DNA Technologies (Coralville, IA) on the 1.0 uM scale and used without further purification: 5′- AAAAAA-3′, 5′-CCCCCC-3′, 5′- GGGGGG-3′, 5′- TTTTTT-3′, 5′- TGGCCA-3′, 5′- ATGACTCG-3′, 5′-GTATGACTCGCA-3′, 5′- TCGTATGACTCGCAAG-3′, 5′-CATCGTATGACTCGCAAGTG-3′, 5′-GCGGGGATGGGGCG-3′, 5′-CGCCCCATCCCCGC-3′, 5′- CCCGGGTTTAAA-3′, and 5′- ATGCTGCCCGGG-3′. Oligonucleotide single strand concentrations were determined spectrophotometrically by Beer's Law using the extinction coefficients provided by the manufacturer. Annealing was performed by preparing stock solutions containing 2 mM of each complementary ODN in 100 mM ammonium acetate. The solutions were heated to 90°C for 10 min and slowly cooled to room temperature overnight. The following duplexes were created: duplex 1 = 5′-GCGGGGATGGGGCG-3′ / 5′-CGCCCCATCCCCGC-3′ and duplex 2 = 5′- CCCGGGTTTAAA-3′/5′- ATGCTGCCCGGG-3′. For ESI-MS analysis, the solution was diluted to 10μM of oligonucleotide by preparing in 20 mM ammonium acetate solution.
Mass Spectrometry
Oligonucleotide samples were directly electrosprayed into a Finnigan LTQ mass spectrometer (Thermo Electron Corp., San Jose, CA). A Harvard syringe pump (Holliston, MA) at a flow rate of 3 μL/min was used. The ESI source was operated in the positive ion mode with an electrospray voltage of 4.0 kV and a heated capillary temperature of 90 °C. To assist in desolvation, nitrogen sheath and auxiliary gas were applied at 40 and 20 arbitrary units, respectively. Spectra were acquired by summing 20 scans.
In the collision activated dissociation (CAD) experiments, collisional activation voltages were applied at a level required to reduce the isolated precursor ion to ∼10-20% of its original abundance. The default activation time of 30 ms was used in all CAD experiments with a qz value of 0.25. ETD reactions were performed with radical anions of fluoranthene generated by a chemical ionization source, typically for 100 ms unless otherwise noted. For ETcaD experiments, electron transfer was performed for typically 100 ms, and collisional activation voltages were again applied at a level required to reduce the isolated precursor ion to ∼10 - 20% of its original abundance. The default activation time of 30 ms was used in all ETcaD experiments, and the qz value was set to 0.25 except for the experiments in which qz was varied. The isolation width was set to 5 m/z for all MS/MS steps.
Results and Discussion
Positively charged oligonucleotides
Most previous ESI-MS investigations of DNA oligonucleotides and duplexes have been carried out using the negative ion mode. This follows logically from the knowledge that the phosphodiester backbone of the oligonucleotide has a pKa < 1, and is therefore fully deprotonated under most experimental conditions. In order to observe protonated nucleic acids, all the phosphates must be protonated, and several extra ionizing protons must also be added, most likely initially localized at the nucleobases.23 A handful of ESI-MS studies have been carried out on positively charged DNA oligonucleotides,24-28 and most authors concede that analysis is often easier in the negative mode, i.e. higher signal and a decrease in salt adducts are typical in the negative ion mode. Despite the generally accepted benefits of the negative mode for oligonucleotide detection by mass spectrometry, analysis in conjunction with ETD (or ECD) is not feasible for negatively-charged precursor ions which motivated us to assess the positive mode in order to exploit ETD for structural characterization of oligonucleotides.
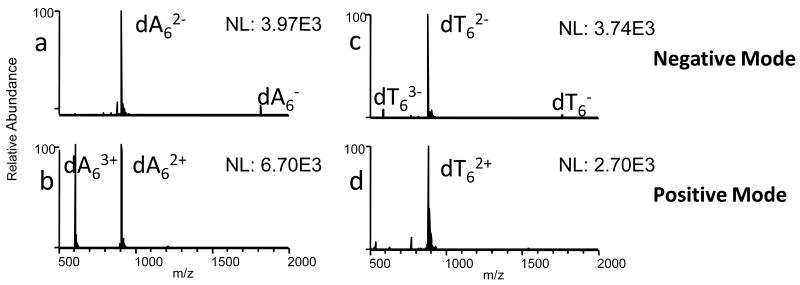
Using the LTQ linear ion trap instrument, oligonucleotide ions are easily produced in the negative or positive mode upon ESI (Figure 1). For most oligonucleotides (dA6, dC6, dG6, ss6, ss8 - ss20 (Table 1)), the total ion abundance is greater in the positive mode, and similar spectral quality is observed for both ion polarities (Figure 1a, b). Due to the low gas-phase basicity of thymine, molecular ions of dT6 are not expected to form in the positive ion mode.22 However, dT6 was easily observed in the positive mode in the linear ion trap, although the ion abundance is slightly lower than in the negative mode (Figure 1c, d). In addition, a slight shift to higher charge states is observed for most oligonucleotides in the positive mode, with the exception of dT6, in which the doubly charged ion is most abundant in both the positive and negative modes.
Figure 1.
ESI mass spectra of dA6 and dT6 in the negative and positive modes.
Table 1.
Summary of the oliognucleotide sequences used in this study.
| Name | Sequence | Molecular Weight (g/mol) |
|---|---|---|
| dA6 | 5′- AAAAAA-3′ | 1817.3 |
| dC6 | 5′- CCCCCC-3′ | 1673.1 |
| dG6 | 5′- GGGGGG-3′ | 1913.3 |
| dT6 | 5′- TTTTTT-3′ | 1763.2 |
| ss6 | 5′- TGGCCA-3′ | 1792.2 |
| ss8 | 5′- ATGACTCG-3′ | 2409.6 |
| ss12 | 5′- GTATGACTCGCA-3′ | 3645.4 |
| ss16 | 5′- TCGTATGACTCGCAAG-3′ | 4881.2 |
| ss20 | 5′- CATCGTATGACTCGCAAGTG-3′ | 6117.0 |
| d1 | 5′-GCGGGGATGGGGCG-3′ / 5′-CGCCCCATCCCCGC-3′ | 8531.6 |
| d2 | 5′- CCCGGGTTTAAA-3′/5′- ATGCTGCCCGGG-3′ | 7307.8 |
ETD, ETcaD, and CAD of small oligonucleotides
Oligonucleotides have been shown previously to exhibit sequence-dependent dissociation patterns attributed to the nature of the nucleobases by many of the electron-based activation techniques, including ECD, EDD, and EPD.1-4,20,21 In order to evaluate the potential impact of the nucleobases on the fragmentation pathways of oligonucleotide cations by ETD versus CAD, ETD, ETcaD and CAD experiments were undertaken for all four homogeneous six-mers, dC6, dA6, dG6, and dT6, in addition to ss6, which due to its heterogeneous sequence, produces a/z and w/d ions that can be distinguished from one another.
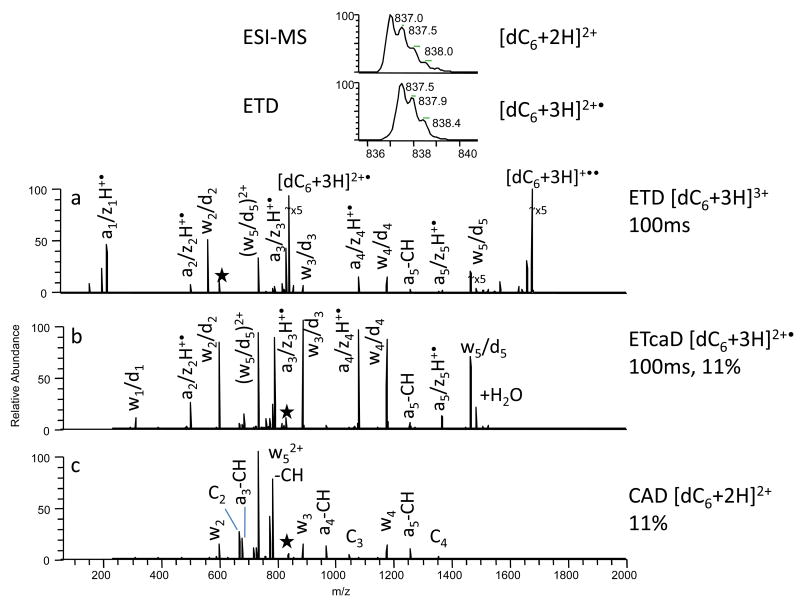
ETD of the [dC6 + 2H]2+ ion results exclusively in charge reduction (spectra not shown). As shown in Figure 2a, the [dC6 + 3H]3+ ion was isolated and subjected to electron transfer reactions for 100 ms, resulting primarily in charge reduction as well as an array of sequence ions. The inset in Figure 2 compares the isotopic distribution of the charge-reduced species resulting from ETD with the even electron protonated species observed in the original ESI mass spectrum. The ETD product ion is shifted by 1 Da compared to the ions formed directly by ESI, which confirms that charge reduction occurs via electron transfer (and not proton transfer), leading to the radical, [dC6 + 3H]2+•. Less abundant backbone sequence ions are also observed, including both the w/d and a/zH• types (Figure 2a). It is impossible to distinguish between these ion types (i.e. w versus d and a versus z) based on m/z alone because of the symmetry of the sequence. A complete series of a/zH• product ions are present, and near complete series of w/d ions are present as well, excluding the w1/d1 ion. Two a - B ions are observed (a4 - CH, a5 - CH).
Figure 2.
MS/MS spectra of dC6 by (a) ETD, (b) ETcaD, and (c) CAD. Precursor ions are noted with a star.
In general, ETD of the 3+ charge state of dC6 renders good sequence coverage, albeit at low relative abundance (Figure 2a). However, as described in more detail later, as the length of the oligonucleotide sequence increases, the number and abundance of product ions stemming from backbone cleavages diminish significantly and simple charge reduction becomes even more dominant (see below). To circumvent this shortcoming and to promote more extensive fragmentation, each charge-reduced ion was subsequently subjected to collisional activation, and this two stage activation process is termed ETcaD. For example, the abundant charge-reduced species, [dC6 + 3H]2+•, observed in Figure 2a was isolated and subjected to CAD, yielding the ETcaD spectrum shown in Figure 2b that displays an extensive series of w/d and a/zH• ions. A complete series of w/d product ions and nearly complete series of a/zH• ions are observed. Two a - B ions are also observed, a4 - CH and a5 - CH, but base loss alone is minimal. One [w5/d5 + H2O] product ion is observed, and a previous ECD study on oligonucleotide cations proposed a pathway by which this unusual type of ion might be formed.2 Briefly, intramolecular hydrogen bonding between the 5′ hydroxyl hydrogen and a backbone phosphate oxygen may be involved in the formation of the (w + H2O) ion, possibly through a pentavalent phosphorane structure in which the 5′ hydroxyl is transferred to the phosphate group.
The CAD spectrum of doubly protonated dC6 is shown for comparison in Figure 2c, with the same activation time (30 ms) and normalized collision energy (11%) as used for CAD of the charge-reduced [C6 + 3H]2+• ion discussed above. CAD results in production of several w ions, a - B ions, and internal ions, the latter of which often complicate spectral interpretation. In general the overall sequence coverage is significantly lower than that obtained by ETcaD. Base loss leads to the second most abundant product ion in the CAD mass spectrum (Figure 2c), whereas base loss ions constituted less than 5% of the total ion abundance in the ETcaD spectrum (Figure 2b).
ETD of the remaining six-mers also results in charge reduction by electron transfer as the primary reaction pathway, regardless of initial charge state. For example, similar to results described above for dC6, ETD of the 2+ charge state for dA6, dG6, dT6 and ss6 resulted solely in charge reduction by electron transfer, yielding [ss + 2H]+• ions. ETD of the 3+ charge state of dA6, dG6, and ss6 resulted primarily in charge reduction, yielding [ss + 3H]2+• ions, in addition to low abundance (<5%) sequence ions. Base loss remains an insignificant (<5%) pathway for all sequences. Upon CAD of the charge-reduced ions (net ETcaD), sequence coverage is complete or near-complete for all of the six-mers; however, the types of backbone cleavages produced for each sequence vary (see below). In addition, the contribution from base loss varies significantly across the sequences. The extent of base loss for dC6 and dT6 is low (less than 5% relative abundance), whereas base loss constitutes ∼50% relative abundance for dA6 and ss6 and greater than 90% abundance for dG6.
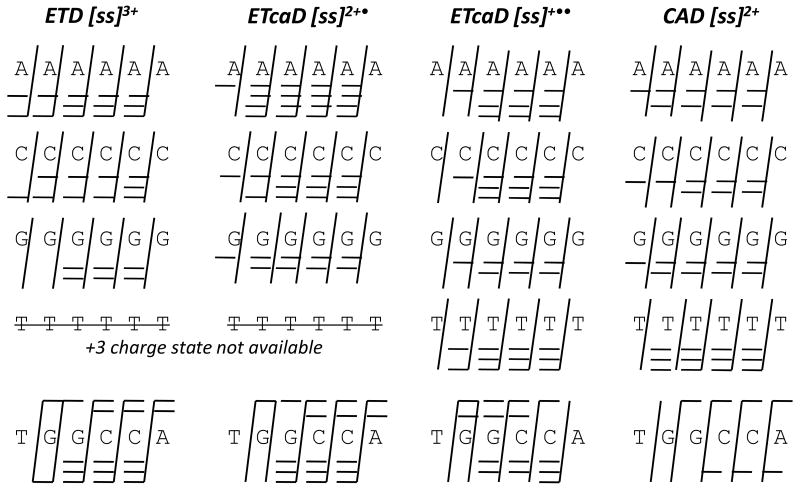
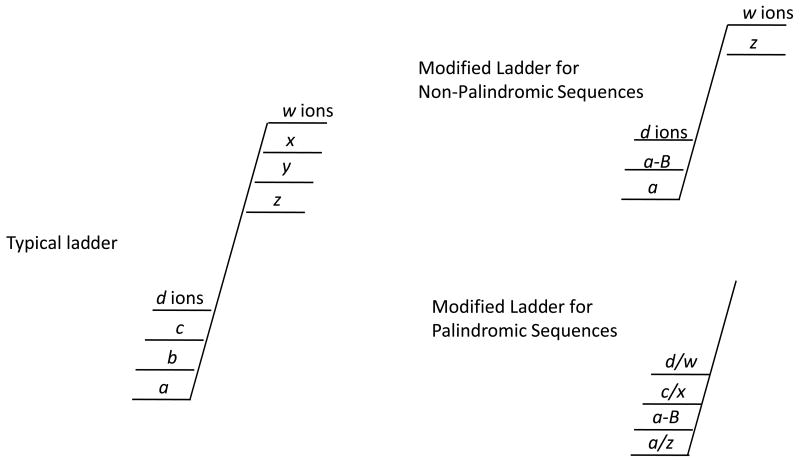
The sequence coverage obtained for all five six-mers by ETD, ETcaD, and CAD is summarized in Figure 3 based on a short-hand “ladder” notation described in Scheme 2. The rungs of the ladder represent each type of product ion observed. For the palindromic sequences, a/z, c/x, and d/w ions are not distinguishable, and the fragmentation nomenclature is altered slightly so that the products shown are not repetitive. All products shown consist of the 5′ end, although most are likely a mixture of 5′ and 3′ fragments. In short, ETD of the triply charged ions provides complete sequence coverage except for dG6, and ETcaD of the 2+• charge state (i.e 3+ → 2+• →) provides complete coverage for all sequences. For dA6, c/x ions are also observed. ETcaD of the 1+•• charge states (i.e. 3+ → 1+•• →) favors formation of higher m/z fragments, and a1/z1 and w1/d1 ions were not observed in any case. CAD of the doubly protonated six-mers does not afford complete sequence coverage for dT6 nor ss6, and only two types of ions are typically observed (the traditional w and a – B ions). ETD and ETcaD results could not be obtained for dT6 because the +3 charge state necessary for these experiments is not detected in the positive mode.
Figure 3.
Sequence coverage by ETD, ETcaD, and CAD for small oligonucleotide cations with varying base composition.
Scheme 2.
Shorthand nomenclature for product ions observed. (a) A ladder containing all product types, (b) modified ladder for non-palindromic sequences in which only product ions observed are shown, (c) modified ladder for palindromic sequences.
Based on this compilation of ETD and ETcaD spectra, the formation of even-electron or odd-electron product ions appears to be sequence dependent (Figure 4). (All sequence ions were surveyed, and examples with the best S/N are presented in Figure 4.) For the dC6 sequence (Figure 4a), w ions in both the ETD and ETcaD spectra possess an even number of electrons, as evidenced by the lack of change in m/z compared to the conventional even-electron w ions produced in the CAD spectrum. In contrast, nearly 100% of the a-type ion population is formed as radical ions, possessing an extra hydrogen atom as evidenced by an addition of 1 Da compared to the even-electron a ions produced upon CAD. This formation of radical a ions parallels the pathway proposed by Hakansson for ECD of oligonucleotide cations.2
Figure 4.
Isotopic distribution patterns of backbone fragments after ETD, ETcaD, and CAD for (a) dC6, (b) dA6, (c) dG6, and (d) dT6. ETD of dT6 was not possible for the 3+ charge state, and no backbone cleavages were observed upon ETD of the 2+ charge state.
For the dA6 sequence (Figure 4b), w ions in both the ETD and ETcaD spectra have an even number of electrons, again indicated by the lack of shift in the m/z value compared to the analogous even electron product in the CAD spectrum. The population of a ions in the ETD spectrum appears to consist nearly entirely of radicals; many of the a ions formed upon ETcaD (i.e. 3+ → 2+•) have lost one or two hydrogen atoms, represented by shifts in the m/z values of the a ions by 1 or 2 Da respectively.
For the dG6 sequence (Figure 4c), the w ion population in the ETD spectrum (3+) has nearly the same m/z distribution as observed in the CAD spectrum (3+), indicating a largely even-electron population of product ions. In the ETcaD spectrum, there is clearly a mixture of even and odd electron w ions. The same odd/even electron mixture occurs for the a - B population (a ions without the companion base loss are not generated by this sequence). In general there appears to be no consistent preference for formation of radical or even electron product ions for dG6, which is similar to the results obtained by Hakansson et al. for ECD.2
For the T6 sequence, only the 1+ and 2+ charge states were observed upon ESI, and ETD of the 2+ charge state did not produce any backbone cleavages. ETcaD was performed on the 1+• radical charge state. For the dT6 sequence (Figure 4d), about half of the w ion population observed in the ETcaD spectrum possesses an even number of electrons, a small portion appears to be in the radical form, (w + H)+•, and a significant portion of w ions are detected with two extra hydrogens, (w + 2H)+. The same diverse distribution of ions is observed for the a ion population, with about a third having an even number of electrons, a third are radicals with one extra hydrogen, and a third possess two extra hydrogens.
ETD, ETcaD, and CAD of longer oligonucleotides
ETD, ETcaD, and CAD were undertaken for several oligonucleotides of varying length in order to determine sequence coverage over several charge states and with increasing length. The oligonucleotides ss8, ss12, ss16, and ss20 were selected to mimic random sequences, with each one containing an equal number of the four nucleobases. In addition, each sequence is non-palindromic (i.e. does not read the same backwards and forwards) so that a and d ions are easily distinguished from z and w ions, respectively. With an increase in sequence length, the oligonucleotides did not produce as many diagnostic sequence ions upon ETD as upon ETcaD. Moreover, because the sequence ions in the ETD spectra collectively represent less than 5% of the total ion abundance, the data from ETD alone is not shown due to its overall lower analytical utility.
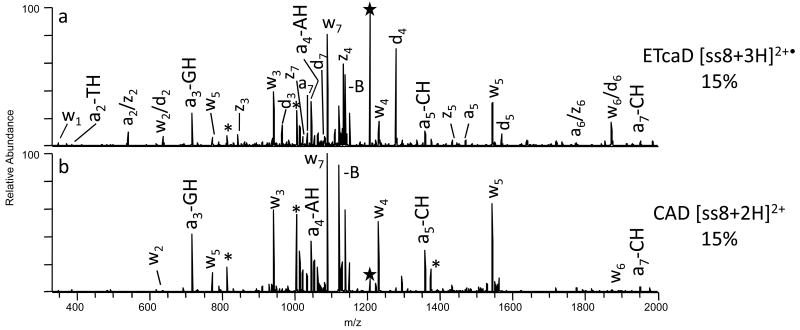
As an example, the charge-reduced species, [ss8 + 3H]2+•, produced upon ETD of the triply protonated oligonucleotide was subjected to CAD (Figure 5a). The resulting ETcaD spectrum displays an extensive series of abundant w, d, a, z, and a - B ions. In fact, a complete series of w product ions is observed, as well as near complete series of z and d ions, excluding the z1 and d1 ions. Several a and a - B ions are also observed, in addition to two internal ions. Base loss also constitutes approximately 50% of the total ion abundance. For comparison, CAD of the doubly protonated [ss8 + 2H]2+ ion is shown in Figure 5b, obtained using the same activation time (30 ms) and normalized collision energy (15%). CAD results in only two types of product ions, w and a – B ions. The relative abundance of the base loss product is also increased significantly, in fact greater than that observed in the ETcaD spectrum.
Figure 5.
MS/MS spectra of ss8 by (a) ETcaD, and (b) CAD. Precursor ions are noted with a star. Internal fragments are noted with an asterick.
For ions of the same charge state, the total dissociation efficiency for the even-electron protonated species is often somewhat higher than that of the odd-electron species for all oligonucleotides studied. This observation is based on the abundance of the surviving precursor ion in the ETcaD and CAD spectra obtained using the same normalized collision energy. This result is in direct contrast to the findings from other electron-based dissociation methods, for either oligonucleotide anions13 or peptide cations.19 In these studies, the radical precursor ions proved to be more easily dissociated than their kinetically more stable even-electron counterparts. In the present study, positive charges are added to the oligonucleotides during the ESI process, thus shifting the oligonucleotides from their thermodynamically preferred negative charge state. The addition of an electron to a positively charged oligonucleotide may increase the kinetic stability of the resulting oligonucleotide, thereby creating relatively more stable oligonucleotide radicals. This may account for the low degree of backbone fragmentation promoted by ETD for longer oligonucleotides.
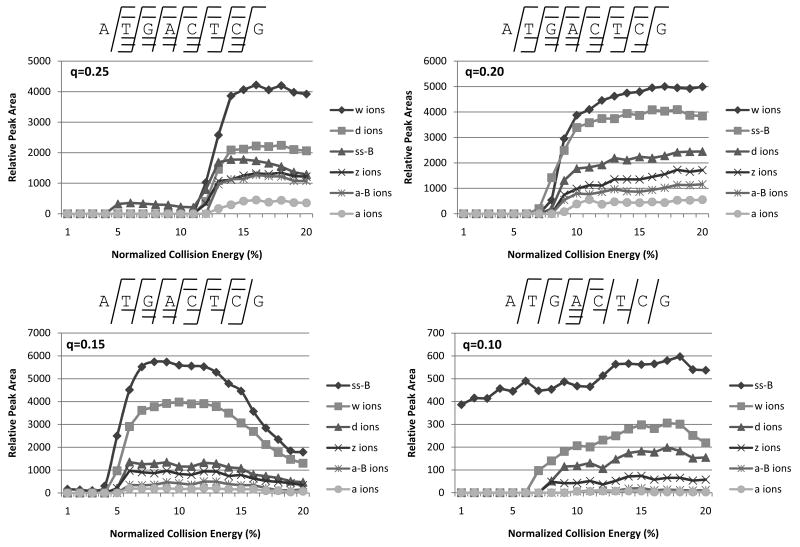
Coon et al. described a supplementary collisional activation technique (ETcaD) in which the effect of q and collision energy was studied for electron transfer collision activated dissociation (ETcaD) of tryptic peptides.19 Supplemental activation at low q value and low collision energy, (qz = 0.18, 20% normalized collision energy) of the fragile charge-reduced peptide ions, [M+3H]2+•, preferentially led to the efficient formation of the high energy c and z type products over the low energy b and y ions.19 Although it appears that the charge-reduced oligonucleotide ions produced upon ET in our study are relatively stable species, we were likewise interested in the effect of varying the activation qz value and collision energy on the relative abundances of the types of ions formed upon CAD of these ions (i.e net ETcaD).
Figure 6 displays the relative product ion distributions obtained upon ETcaD of one of the oligonucleotides, [ss8 + 3H]2+•, at four different qz values over a range of normalized collision energies, with a summary of the sequence coverage shown above each plot. At a qz value of 0.25, w ions dominate the spectra, with contributions from all the types of ions following the order w > d > base loss > z > a > a - B. As the qz value is lowered, the relative contributions from each series of ions remain the same, except for the base loss. At a qz value of 0.20, base loss represents the second most dominant ion type in terms of relative peak area, and for qz values of 0.15 and 0.10, the total contribution from base loss represents the dominant fragmentation pathway. Ion activation/dissociation promoted by ETcaD allows access to both higher energy and lower energy pathways, both which may require base loss as an intermediate step prior to backbone cleavage. As qz decreases and the precursor ions experience lower kinetic energies, less energy may be available to cause backbone cleavages after base loss has occurred, resulting in base loss as the dominant fragmentation pathway.
Figure 6.
The effect of excitation voltage for ETcaD of [ss8 + 3H]2+•, at qz values of 0.25, 0.20, 0.15, and 0.10. The fragments formed at each qz value are shown above each plot by the standard fragmentation nomenclature.
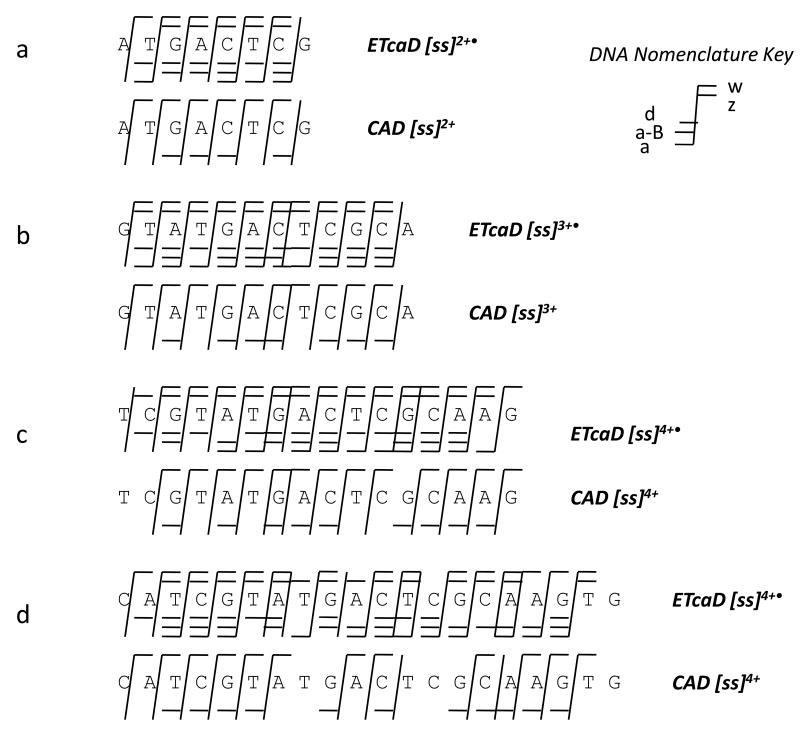
Figure 7 shows a summary of the sequence coverage for ss8, ss12, ss16, and ss20 obtained by ETcaD and CAD. The charge states selected for ETcaD or CAD are the highest charge states produced upon ESI of the oligonucleotide sequences. Consistent with the earlier summary shown in Figure 3, ETcaD produces a greater number of diagnostic sequence ions and affords better sequence coverage compared to that obtained by CAD for each charge state examined. Although an increase in the number of sequence ions clutters the MS/MS spectra, the redundancy in products offers better sequence coverage as the length of the oligonucleotide increases. In addition, base losses and uninformative internal fragments are consistently reduced for each of the oligonucleotides upon ETcaD compared to CAD.
Figure 7.
Sequence coverage by ETcaD and CAD for larger oligonucleotides and higher charge states (a) ss6, 15% collision energy (b) ss12, 15% (c) ss16, 15% and (d) ss20, 16%. All ETcaD experiments were performed with q=0.25 and 30 ms activation time.
ETD, ETcaD, and CAD of duplexes
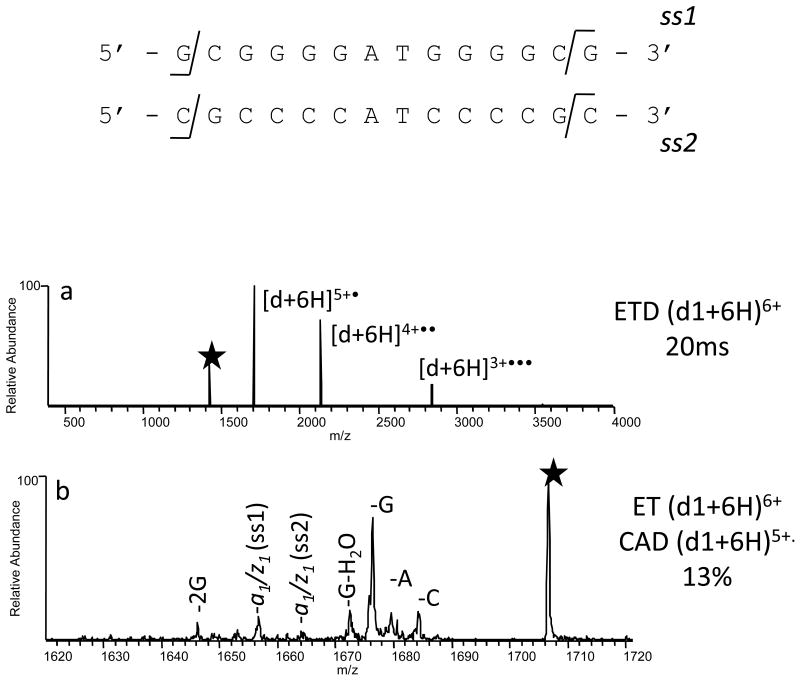
The capability of ECD to probe the conformations of proteins in the gas phase is based on the fact that ECD preferentially cleaves covalent backbone bonds without disrupting the far weaker non-covalent bonds.29-31 Higher order oligonucleotide structures have likewise been probed by EDD3 and EPD,20 and neither activation method seems to disrupt the non-covalent interactions in oligonucleotide duplexes. It is thus presumed that dissociation of radical ions is a fast process, occurring at specific covalent bonds without cleaving the non-covalent interactions such as hydrogen bonding that occurs in oligonucleotide base pairing. In the present study, ETD of oligonucleotide duplex cations results solely in charge reduction as shown for (d1 + 6H)6+ in Figure 8a. Collisional activation of the resulting (d1 + 6H)5+• radical ion (i.e. see the ETcaD spectrum in Figure 8b) causes predominantly base loss, similar to CAD of the (d1 + 5H)5+ ion, but also leads to the elimination of three a and z species. Loss of an a1 moiety from ss1 of the duplex would yield the [ss2 + w13]5+ product. A likely explanation for the minimal backbone cleavage occurring upon ETcaD of duplexes is that the ESI and ETD processes may promote partially unzipping near the end of the strands, but not complete strand separation. ETcaD would promote backbone cleavages near the termini if those bases were not involved in hydrogen bonding.
Figure 8.
MS/MS spectra of d1 by (a) ETD, and (b) ETcaD. Precursor ions are noted with a star.
ETD appears to cleave covalent bonds along the backbone of the oligonucleotide while preserving at least some of the non-covalent interactions. In order to evaluate the ability of ETD to determine higher order structure we designed a pair of sequences in which only half of the nucleotides consist of complementary base pairs, and the other half would not be expected to engage in any base-pairing interactions. We anticipated that the non-complementary half of the duplex should dissociate via predictable pathways by ETcaD, while the other half of the duplex should retain its hydrogen bonds and not undergo backbone cleavage. Figure 9 shows the ETcaD (Figure 9a) and CAD (Figure 9b) spectra obtained for this duplex based on activation of the (d2 + 5H)4+• and (d2 + 4H)4+ ions, respectively. The majority of backbone cleavages observed in the ETcaD spectrum occur on the non-complementary half of the duplex, whereas in the CAD spectrum, the majority of backbone cleavages occur on the complementary half. Similar to ETcaD of duplex 1 in Figure 8, a variety of neutral base losses are observed, in addition to an a1(ss2)/z1(ss1) loss and an a1(ss2)/z1(ss1) loss in conjunction with an adenine base loss. Loss of a and z species from the annealed portion of the duplex, which would be observed as elimination of a products containing guanine and cytosine bases, appears to be inhibited. Instead, one dominant loss occurs (other than base loss) that may be either the elimination of a1 from ss2 or z1 from ss1 (these losses have identical mass values), both of which occur at the termini of the non-complimentary half of the duplex.
Figure 9.
MS/MS spectra of d2 by (a) ETcaD, and (b) CAD. Precursor ions are noted with a star. Sequence coverage is shown at the right. Complementary base pairs are underlined. Internal fragments are noted with an asterick.
Conclusions
This is the first demonstration of ETD and ETcaD of oligonucleotide cations. Limited backbone cleavages are observed upon ETD, especially as oligonucleotide length increases, but electron transfer to the oligonucleotide cation is an efficient process. Subsequent CAD of the charge-reduced radical products results in extensive backbone cleavages with a marked decrease in base loss and internal fragments. As reported previously, ECD generates radical cations and a complex array of lower abundant fragment ions, including w/d ions, a/z radical ions, and c/x ions, in addition to base loss from many of the fragment ions (w/d - B, c/x - B, a/x - B), which complicated spectral interpretation.1,2 In contrast, as shown in the present study ETcaD produces only w, d, a, and z ions, with the exception of one homogenous sequence, A6, in which c/x ions were observed. No base losses from the product ions are observed for ETcaD. Both ECD and ETcaD of oligonucleotides results in a decrease of base loss and internal fragments compared to fragmentation by CAD alone. Despite the number and type of product ions observed for ECD, sequence coverage was incomplete for several 6-mers studied.1 For ETcaD, sequence coverage is near complete for oligonucleotides up to 20 base pairs in length, and is a better alternative for de novo sequencing of nucleic acid cations. ETD of the two oligonucleotide duplexes in this study suggest that ETcaD could be used as a probe of oligonucleotide higher order structures in the positive mode.
Scheme 1.
Oligonucleotide fragmentation nomenclature.
Acknowledgments
Funding from the Robert A. Welch Foundation (F-1155) and the National Institutes of Health (RO1 GM65956) is gratefully acknowledged. Smith acknowledges an NSF Graduate Research Fellowship (Fellow 2007038036).
Footnotes
Publisher's Disclaimer: This is a PDF file of an unedited manuscript that has been accepted for publication. As a service to our customers we are providing this early version of the manuscript. The manuscript will undergo copyediting, typesetting, and review of the resulting proof before it is published in its final citable form. Please note that during the production process errors may be discovered which could affect the content, and all legal disclaimers that apply to the journal pertain.
References
- 1.Schultz KN, Hakansson K. Int J Mass Spectrom. 2004;234:123. [Google Scholar]
- 2.Hakansson K, Hudgins RR, Marshall AG, O'Hair RAJ. J Am Soc Mass Spectrom. 2003;14:23. doi: 10.1016/S1044-0305(02)00708-0. [DOI] [PubMed] [Google Scholar]
- 3.Yang J, Hakansson K. Int J Mass Spectrom. 2008;276:144. [Google Scholar]
- 4.Yang J, Mo J, Adamson JT, Hakansson K. Anal Chem. 2005;77:1876. doi: 10.1021/ac048415g. [DOI] [PubMed] [Google Scholar]
- 5.Wu J, McLuckey SA. Int J Mass Spectrom. 2003;228:577. [Google Scholar]
- 6.McLuckey SA, Wu J, Bundy JL, Stephenson JL, Jr, Hurst GB. Anal Chem. 2002;74:976. doi: 10.1021/ac011015y. [DOI] [PubMed] [Google Scholar]
- 7.McLuckey SA, Stephenson JL, Jr, Richard AJ. J Am Soc Mass Spectrom. 1997;8:148. [Google Scholar]
- 8.Stephenson JL, Jr, McLuckey SA. Int J Mass Spectrom Ion Process. 1997;165/166:419. [Google Scholar]
- 9.Stephenson JL, Jr, McLuckey SA. R Comm Mass Spectrom. 1997;11:875. doi: 10.1002/(SICI)1097-0231(199705)11:8<875::AID-RCM934>3.0.CO;2-K. [DOI] [PubMed] [Google Scholar]
- 10.Herron WJ, Goeringer DE, McLuckey SA. Anal Chem. 1996;68:257. doi: 10.1021/ac950895b. [DOI] [PubMed] [Google Scholar]
- 11.Herron WJ, Goeringer DE, McLuckey SA. J Am Soc Mass Spectrom. 1995;6:529. doi: 10.1016/1044-0305(95)00199-N. [DOI] [PubMed] [Google Scholar]
- 12.McLuckey SA, Goeringer DE. Anal Chem. 1995;67:2493. doi: 10.1021/ac00110a026. [DOI] [PubMed] [Google Scholar]
- 13.Herron WJ, Goeringer DE, McLuckey SA. J Amer Chem Soc. 1995;117:115552. [Google Scholar]
- 14.McLuckey SA, Van Berkel GJ, Glish GL. J Amer Soc Mass Spectrom. 1992;3:60. doi: 10.1016/1044-0305(92)85019-G. [DOI] [PubMed] [Google Scholar]
- 15.Syka JEP, Coon JJ, Schroeder MJ, Shabanowitz J, Hunt DF. Proc Nat Acad Sci U S A. 2004;101:9528. doi: 10.1073/pnas.0402700101. [DOI] [PMC free article] [PubMed] [Google Scholar]
- 16.Pitteri SJ, Chrisman PA, Hogan JM, McLuckey SA. Anal Chem. 2005;77:1831. doi: 10.1021/ac0483872. [DOI] [PMC free article] [PubMed] [Google Scholar]
- 17.Hogan JM, Pitteri SJ, Chrisman PA, McLuckey SA. J Proteome Res. 2005;4:628. doi: 10.1021/pr049770q. [DOI] [PMC free article] [PubMed] [Google Scholar]
- 18.Pitteri SJ, Chrisman PA, McLuckey SA. Anal Chem. 2005;77:5662. doi: 10.1021/ac050666h. [DOI] [PMC free article] [PubMed] [Google Scholar]
- 19.Swaney DL, McAlister GC, Wirtala M, Schwartz JC, Syka JEP, Coon JJ. Anal Chem. 2007;79:477. doi: 10.1021/ac061457f. [DOI] [PMC free article] [PubMed] [Google Scholar]
- 20.Gabelica V, Tabarin T, Antoine R, Rosu F, Compagnon I, Broyer M, De Pauw E, Dugourd P. Anal Chem. 2006;78:6564. doi: 10.1021/ac060753p. [DOI] [PubMed] [Google Scholar]
- 21.Gabelica V, Rosu F, Tabarin T, Kinet C, Antoine R, Broyer M, De Pauw E, Dugourd P. J Amer Chem Soc. 2007;129:4706. doi: 10.1021/ja068440z. [DOI] [PubMed] [Google Scholar]
- 22.Swaney DL, McAlister GC, Wirtala M, Schwartz JC, Syka JEP, Coon JJ. Anal Chem. 2007;79:477. doi: 10.1021/ac061457f. [DOI] [PMC free article] [PubMed] [Google Scholar]
- 23.Green-Church KB, Limbach PA. J Amer Soc Mass Spectrom. 2000;11:24. doi: 10.1016/S1044-0305(99)00116-6. [DOI] [PubMed] [Google Scholar]
- 24.Rosu F, Pirotte S, De Pauw E, Gabelica V. Int J Mass Spectrom. 2006;253:156. [Google Scholar]
- 25.Gupta R, Beck JL, Ralph SF, Sheil MM, Aldrich-Wright JR. J Amer Soc Mass Spectrom. 2004;15:1382. doi: 10.1016/j.jasms.2004.07.005. [DOI] [PubMed] [Google Scholar]
- 26.Keller KM, Brodbelt JS. Anal Biochem. 2004;326:200. doi: 10.1016/j.ab.2003.12.010. [DOI] [PubMed] [Google Scholar]
- 27.Gupta R, Kapur A, Beck JL, Sheil MM. R Comm Mass Spectrom. 2001;15:2472. doi: 10.1002/rcm.524. [DOI] [PubMed] [Google Scholar]
- 28.Sannes-Lowery KA, Mack DP, Hu P, Mei H, Loo JA. J Amer Soc Mass Spectrom. 1997;8:90. [Google Scholar]
- 29.Xie Y, Zhang J, Yin S, Loo JA. J Amer Chem Soc. 2006;128:14432. doi: 10.1021/ja063197p. [DOI] [PubMed] [Google Scholar]
- 30.Geels RBJ, van der Vies SM, Heck AJR, Heeren RMA. Anal Chem. 2006;78:7191. doi: 10.1021/ac060960p. [DOI] [PubMed] [Google Scholar]
- 31.Breuker K, McLafferty FW. Angewan Chemie, Int Ed. 2003;42:4900. doi: 10.1002/anie.200351705. [DOI] [PubMed] [Google Scholar]


