

Abstract
Objective
Apelin is a novel adipokine acting on APJ receptor, regulated by insulin and tumor necrosis factor alpha (TNFα) in adipose tissue (AT). Plasma apelin levels are increased in obese hyperinsulinemic subjects. The aim was to investigate whether the hypocaloric diet associated with weight loss modifies the elevated plasma apelin levels and the expression of apelin and APJ receptor in AT in obese women.
Design and Methods
Fasting plasma levels of apelin and TNFα as well as mRNAs levels of apelin and APJ in AT were measured before and after a 12 weeks of hypocaloric weight-reducing diet in 20 obese women (BMI before diet 32.2 ± 6.4 kg.m2). Twelve healthy women with a BMI of 20.7 ± 0.6 kg.m2 served as reference.
Results
Plasma levels of apelin and TNFα were higher in obese compared with lean controls. The hypocaloric diet resulted in a significant decrease of BMI to 29.8± 6.3 kg.m2, plasma insulin (8.16 ± 0.73 to 6.58 ± 0.66 mU/L), apelin (369 ± 25 pg/ml vs 257 ± 12 pg/ml), TNFα levels (0.66 ± 0.04 pg/ml vs 0.56 ± 0.04 pg/ml) and AT mRNAs of apelin and APJ. In addition, changes in AT mRNA apelin were related to changes in AT mRNA APJ levels.
Conclusion
The hypocaloric diet associated with weight loss reduces the increased plasma and AT expression of apelin in obese women. This reduced apelin expression in AT could contribute to decreased circulating apelin levels.
Keywords: Adipose Tissue; metabolism; Adult; Diet, Carbohydrate-Restricted; methods; Female; Humans; Intercellular Signaling Peptides and Proteins; blood; metabolism; Middle Aged; Obesity; blood; diet therapy; metabolism; Receptors, G-Protein-Coupled; blood; metabolism; Time Factors; Treatment Outcome; Weight Loss
Introduction
Apelin has been described as a new adipokine, produced and secreted by human and mouse mature adipocytes (1). Apelin is a bioactive peptide identified as the endogenous ligand of APJ, a G protein-coupled receptor (2,3). Apelin peptides are derived from a 77- amino-acid precursor, which is processed to several active molecular forms such as apelin-36 or apelin-13 in different tissues and in the bloodstream (4). Apelin and APJ have been found to be expressed in the hypothalamus, stomach, endothelial cells, vascular smooth muscle cells, cardiomyocytes (for review see 5), in mouse adipocytes (6) and human osteoblasts (7). The most documented functions of apelin/APJ concern the regulation of fluid homeostasis (8) and the modifications of cardiac contractility and blood pressure (5).
So far, few data regarding the regulation of apelin or APJ are available, specially in humans. Apelin and APJ expression have been shown to follow a same pattern of regulation in human heart failure (9). Regulation of apelin expression by insulin (1) and by TNFα (10) in human adipocytes or adipose tissue (AT) has also been reported. Moreover the basal plasma levels of apelin are significantly higher in obese patients compared to control lean individuals (1), correlating positively with BMI (11). These data suggest that apelin could play an important role in obesity-related metabolic and cardiovascular alterations.
Therefore, the aim of this study was 1) to investigate whether the increased plasma apelin levels previously reported in obese subjects are reduced after a hypocaloric diet in obese women and 2) to study the effect of the hypocaloric diet on the expression of apelin and APJ in human subcutaneous abdominal AT.
Subjects and Methods
Subjects
Twenty obese women (age: 39.4 ± 9.5 years, range of body weight 72.5–132.5 kg) with a BMI of 32.2 ± 1.4 kg/m2 participated in the study. All women were premenopausal, drug-free and, based on their medical history, clinical findings and entry laboratory examination, did not suffer of any disease besides obesity. Their body weight was stable for at least three months before the beginning of the study. To obtain references values, 12 healthy and lean women (age 37.7 ± 2.8 years, weight 57.1 ± 1.3 kg, BMI 20.7 ± 0.6 kg/m2, fat mass 22.5± 1.9 %) were chosen. Informed consent to participate in the study was obtained from each subject before the beginning of the experiments. The study was performed according to the Declaration of Helsinki and approved by the Ethical Committee of Third Faculty of Medicine (Prague, Czech Republic).
Examination procedures
The subjects were investigated at 8 a.m. after an overnight fast before and at the end of 12 weeks of low-calorie diet (LCD). The clinical parameters of the subjects are shown in Table 1. Body composition was assessed using multifrequency bioimpedance (Bodystat, Quad scan 4000, Isle of Man). Coefficients of variation of fat mass, fat free mas and impedance were respectively 1.7%, 0.8% and 1.5% respectively. Samples of 10 ml of blood were collected on 50 μl of an anticoagulant and antioxidant cocktail (Immunotech, France) and processed immediately in a refrigerated centrifuge. The plasma was stored at −80°C until analysis. Needle biopsy of subcutaneous AT (0.5 –1.0 g) was performed under the local anesthesia (1% Xylocain) in the abdominal region (10–15 cm lateral of umbilic) and immediately frozen.
Table 1.
Clinical characteristics and metabolic parameters of lean controls and obese subjects before and after LCD.
| Obese | P | ||
|---|---|---|---|
| Before diet | After diet | ||
| Weight(kg) | 89.8±3.7 | 83.1±3.6 | <0.0001 |
| BMI(kg/m2) | 32.2±1.4 | 29.8±1.4 | <0.0001 |
| Fat mass (%) | 41.3±1.1 | 39.0±1.4 | <0.001 |
| Fat (kg) | 37.8±2.6 | 33.3±2.7 | <0.0001 |
| Waist circumference (cm) | 96.4±3.1 | 88.8±2.8 | <0.0001 |
| Waist-to-hip ratio (WHR) | 0.81±0.02 | 0.79±0.01 | <0.0005 |
| Systolic blood pressure (mm Hg) | 116±2 | 115±3 | 0.260 |
| Diastolic blood pressure (mm Hg) | 73±2 | 72±2 | 0.522 |
| Cholesterol (mmol/L) | 5.76±0.23 | 5.27±0.18 | <0.01 |
| Triglycerides (mmol/L) | 1.28±0.09 | 1.00±0.07 | <0.005 |
| HDL-C (mmol/L) | 1.70±0.07 | 1.51±0.05 | <0.001 |
| Glucose (mmol/L) | 5.14±0.10 | 4.97±0.09 | 0.0862 |
| HOMA-IR | 1.89±0.18 | 1.47±0.16 | <0.01 |
The data presented are means ± SEM in obese subjects before (n= 20) and after (n= 20) LCD. P: probalities obtained with nonparametric Wilcoxon’s test for paired observations (before and after LCD)
Dietary intervention
The diet was designed to provide 600 kcal/d less than the individually estimated energy requirement based on calculated pre-treatment resting metabolic rate multiplied by a coefficient of correction for physical activity level of 1.3. The target macronutrient composition of the diet was 25–30% of total energy from fat, 15% from protein and 55-60% from carbohydrate. Subjects were given oral and written instructions relating to these targets based on either a template or an exchange system. Subjects were requested to abstain from alcohol consumption. The dietary instructions were reinforced and monitored by dieticians weekly. Compliance to the diet was monitored using one-day-weighed food records that were presented each week during the above mentioned dietary consultation. session. In addition to that, a 3-day-weighed food record of two weekdays and one weekend day was performed before the study and during the last week of the intervention. The dietary records were analyzed using the food-nutrient database routinely used in each center.
Real-time RT-PCR
Total RNAs (0.5 μg) were isolated from AT biopsies using RNeasy Lipid Tissue Kits (QIAGEN, France) and were reverse transcribed using random hexamers and Superscript II reverse transcriptase (Invitrogen, UK). Real time PCR was generated by SYBER green method and performed as previously described (1). Analysis of the 18 S ribosomal RNA was performed in parallel using the ribosomal RNA control Taqman Assay Kit (Applied Biosystem) to normalize gene expression. The following oligonucleotide primers pairs were used: apelin Sens : GCGGTTATGTCTCCTCCATAGATT Reverse : GTGCGAGGTGAGAGCTGAATG; APJ Sens : GCCCTTGCTTTCTGAAAATCA Reverse : GGACAGTTAAAGGATGTGCATAGGA.
Analytical methods
Plasma glucose was determined by the glucose-oxidase technique (Beckman Instruments, CA). Plasma insulin concentration was measured by RIA (Immunotech, Czech Republic). Plasma apelin levels were measured with a commercially available enzyme-linked immunoassay (ELISA) kit (Phoenix Pharm., USA). The sensitivity of the assay was 0.2 ng/ml and the intra-assay error was below 5%. The ELISA had 100% cross-reactivity with human apelin-12, apelin13 and apelin-36. Concentrations of TNFα in plasma were measured using ultra-sensitive ELISA kit (Biosource International, USA).
Statistical analysis
Statistical analysis was performed using SPSS 12.0 for Windows (SPSS Inc., USA). Differences were tested with nonparametric Wilcoxon’s test for paired observations. Correlations were analysed by Spearman’s nonparametric test. Data are presented as means ± SEM. Differences at the level of P < 0.05 were considered statistically significant.
Results
Effect of LCD on metabolic variables
The LCD resulted in mean body weight loss of 6.7 ± 0.6 kg (7.4% loss of the initial body weight), a reduction of total and HDL cholesterol, plasma triglycerides and no change in blood glucose and blood pressure. Moreover, homeostasis model assessment index of insulin resistance (HOMA-IR) was decreased suggesting an increase in insulin sensitivity of the subjects (table 1).
Effect of LCD on plasma apelin, insulin and TNFα levels
Apelin plasma levels were elevated in obese (369 ± 25 pg/ml, n=20) compared to lean women (272 ± 20 pg/ml, n = 12, P = 0.02). After LCD, plasma levels of apelin in obese subjects were significantly decreased (figure 1). Plasma concentrations of TNFα (0.66 ± 0.04 pg/ml, n=20 vs 0.54 ± 0.07 pg/ml, n=12, P = 0.014 ) and insulin (8.16 ± 0.73 mU/ml, n=20 vs 4.31± 0.56 mU/ml, n=12) were also higher in obese compared to controls and, like apelin, decreased after LCD (figure 1).
Figure 1.
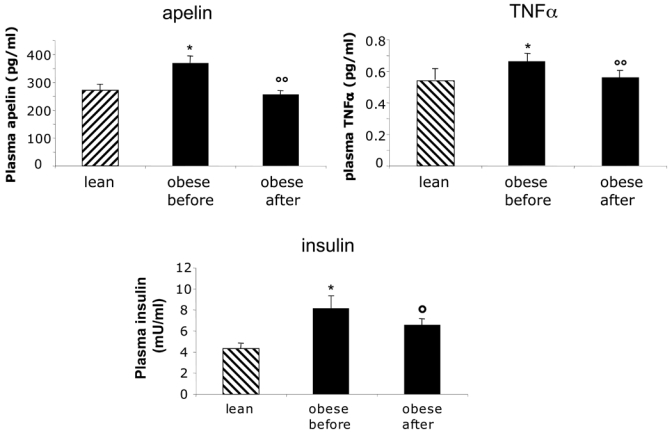
Plasma apelin, insulin and TNFα levels in lean (n=12) and obese women before and after LCD (n= 20). Data are presented as mean ± SEM. * P< 0.05 compared with lean subjects, °°P < 0.001 compared with obese before LCD. °P< 0.05 compared with obese before LCD
Associations of plasma apelin levels with anthropometric and metabolic variables
No correlation between the diet-induced decrease of insulin or TNFα blood levels and plasma apelin was found in the entire group. Then the patients were stratified into two subgroups according to the magnitude of the diet-induced decrease of insulin resistance: group 1 (designated as high-responders, n = 12) with a decrease of HOMA-IR by more than 20% of the initial value; group 2 (low-responders, n = 8) with a decrease of HOMA-IR ≤ 20%. In the subgroup of high-responders, the diet-induced changes in plasma apelin levels directly correlated with the diet-induced decrease of metabolic variables such as plasma insulin and TNFα levels (Table 2) but also the decrease of HOMA-IR, waist circumference and Waist-to-hip ratio (WRH).
Table 2.
Correlations between the diet-induced changes of plasma apelin levels and those of selected anthropometric and metabolic variables in high and low responders to the diet.
| Diet -induced change in | High-responders (n=12) | Low-responders (n=8) |
|---|---|---|
| BMI | -0.168 | -0.143 |
| Fat mass | -0.049 | -0.500 |
| Waist circumference | 0.626(*) | -0.190 |
| WHR | 0.746(**) | -0.310 |
| triglycerides | -0.510 | 0.143 |
| HDL | 0.140 | -0.476 |
| HOMA | 0.736(**) | 0.455 |
| plasma insulin | 0.644(*) | 0.500 |
| plasma TNFɑ | 0.549(*) | -0.095 |
Values are the Spearman correlation coefficient
P<0.05
P<0.01
Effect of LCD on apelin and APJ expression in adipose tissue
In order to know whether the observed decrease of apelin plasma levels could be due to reduced production of apelin by AT, apelin mRNA level was measured in lean and obese subjects before and after LCD. Apelin mRNAs were increased in obese compared to lean subjects (figure 2A) and a significant diet-induced decrease of apelin mRNA was observed after LCD. Thus, apelin plasma levels and apelin expression in AT were decreased in obese subjects after LCD (figure 3). Since apelin and APJ expression have been shown to often follow a same regulation pattern (9), we studied the expression of APJ in AT in lean and obese subjects before and after LCD. Interestingly, the expression of apelin receptor APJ was also significantly increased in obese compared to lean subjects and decreased in AT after LCD (figure 2B). Moreover, a tight positive correlation was observed between changes in apelin and changes in APJ mRNA levels (figure 4).
Figure 2.
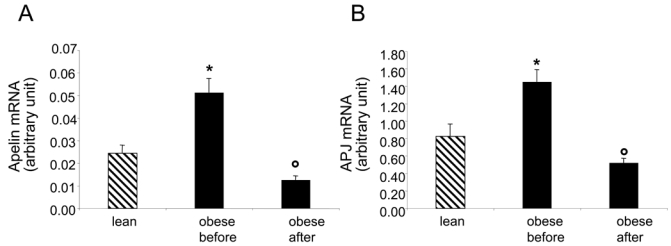
Expression of apelin and APJ in adipose tissue of lean (n=12) and obese women before and after LCD (n=18). Values are means + SME, * P< 0.001 compared with lean, °P < 0.001 compared with obese before LCD.
Figure 3.
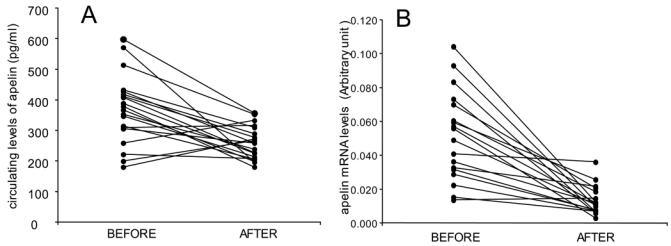
Individual apelin plasma concentrations (A) (n= 20) and adipose tissue apelin mRNA levels (B) before and after LCD in obese subjects (n= 18). The mean circulating apelin plasma levels is represented in figure 1 and the mean of apelin mRNA expression in AT in figure 2.
Figure 4.
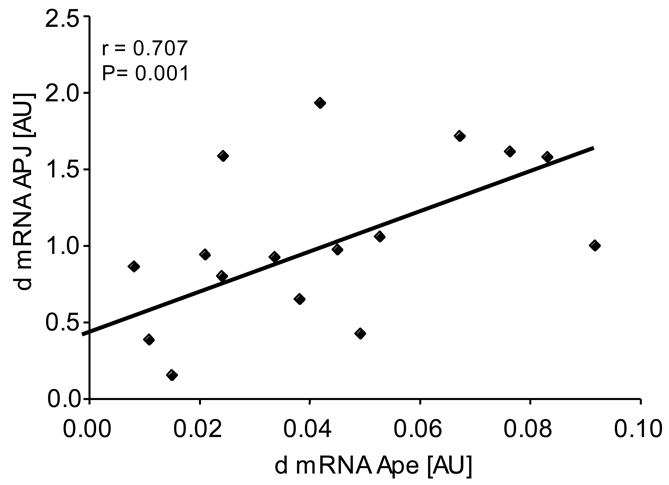
Correlation between changes in apelin (apelin before-apelin after: d) and changes in APJ expression in adipose tissue in obese subjects (n= 18). r: Spearman correlation coefficient.
Discussion
Elevated plasma apelin has been described by our group in moderately (1) and by Heinonen et al in severe obese (11). It has also been shown that plasma apelin levels were increased in diabetic subjects and positively correlated with BMI, HOMA-IR and fasting plasma insulin (12), suggesting a role of apelin in the pathogenesis of type II diabetes. However, no data are available on a potential reversal of the elevated plasma apelin in obese subjects. In the present study, the hypocaloric diet associated with weight reduction resulted in a reduction of plasma apelin levels. At the end of the diet, the plasma apelin levels in obese approached the range found in lean controls. The diet-induced reduction of plasma apelin was assoaciated with a decrease of apelin mRNA expression in subcutaneous adipose tissue. It is to be noted that the diet-induced changes described in this study may be due to body weight loss ( i.e. reduction to body fat mass) as well as to the effect of the caloric restriction, i.e. negative energy balance, itself.
It is interesting to note that the relationship between apelin and insulin or TNFα during obesity and obesity-associated disorders (1, 10, 12) is still maintained maintained at the end of the hypocaloric diet but is dependent of the magnitude of insulin sensitivity. Therefore, insulin and TNFα could be potential candidates involved in the regulation of the diet-induced decrease of apelin blood levels, in agreement with previous studies (1, 6, 10). Leptin could be another candidate regulating apelin production. Indeed, a high correlation has been described between apelin gene expression in subcutaneous AT and leptin serum or leptin mRNA in rat AT (13). In addition, since a correlation between apelin and HOMA-IR was observed only in subjects ameliorating their insulin sensitivity, the relationship between apelin and insulin resistance is strengthened. The relationship of apelin to blood pressure changes was not assessed since in spite of diet-induced apelin decrease, no correlation between the individual diet-induced change of plasma apelin and systolic and diastolic blood pressure were found. Thus both plasma apelin and apelin AT mRNA were decreased after LCD suggesting that the reduced apelin expression in AT could contribute to decreased circulating apelin levels. In the present study, AT was obtained from the abdominal subcutaneous region. The comparative value of apelin expression between intra-abdominal and subcutaneous AT, and hence their relative contribution to plasma apelin levels are not known. Cross sectional studies investigating the expression of apelin in visceral fat in relation to subcutaneous fat expression and to metabolic indices are certainly warrented. However, during dietary intervention, changes in other sites than AT of apelin production are not excluded.
In addition to the effect of the hypocaloric diet on apelin, we also studied APJ expression in AT. Apelin and APJ receptor are often co-localized in the same tissues and display similar variations of expression. The most documented co-regulation of the apelin/APJ system was reported in the cardiovascular domain. Either down-regulated (9) or increased expression (14) of both apelin and APJ were observed in humans or rodents heart presenting cardiac dysfunction. In the current study, we found not only a decrease of APJ and apelin expression after LCD period but also a significant correlation between the diet-induced changes of apelin and APJ expression in AT. Therefore, a similar regulation of apelin and APJ mRNA expression in human AT may be suggested and a common factor regulating apelin and APJ expression could be hypothesized.
In conclusion, the present study demonstrates that, in obese women, the hypocaloric diet associated with weight reduction and with a decrease of insulin resistance promotes a reduction of the elevated plasma apelin levels and of the expression of apelin and APJ in subcutaneous AT. Although apelin has been viewed as a beneficial adipokine up-regulated in obesity (15, 16), it remains to establish whether the increased levels of apelin observed in obesity are an attempt to overcome either insulin resistance or obesity-related cardiovascular diseases or another metabolic defect such as apelin resistance. Thus, understanding the contribution of such an adipokine in obesity-associated disorders appears to be of major importance.
Acknowledgments
We thank for technical assistance Zuzana Parizkova and Marie-Adeline Marquez
This study was supported by Grant 303/04/0158 of Grant agency of Czech Republic, grant IGA NR 9161-3-2007 of the Ministry of Health of Czech Republic, by the research project of MSMT of Czech Republic MSM 0021620814 and by the project MolPAGE, supported by the European Commission under the 6th Framework Programme (Project 512066 (LSHG-CT- 2004)).
Footnotes
# Both authors equally participate to this work
References
- 1.Boucher J, Masri B, Daviaud D, Gesta S, Guigne C, Mazzucotelli A, Castan-Laurell I, Tack I, Knibiehler B, Carpene C, Audigier Y, Saulnier-Blache JS, Valet P. Apelin, a newly identified adipokine up-regulated by insulin and obesity. Endocrinology. 2005;146:1764–1771. doi: 10.1210/en.2004-1427. [DOI] [PubMed] [Google Scholar]
- 2.Tatemoto K, Hosoya M, Habata Y, Fujii R, Kakegawa T, Zou MX, Kawamata Y, Fukusumi S, Hinuma S, Kitada C, Kurokawa T, Onda H, Fujino M. Isolation and characterization of a novel endogenous peptide ligand for the human APJ receptor. Biochemical and Biophysical Research Communications. 1998;251:471–476. doi: 10.1006/bbrc.1998.9489. [DOI] [PubMed] [Google Scholar]
- 3.Falcao-Pires I, Leite-Moreira AF. Apelin: a novel neurohumoral modulator of the cardiovascular system: Pathophysiologic importance and potential use as a therapeutic target. Revista Portuguesa de Cardiologia. 2005;24:1263–1276. [PubMed] [Google Scholar]
- 4.Masri B, Knibiehler B, Audigier Y. Apelin signalling: a promising pathway from cloning to pharmacology. Cellular Signalling. 2005;17:415–426. doi: 10.1016/j.cellsig.2004.09.018. [DOI] [PubMed] [Google Scholar]
- 5.Kleinz MJ, Davenport AP. Emerging roles of apelin in biology and medicine. Pharmacology and Therapeutics. 2005;107:198–211. doi: 10.1016/j.pharmthera.2005.04.001. [DOI] [PubMed] [Google Scholar]
- 6.Wei L, Hou X, Tatemoto K. Regulation of apelin mRNA expression by insulin and glucocorticoids in mouse 3T3-L1 adipocytes. Regulatory Peptides. 2005;132:27–32. doi: 10.1016/j.regpep.2005.08.003. [DOI] [PubMed] [Google Scholar]
- 7.Xie H, Tang SY, Cui RR, Huang J, Ren XH, Yuan LQ, Lu Y, Yang M, Zhou HD, Wu XP, Luo XH, Liao EY. Apelin and its receptor are expressed in human osteoblasts. Regulatory Peptides. 2006;134:118–125. doi: 10.1016/j.regpep.2006.02.004. [DOI] [PubMed] [Google Scholar]
- 8.De Mota N, Reaux-Le Goazigo A, El Messari S, Chartrel N, Roesch D, Dujardin C, Kordon C, Vaudry H, Moos F, Llorens-Cortes C. Apelin, a potent diuretic neuropeptide counteracting vasopressin actions through inhibition of vasopressin neuron activity and vasopressin release. Proceedings of the National Academic of Sciences USA. 2004;101:10464–10469. doi: 10.1073/pnas.0403518101. [DOI] [PMC free article] [PubMed] [Google Scholar]
- 9.Iwanaga Y, Kihara Y, Takenaka H, Kita T. Down-regulation of cardiac apelin system in hypertrophied and failing hearts: Possible role of angiotensin II-angiotensin type 1 receptor system. Journal of Molecular Cell Cardiology. 2006;41:798–806. doi: 10.1016/j.yjmcc.2006.07.004. [DOI] [PubMed] [Google Scholar]
- 10.Daviaud D, Boucher J, Gesta S, Dray C, Guigne C, Quilliot D, Ayav A, Ziegler O, Carpene C, Saulnier-Blache JS, Valet P, Castan-Laurell I. TNFalpha up-regulates apelin expression in human and mouse adipose tissue. FASEB Journal. 2006;20:1528–1530. doi: 10.1096/fj.05-5243fje. [DOI] [PubMed] [Google Scholar]
- 11.Heinonen MV, Purhonen AK, Miettinen P, Paakkonen M, Pirinen E, Alhava E, Akerman K, Herzig KH. Apelin, orexin-A and leptin plasma levels in morbid obesity and effect of gastric banding. Regulatory Peptides. 2005;130:7–13. doi: 10.1016/j.regpep.2005.05.003. [DOI] [PubMed] [Google Scholar]
- 12.Li L, Yang G, Li Q, Tang Y, Yang M, Yang H, Li K. Changes and relations of circulating visfatin, apelin, and resistin levels in normal, impaired glucose tolerance, and type 2 diabetic subjects. Experimental Clinical Endocrinology and Diabetes. 2006;114:544–548. doi: 10.1055/s-2006-948309. [DOI] [PubMed] [Google Scholar]
- 13.Garcia-Diaz D, Campion J, Milagro FI, Martinez JA. Adiposity dependent apelin gene expression: relationships with oxidative and inflammation markers. Molecular and Cellular Biochemistry. 2007;305:87–94. doi: 10.1007/s11010-007-9531-5. [DOI] [PubMed] [Google Scholar]
- 14.Atluri P, Morine KJ, Liao GP, Panlilio CM, Berry MF, Hsu VM, Hiesinger W, Cohen JE, Joseph Woo Y. Ischemic heart failure enhances endogenous myocardial apelin and APJ receptor expression. Cellular and Molecular Biology Letters. 2007;12:127–138. doi: 10.2478/s11658-006-0058-7. [DOI] [PMC free article] [PubMed] [Google Scholar]
- 15.Beltowski J. Apelin and visfatin: unique “beneficial” adipokines upregulated in obesity? Medical Science Monitor. 2006;12:RA112–119. [PubMed] [Google Scholar]
- 16.Castan-Laurell I, Boucher J, Dray C, Daviaud D, Guigne C, Valet P. Apelin, a novel adipokine over-produced in obesity: friend or foe? Molecular and Cellular Endocrinology. 2005;245:7–9. doi: 10.1016/j.mce.2005.09.012. [DOI] [PubMed] [Google Scholar]