Abstract
Cardiac mitochondria can take up Ca2+, competing with Ca2+ transporters like the sarcoplasmic reticulum (SR) Ca2+-ATPase. Rapid mitochondrial [Ca2+] transients have been reported to be synchronized with normal cytosolic [Ca2+]i transients. However, most intra-mitochondrial free [Ca2+] ([Ca2+]mito) measurements have been uncalibrated, and potentially contaminated by non-mitochondrial signals. Here we measured calibrated [Ca2+]mito in single rat myocytes using the ratiometric Ca2+ indicator fura-2 AM and plasmalemmal permeabilization by saponin (to eliminate cytosolic fura-2). The steady-state [Ca2+]mito dependence on [Ca2+]i (with 5 mM EGTA) was sigmoid with [Ca2+]mito< [Ca2+]i for [Ca2+]i below 475 nM. With low [EGTA] (50 μM) and 150 nM [Ca2+]i(±15 mM Na+) cyclical spontaneous SR Ca2+ release occurred (5–15/min). Changes in [Ca2+]mito during individual [Ca2+]i transients were small (~2–10 nM/beat), but integrated gradually to steady-state. Inhibition SR Ca2+ handling by thapsigargin, 2 mM tetracaine or 10 mM caffeine all stopped the progressive rise in [Ca2+]mito and spontaneous Ca2+ transients (confirming that SR Ca2+ releases caused the [Ca2+]mito rise). Confocal imaging of local [Ca2+]mito (using rhod-2) showed that [Ca2+]mito rose rapidly with a delay after SR Ca2+ release (with amplitude up to 10 nM), but declined much more slowly than [Ca2+]i (time constant 2.8 ±0.7 s vs. 0.19 ±0.06 s). Total Ca2+ uptake for larger [Ca2+]mito transients was ~0.5 μmol/l cytosol (assuming 100:1 mitochondrial Ca2+ buffering), consistent with prior indirect estimates from [Ca2+]i measurements, and corresponds to ~1% of the SR Ca2+ uptake during a normal Ca2+ transient. Thus small phasic [Ca2+]mito transients and gradually integrating [Ca2+]mito signals occur during repeating [Ca2+]i transients.
Keywords: Mitochondria, calcium transport, cardiac myocytes, sarcoplasmic reticulum
Introduction
In cardiac myocytes, cytosolic Ca2+ concentration ([Ca2+]i) transiently increases during each heart beat, initiating cellular contraction, and decreases during diastole to allow relaxation. The majority of the energy needed for contraction and intracellular ion homeostasis is provided by mitochondria via oxidative phosphorylation. Mitochondrial ATP production is sensitive to intra-mitochondrial free [Ca2+] ([Ca2+]mito) as several key enzymes of the Krebs cycle and the F1FoATPase are activated by micromolar Ca2+ [1]. [Ca2+]mito may therefore provide important feedback between cellular energy demand and supply, especially when increased cardiac inotropy is mediated by increased [Ca2+]i (e.g. during beta-adrenergic stimulation) [2]. Numerous participants and regulators of mitochondrial Ca2+ in- and efflux contribute to the complex regulation of [Ca2+]mito which is important to maintain cellular function [3].
Ca2+ influx into mitochondria occurs via the mitochondrial Ca2+ uniporter (mCU), a low affinity (K0.5 ~tens of micromolar), high capacity uptake mechanism which utilizes the large electrochemical gradient for Ca2+ across the inner mitochondrial membrane [3]. So far, the molecular entity of the mCU has not been identified, but was recently functionally characterized as an inwardly rectifying Ca2+-selective channel [4]. Additionally, mitochondrial Ca2+ uptake has been proposed to occur via a rapid mode of Ca2+ uptake (RaM) [5] and via mitochondrial ryanodine receptors [6]; however, the contribution of these putative mechanisms to the regulation of [Ca2+]mito in cardiomyocytes is unclear.
The low Ca2+ affinity of the mCU may limit Ca2+ entry during diastole and normal Ca2+ transients (where spatially averaged [Ca2+]i is 0.1 – 1 μM). However, because parts of mitochondria are in close spatial proximity to sarcoplasmic reticulum (SR) Ca2+ release sites, the local [Ca2+]i near ryanodine receptors or IP3-receptors may greatly exceed bulk [Ca2+]i allowing more rapid mitochondrial Ca2+ uptake via mCU [7].
Mitochondrial Ca2+ efflux occurs predominantly in a Na+-dependent manner (K0.5~4–10 mM) via the mitochondrial Na+/Ca2+-exchanger (NCXm) [8]. Mitochondrial Ca2+ regulation is therefore sensitive to variations in cytosolic [Na+] ([Na+]i) which may occur during ischemia/reperfusion [9] or during heart failure [10]. Although Na+-independent mitochondrial Ca2+ efflux has been proposed [11], in the heart its contribution to [Ca2+]mito seems negligible [12].
It is well established that cardiac mitochondria can take up a small fraction of the cytosolic Ca2+ involved in excitation-contraction (EC) coupling [8, 13], potentially shaping cellular Ca2+ signals [14]. However, two aspects remain unclear and controversial. First, it is unresolved whether [Ca2+]mito rapidly follows the beat-to-beat variations of [Ca2+]i or whether [Ca2+]mito changes slowly, integrating variations in [Ca2+]i over many beats [8, 15]. Second, [Ca2+]mito measurements have generally not been calibrated, making it difficult to know how large the [Ca2+]mito transients are and how important the phasic [Ca2+]mito signals are relative to Ca2+ fluxes during EC-coupling.
In this study, we investigated calibrated mitochondrial [Ca2+] changes in response to both steady changes in [Ca2+]i (in heavily buffered solution) and in response to SR Ca2+ release in permeabilized rat ventricular cardiomyocytes. During SR Ca2+ release, [Ca2+]mito rises rapidly with a delay after the [Ca]i rise, but shows much slower decline, resulting in beat-to-beat integration. During steady-state SR Ca2+ releases, mitochondrial Ca2+ uptake is small and Ca2+ influx and efflux are balanced. The amplitude of the [Ca2+]mito transient during an individual [Ca2+]i transient is less than 10 nM. These data provide novel insights into mitochondrial Ca2+ regulation in cardiac myocytes.
Methods
Cardiac myocyte preparation, dye loading and cell permeabilization
Cardiac ventricular myocytes were isolated from adult male Sprague-Dawley rats (250–300 g) using protocols approved by the UC Davis Institutional Animal Care and Use Committee (IACUC) (see Online Supplement for details). Freshly isolated cells were plated on laminin-coated glass cover slips for at least 45 min before dye loading. All experiments were performed at room temperature (RT) (22–23°C).
Cells were loaded with 10 μM fura-2 AM for 45 min or with rhod-2 AM for 30 min at RT in nominally Ca2+ free Tyrode’s solution (in mM: HEPES 5, NaCl 140, KCl 4, MgCl2 1, glucose 10; pH adjusted to 7.4 with NaOH). 30 min were allowed for de-esterification. Before permeabilization the bath solution was changed to a Na+-free/Ca2+-free Tyrode’s solution (in mM: HEPES 10, tetraethylammonium chloride 140, KCl 4, MgCl2 1, EGTA 2, glucose 10; pH adjusted to 7.4 with Trisma base) for 3–5 min. The cell surface membrane was permeabilized with saponin by exposure to a solution containing 50 μg/mL saponin and (in mM) HEPES 10, K-aspartate 135, MgCl2 0.7, EGTA 2, reduced glutathione 10, MgATP 5, glucose 10 for 30 s or less.
Solutions
A highly Ca2+-buffered, Ca2+-free, Na+-free internal solution contained (in mM): EGTA 5, HEPES 20, K-aspartate 100, KCl 40, MgCl2 1, maleic acid 2, glutamic acid 2, pyruvic acid 5, KH2PO4 0.5, BDM 15, pH 7.2 adjusted with trisma base. To control [Ca2+]i, 1.00 M CaCl2 solution (Fluka, #21115) was added as calculated with Max-Chelator (http://www.stanford.edu/~cpatton/maxc.html). Free [Ca2+] was confirmed by Ca2+-sensitive electrode measurements. Na+-free internal solution with low Ca2+ buffering capacity and 150 nM free [Ca2+] contained (in mM): EGTA 0.05, CaCl2 0.0234, HEPES 20, K-aspartate 100, KCl 40, MgCl2 0.551, maleic acid 2, glutamic acid 2, pyruvic acid 5, KH2PO4 0.5, MgATP 5, reduced glutathione 10, pH 7.2 adjusted with trisma base. When NaCl was added to these solutions, equal amounts of KCl were omitted. Calibration solutions contain 2–3 μM ionomycin, 10 μM FCCP and 20 μg/mL oligomycin.
Fluorescence microscopy
Fura-2 fluorescence was measured (Nikon DIAPHOT 200, 40× oil-immersion objective) with excitation at 345±10 and 380±5 nm (F340 and F380), with emission at 505±50 nm. The signals were corrected for background and autofluorescence by subtracting averaged signals from unloaded cells (n=6, determined every day). Autofluorescence (unloaded cell signal minus empty field signal) is ≤10% of background corrected Fura-2 signals. Laser scanning confocal microscopy (Zeiss, LSM5 Pascal, 40× water immersion objective) was used for imaging. For mitochondrial localization Fura-2 was loaded as above and 500 nM Mitotracker Orange was included during de-esterification. Fura-2 and Mitotracker Orange were excited sequentially at 405 nm (diode laser) and 453 nm (helium-neon laser) with emission at 505–530 nm and 560–615 nm bandpass filters, respectively. Mitochondrial Rhod-2 fluorescence was measured with the same confocal microscope (543 nm excitation, emission >560 nm) as 2-dimensional images or in line-scan mode (786 ms/frame and 3–26 ms/line). In some rhod-2 experiments, [Ca2+]i was measured simultaneously with [Ca2+]mito using 2 or 5 μM K5fura-2 in the internal solution (405 nm excitation, 505–530 nm emission). In permeabilized cells not loaded with rhod-2/AM, 50% of the fura-2 fluorescence intensity measured at 505–530 nm was detected in the rhod-2 window (>560 nm), contaminating the rhod-2 signal. The corrected rhod-2 signal is F543corr = F543 + (F4050 – F405)/2, where F543 is the raw rhod-2 fluorescence, F4050 is the resting fura-2 signal and F405 is the fura-2 signal (which decreases during Ca2+ transients).
A Ca2+-insensitive, isosbestic signal (Fc) was calculated from the Ca2+-sensitive fluorescence signals as described by Zhou & Neher [16] (see Results and Online Supplement). In situ calibration of mitochondrial fura-2 was performed (see Fig. 2C-D and Online Supplement for details) using 2–3 μM ionomycin, 10 μM FCCP and 20 μg/mL oligomycin to allow [Ca2+]i - [Ca2+]mito equilibration. This allowed transformation of mitochondrial fura-2 signals to [Ca2+]mito.
FIGURE 2. Mitochondrial free [Ca2+] measurements with fura-2.
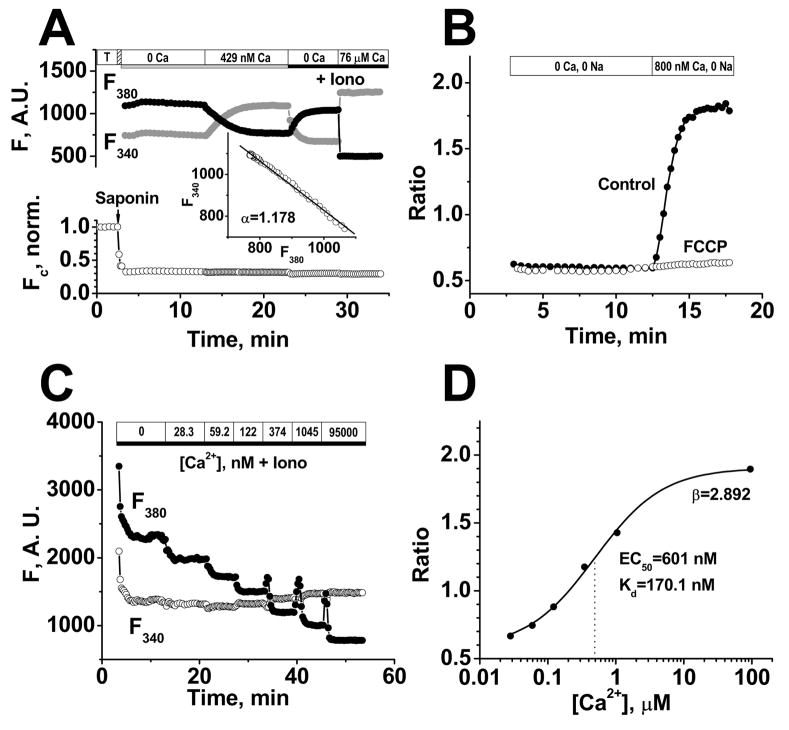
A, Top traces show background-corrected fura-2 fluorescence at 340 and 380 nm excitation after permeabilization. The inset shows plot of F340 vs. F380 as [Ca2+]mito varies to determine αand allows measurement of Fc (Ca2+-independent fura-2 fluorescence) in bottom normalized trace showing loss of 70% of fura-2 upon permeabilization. B, Rise in [Ca2+]mito in the presence of 800 nM Ca2+ and in the absence of Na+ (±2.5 μM FCCP added 2 min prior to increasing [Ca2+]i). C, In situ calibration of background subtracted fura-2 fluorescence in permeabilized cells in the presence of 3 μM ionomycin (Iono), 10 μM FCCP and 20 μg/mL oligomycin. D, Fura-2 ratio dependence on [Ca2+]i for data in C fit to [Ca2+] = Kdβ(R-Rmin)/(Rmax-R), where EC50 = Kdβ and β = F380-max/F380-min.
Drugs and Statistics
Indicators were obtained from Invitrogen (Eugene, OR), Ru360, CGP-37157 from CALBIOCHEM (La Jolla, CA) and other chemicals from Sigma (St. Louis, MO). Data are presented as mean ± SD of n measurements. Comparison between groups was performed with One-Way ANOVA (significant at P < 0.05).
Results
Mitochondrial free [Ca2+] measurements in rat myocytes
To measure calibrated [Ca2+]mito in isolated ventricular rat cardiomyocytes we used the ratiometric Ca2+ indicator fura-2 under conditions promoting mitochondrial fura-2 loading, and removed cytosolic indicator by permeabilization. Saponin-induced permeabilization allows tight control of the cytosolic milieu (e.g. free [Ca2+], [Na+], Ca2+-buffering capacity) while allowing periodic SR Ca2+ release when desired.
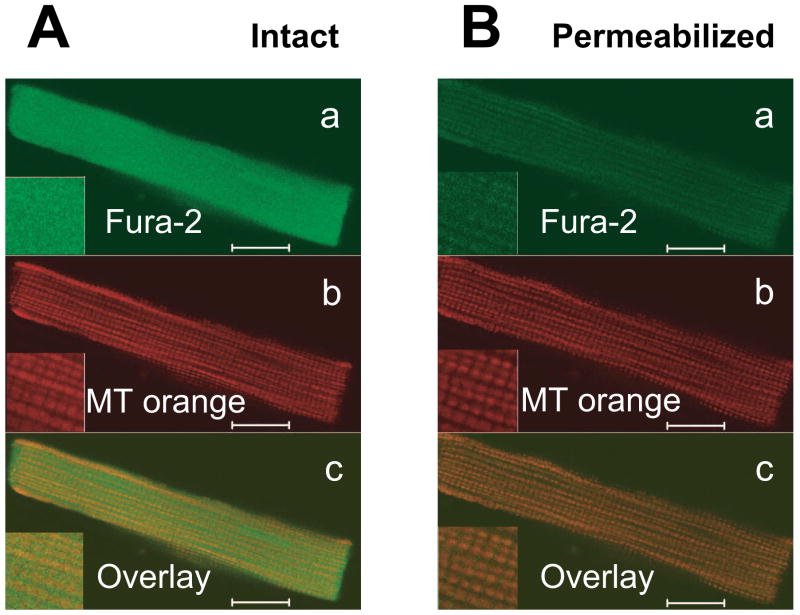
Figure 1A shows confocal images of an intact cardiomyocyte after loading with fura-2 (Fig. 1Aa, green) and mitochondrial staining with Mitotracker Orange (Fig. 1Ab, red). Saponin permeabilization (Fig. 1B) did not appreciably alter the characteristic mitochondrial pattern with Mitotracker Orange, but washed out most of the fura-2, leaving residual fura-2 matching the mitochondrial pattern.
Figure 1. Mitochondrial localization of fura-2 in permeabilized myocytes.
Confocal images of intact rat ventricular cardiomyocyte simultaneously loaded with fura-2 and Mitotracker Orange before (A) and after sarcolemmal permeabilization by saponin (B). Top panels (a) are fura-2 signals, middle panels (b) are Mitotracker Orange, showing typical mitochondrial pattern and lower panels (c) show merged images. Fura-2 only colocalizes with mitochondria after permeabilization. Scale bars are equal 10 μm.
To measure the fraction of total fura-2 loading that was mitochondrial, we used the Ca2+-insensitive fura-2 fluorescence (Fc) before and after permeabilization (Fig. 2A). Fc was calculated Fc = F340 + αF380, where -α is the slope of the F340 vs. F380 curve when [Ca2+]mito changes (top parts of Fig. 2A, where [Ca2+]mito was altered by raising [Ca2+]i from 0 to 429 nM). The Fc trace in Fig. 2A shows that saponin permeabilization released 70% of the total fura-2 loaded into the intact myocyte (note that Fc did not change with [Ca2+]mito). The remaining 30% of fura-2 was compartmentalized in mitochondria. The stability of Fc after permeabilization indicates no substantial mitochondrial fura-2 leakage over 30 min.
To confirm that the measured fura-2 fluorescence reflect [Ca2+]mito, we applied the protonophore FCCP (2.5 μM) to dissipate the mitochondrial membrane potential (Ψm) and therefore the driving force for the mitochondrial Ca2+ uniporter (the main mitochondrial Ca2+ influx pathway). Figure 2B shows that FCCP abolished the rise in fura-2 ratio induced by raising [Ca2+]i to 800 nM (in Na+-free solution). This demonstrates that the fura-2 fluorescence changes under our conditions depend on an intact Ψm and are therefore a valid measure of [Ca2+]mito.
Since fluorescent indicator properties can depend on environment [17] we performed in situ calibration of mitochondrially compartmentalized fura-2 in rat ventricular myocytes (Fig. 2C–D). Myocytes were equilibrated with solutions of different [Ca2+] (0–95 μM containing Ca2+ ionophore ionomycin (3 μM), the protonophore FCCP (10 μM) to collapse Ψm, and oligomycin (20 μg/mL) to inhibit the F1FoATP-synthase). We found an in situ Kd of 170 nM in this experiment and results were very consistent among cells (Kd = 170±0.3 nM, n = 3).
Steady-state dependence of [Ca2+]mito on cytosolic [Ca2+]
Next, we determined the steady-state dependence of [Ca2+]mito on the [Ca2+]i in the presence of 10 mM [Na+]i with Ca2+ buffered by 5 mM EGTA. This EGTA concentration allows the precise control of [Ca2+]i and prevents spontaneous SR Ca2+ releases (which are examined below). The internal solution contained no ATP or ADP and contained 15 mM BDM to avoid cell contraction at high [Ca2+]i.
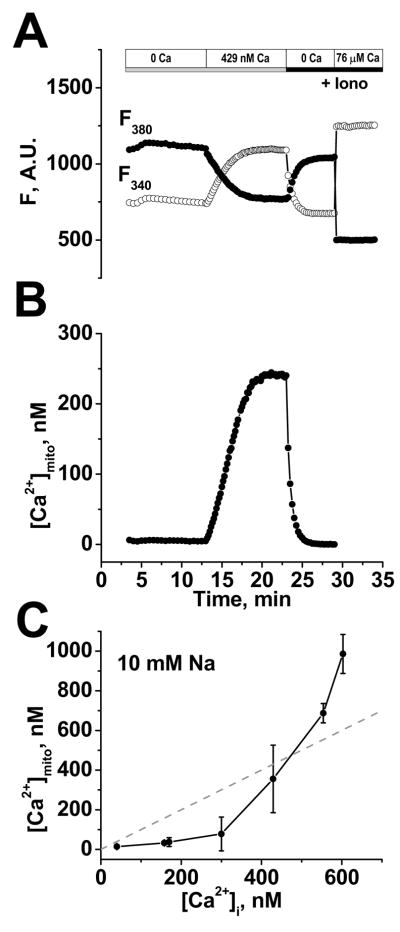
Fig. 3A shows background corrected F340 and F380 immediately after permeabili-zation (at 3 min in Fig. 3A), in Ca2+-free internal solution (10 min) followed by 10 min at 429 nM [Ca2+]i. After reaching steady-state, a two point calibration was performed using Ca2+-free and high [Ca2+]i solution (50–100 μM) with ionomycin (3 μM), oligomycin (20 μg/mL), and FCCP (10 μM) to determine Rmin, Rmax, F380-max and F380-min. Using these and the measured in situ Kd, the fura-2 fluorescence was transformed into [Ca2+]mito (Fig. 3B; using the equation in Fig. 2D legend). Figure 3C shows the steady-state [Ca2+]mito vs. [Ca2+]i relationship. Below an apparent threshold of ~300 nM [Ca2+]i, [Ca2+]mito had a very shallow dependence on [Ca2+]i and increased only very little as [Ca2+]i increased. At cytosolic [Ca2+] > ~300 nM, [Ca2+]mito showed a steep dependence on [Ca2+]i and exceeded [Ca2+]i for [Ca2+]i > 500 nM.
FIGURE 3. Steady-state dependence of [Ca2+]mito on [Ca2+]i.
A, example of background-corrected raw F340 and F380 380 nm signals, where [Ca2+]i was raised from 0 to 429 nM, with Rmin and Rmax measured at the end using ionophores (Iono). B, calibrated [Ca2+]mito calculated from A. C, Steady-state dependence of [Ca2+]mito on [Ca2+]i in the presence of 10 mM Na+ (Mean ±SD, n=3–7 myocytes).
Mitochondrial [Ca2+] uptake during spontaneous SR Ca2+ release
While these steady-state measurements provide a solid foundation, we next sought to test how [Ca2+]mito changes during phasic SR Ca2+ release events which may better mimic mitochondrial Ca2+ regulation in vivo. By reducing [EGTA] to 50 μM and with [Ca2+]i =150 nM (and physiological internal solution) spontaneous SR Ca2+ release events (Ca2+ waves) occurred at a regular frequency of 5–15 min−1.
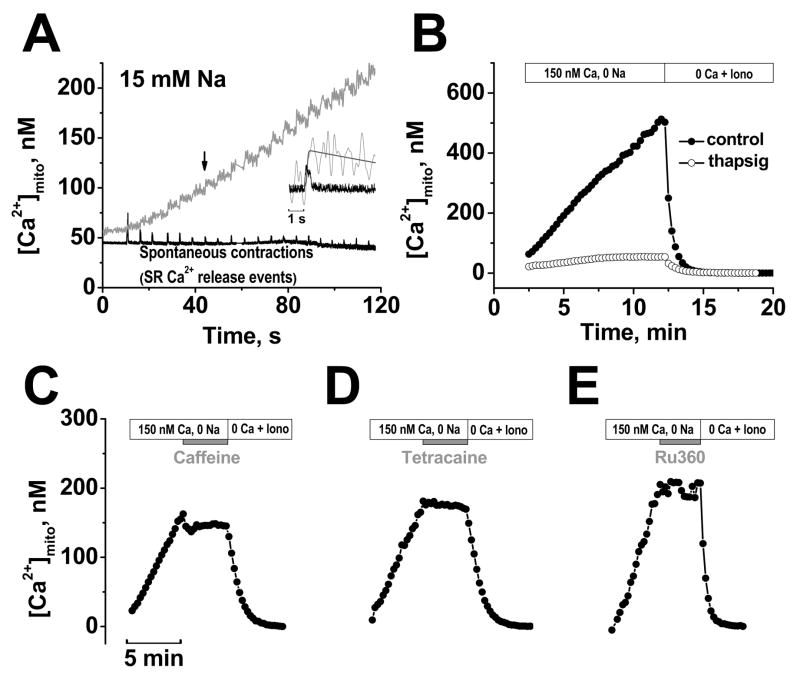
Fig. 4A shows a typical continuous [Ca2+]mito recording (gray trace) and cell contraction (black trace) starting after permeabilization. For this experiment, [Na+]i was 15 mM and 40 μM Cytochalasin-D was added to reduce, but not abolish cell contraction during cytosolic Ca2+ waves. The small residual contractions were used to measure SR Ca2+ wave occurrence. The inset in Fig. 4A shows a [Ca2+]mito transient with curve-fit and cell contraction. Because the fura-2 loaded cardiomyocytes were incubated in Ca2+-free solution before permeabilization and permeabilized in Ca2+-free internal solution, [Ca2+]mito was very low at the beginning of the measurement. [Ca2+]mito was stable at ~57nM during the first 10 sec before the first Ca2+ wave occurred. The first 3 contractions after permeabilization in Fig. 4A were associated with step-wise increases in [Ca2+]mito without substantial mitochondrial Ca2+ extrusion. Only in subsequent Ca2+ transients did mitochondrial Ca2+ extrusion become evident (as a declining phase of [Ca2+]mito). [Ca2+]mito gradually increased to ~110 nM after 8 waves and to 216 nM after 20 waves. Control experiments using TMRM to assess Ψm, showed no appreciable change in Ψm during the phasic or integrated rise in [Ca2+]mito.
FIGURE 4. [Ca2+]mito during cyclical SR Ca2+ release.
A, Simultaneous recording of [Ca2+]mito (grey) and contractions (black) in the presence of 150 nM Ca2+ and 15 mM Na+. 40 μM cytochalasin D was included to limit contraction. Inset shows expanded superimposed traces for the 7th contraction (traces smoothed by fast Fourier transform). B, [Ca2+]mito under control conditions and after pretreated with 1 μM thapsigargin for 30 min. Mitochondrial Ca2+ uptake was halted by acute application of 10 mM caffeine (C), 2 mM tetracaine (D), or 1 μM Ru360 (E). Each experiment ended with Ca2+-free solution with ionophores (Iono) to start calibration.
To test whether SR Ca2+ release was responsible for this dynamic [Ca2+]mito uptake we inhibited SR function (Fig. 4B–D). To limit cellular photo damage and allow long-term [Ca2+]mito measurements over 20 min, we measured [Ca2+]mito every 15 s for a duration of 2 s (each point in Fig. 4B–E is average [Ca2+]mito during the 2 s).
Fig. 4B shows that blocking SR Ca2+ uptake by pretreatment with the specific SR Ca2+ATPase (SERCA) inhibitor thapsigargin (1 μM for 30 min before permeabilization to deplete SR Ca2+) nearly abolished the rise in [Ca2+]mito. Under these conditions no spontaneous SR Ca2+ release events occurred and the small residual rise in [Ca2+]mito to ~54 nM is explained by the slow steady-state equilibration at the ambient 150 nM [Ca2+]i (in this case with [Na+]i=0 which inhibits NCXm). Figure 4C–D shows that either acute SR Ca2+ depletion with 10 mM caffeine or inhibition of SR Ca2+ release by 2 mM tetracaine terminated the [Ca2+]mito rise abruptly. Notably, in both cases Ca2+ waves ceased, but [Ca2+]mito failed to decline in the Na+-free solution ([Ca2+]mito declines less than 5 nM/min, n=3), consistent with a dominant role of NCXm in mitochondrial Ca2+ extrusion. Selective blockade of the mitochondrial uniporter with Ru360 (Fig. 4E) also stopped the rise in [Ca2+]mito, although spontaneous cytosolic Ca2+ waves continued.
These results demonstrate that the observed mitochondrial Ca2+ uptake occurs as a direct consequence of SR Ca2+ release (we maintain the structural organization of the cardiac myocyte regarding the crosstalk between the SR and mitochondria), and that the major Ca2+ influx pathway under these conditions is the mitochondrial Ca2+ uniporter.
Quantitative analysis of the rise of [Ca2+]mito per beat
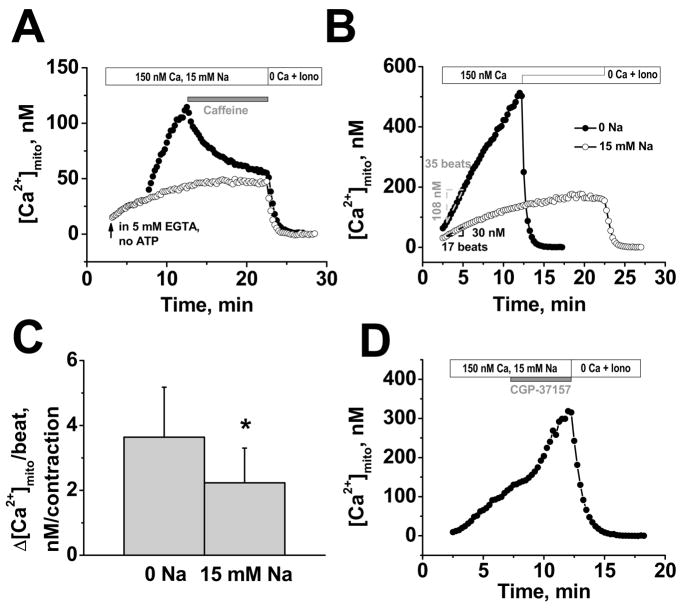
In Figures 4C and 4D [Ca2+]mito failed to decline in Na+-free solution after Ca2+ transients were blocked by caffeine or tetracaine. Figure 5A shows that with 15 mM [Na+]i, caffeine still abruptly stopped the rise in [Ca2+]mito (filled circles), but [Ca2+]mito then declined exponentially (τ=3.4 min) to reach the same level as seen in the steady-state measurement protocol (with the same [Na+]i, open circles). This shows that mitochondrial Ca2+ is removed effectively via a Na+-dependent pathway when mitochon-drial Ca2+ uptake is stopped.
FIGURE 5. Calibrated rise in [Ca2+]mito per beat and [Na+]i-dependence.
A, 10 mM caffeine stops [Ca2+]mito, but with 15 mM Na+ [Ca2+]mito declines (filled symbols); mitochondrial Ca2+ uptake in presence of 5 mM EGTA (empty symbols). B, examples of [Ca2+]mito increase per contraction (±15 mM Na+). C, Average increase of [Ca2+]mito per contraction (±15 mM Na+). D, Blockade of NCXm (5 μM CGP-37157) increases rate of [Ca2+]mito rise in presence of 15 mM Na+. Each experiment ended with Ca2+-free solution with ionophores (Iono) to start calibration.
Figure 5B shows representative experiments monitoring the rise in [Ca2+]mito and the number of spontaneous contractions (±15 mM [Na+]i). In the absence of [Na+]i the [Ca2+]mito rose linearly until the calibration was initiated. In contrast, with 15 mM [Na+]i, the [Ca2+]mito increased linearly initially, but then reached a steady-state within ~15 min. This demonstrates that Na+-dependent [Ca2+]mito removal is required to allow [Ca2+]mito to reach a steady-state during regular SR Ca2+ release. The rise in [Ca2+]mito per SR Ca2+ release (Δ[Ca2+]mito/wave) can be calculated from the linear part of the uptake measurements. The rate of [Ca2+]mito rise in the absence and presence of Na+ during the indicated 35 and 17 beats in Fig. 5B was 3.1 and 1.8 nM/wave, respectively. Mean data in Fig. 5C show this rise in [Ca2+]mito/wave to be 3.6±1.5 nM (n=16) and 2.2±1.1 nM (n=19) in the absence and presence of 15 mM [Na+]i, respectively.
Figure 5D shows that abrupt block of the NCXm with 5 μM CGP-37157 during the rising phase of [Ca2+]mito with 15 mM [Na+]i increased the rate of rise of [Ca2+]mito per wave. The mean acceleration induced by CGP-37157 in 4 cells was 74%, similar to the 63% higher rate of [Ca2+]mito rise per wave in Na+-free solution in Fig. 5C.
Spatially resolved [Ca2+]mito measurements during SR Ca2+ release
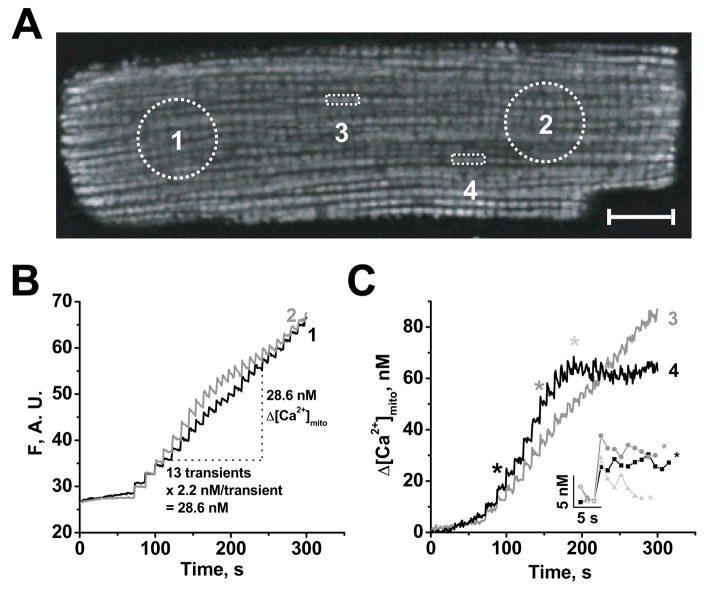
The above calibrated [Ca2+]mito measurements with fura-2 and measures of [Ca2+]mito rise per Ca2+ wave allows us to extend these studies with additional spatio-temporal detail using confocal microscopy and the cationic fluorescent Ca2+ indicator rhod-2 (which is less readily calibrated). Figure 6A shows a rhod-2 loaded cardiomyocyte 5 min after permeabilization after [Ca2+]mito has risen by ~50 nM (see Fig. 6B). The movie (in Online Supplement) shows the pulsatile emergence of the clear mitochondrial pattern as [Ca2+]mito and rhod-2 fluorescence rise. We focused our analysis on intermyofibrillar mitochondria because some subsarcolemmal mitochondria were less consistent.
FIGURE 6. Spatially resolved [Ca2+]mito during SR Ca2+ release.
A, confocal image of permeabilized rat ventricular myocyte loaded with 10 μM rhod-2 AM, after 5 min of spontaneous Ca2+ transients in 15 mM Na+ (with 80 μM cytochalasin D) with 4 regions of interest (ROI) indicated. Scale bar is equal 10 μm. B-C, Time courses of [Ca2+]mito in 4 ROIs, either as fluorescence (F in arbitrary units, B) or calibrated Δ[Ca2+]mit (C) using averaged Δ[Ca2+]mito/beat from Fig. 5C (see B and text). C, ROI 3 and 4 contain 3 mitochondria and inset shows the indicated [Ca2+]mito transients expanded.
Figure 6B shows mitochondrial fluorescence during Ca2+ waves (5–6 min−1) from two large regions of interest (ROI1 and 2 in Fig. 6A) at opposite ends of the cell. As in Fig. 4A, [Ca2+]mito increased during the first transients in a step-like manner without appreciable [Ca2+]mito decay. The rhod-2 fluorescence changes in ROI 1 and ROI 2 were very similar (and like the whole cell), suggesting that [Ca2+]mito is relatively homogeneous when a large fraction of the cellular mitochondria is compared. Additionally, the [Ca2+]mito peaks in ROI 1 and 2 were within 1 s of each other, indicating relatively homogeneous cytosolic Ca2+ changes.
Using the [Ca2+]mito gain per Ca2+ wave measured with fura-2 (2.2 nM/wave; Fig. 5C), we infer that the [Ca2+]mito rise for the 13 transients indicated was 28.6 nM for both ROI 1 and ROI 2. This indicates that one fluorescence unit reflects a Δ[Ca2+]mito of ~1.44 nM [Ca2+]mito. Next, we used this approximation to estimate [Ca2+]mito changes in two smaller ROIs (Fig. 6C, ROI 3 and 4 shown in Fig. 6A). These smaller ROIs (with only 3 mitochondria) differed slightly. ROI 3 showed a linear increase much like ROI 1 and 2, whereas [Ca2+]mito in ROI 4 reached a plateau after gaining ~60 nM in 3 min. The upstroke amplitudes of individual [Ca2+]mito transients in the inset of Fig. 6C were ~10–12 nM (for the 3 indicated transients). These results suggest that individual mitochondria or small clusters of mitochondria can respond differently to a homogenous cytosolic Ca2+ transient and that the amplitudes of [Ca2+]mito transients are much smaller (~100x) than the amplitude of bulk cytosolic Ca2+ transients.
Kinetics of [Ca2+]mito changes during SR Ca2+ release
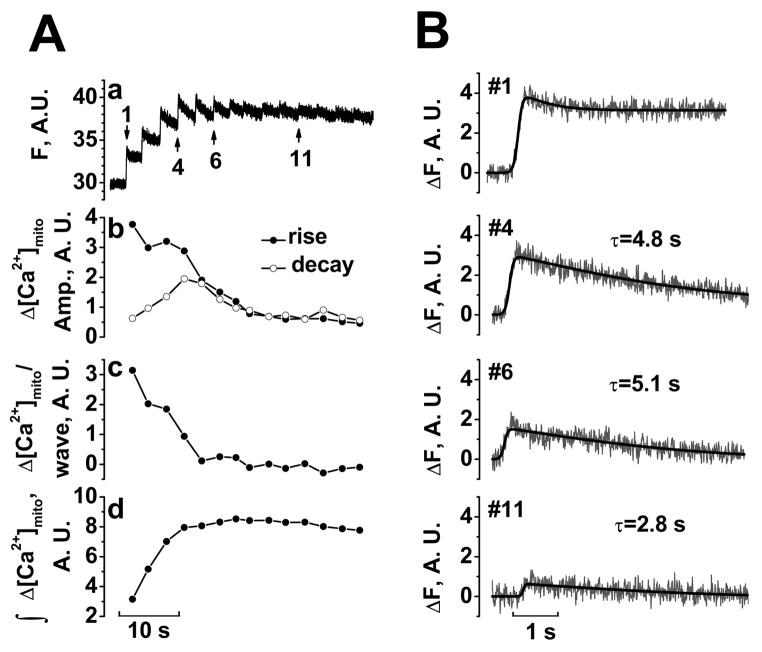
To enhance temporal resolution, we used line-scan confocal microscopy along a 40.5 μm line (~20 mitochondria). Figure 7A shows [Ca2+]mito which rose to a steady-state within a small number of Ca2+ waves (expanded time scale in Fig. 7B; typical of 5 other cells). Figure 7Ab shows the [Ca2+]mito rise and fall amplitudes for each beat. The first [Ca2+]mito transient had a large upstroke and small decline amplitude, leading to a large rise in [Ca2+]mito with little decay in [Ca2+]mito (Fig. 7B#1). As mitochondria gained Ca2+ (Fig. 7Ad), upstroke amplitudes decreased and decline amplitudes increased until influx and efflux balanced (Fig. 7B#6 and #11) and [Ca2+]mito stopped increasing. The time constant of [Ca2+]mito decay was typically 2.5–5 s (Fig. 7B). At steady-state, [Ca2+]mito transients were very small. Thus, mitochondria can rapidly follow cytosolic [Ca2+] changes when [Ca2+]mito is low, but during steady-state, [Ca2+]mito does not change appreciably in response to cytosolic Ca2+ transients.
FIGURE 7. Mitochondrial [Ca2+] balance during SR Ca2+ release.
Aa, [Ca2+]mito measured in line-scan images in permeabilized myocyte loaded with 5 μM rhod-2 AM in 15 mM Na+ (with 80 μM cytochalasin D; subjected to 5 point smoothing). Ab, Amplitudes of rise (filled symbols) and decay phase (empty symbols). Ac, Net gain in [Ca2+]mito per wave. Ad, Integral of change in [Ca2+]mito. B, Expanded and curve fitting for the transients indicated in A.
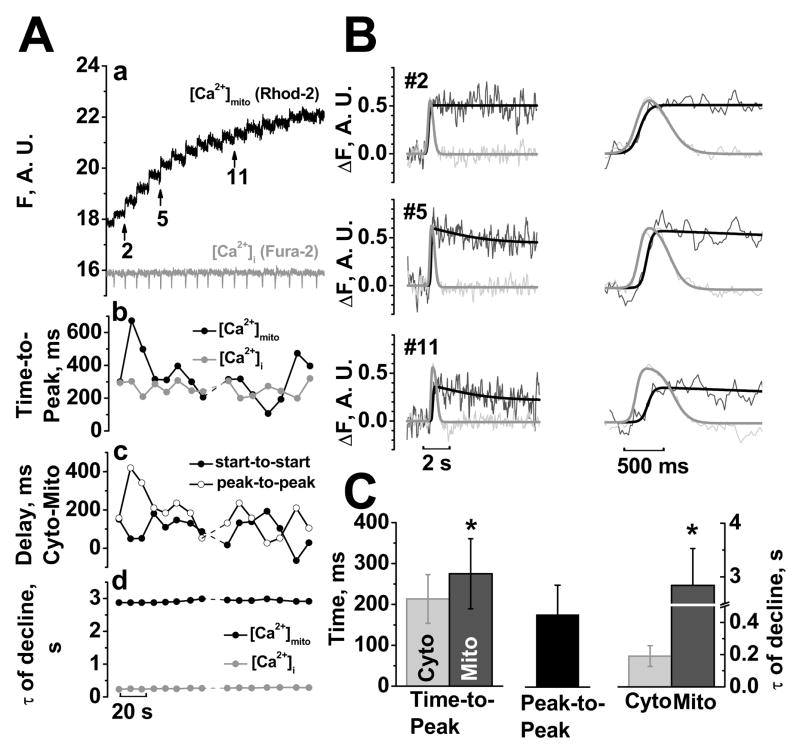
In the next experiments, we compared the kinetics of [Ca2+]mito and [Ca2+]i transients, simultaneously measured with mitochondrial rhod-2 and cytosolic fura-2 using the confocal line-scan mode (fura-2 salt was in the cytosolic solution). Figure 8A shows a typical experiment starting 40 s after permeabilization (with expanded traces in Fig. 8B with fura-2 signal inverted). The [Ca2+]i signals in Fig. 8 were not calibrated, but parallel calibrated experiments with the same protocol showed Ca transients of 1.3–2.5 μM (i.e. typical of spontaneous waves in intact myocytes). Time-to-peak for [Ca2+]mito and [Ca2+]i transients is shown in Fig. 8Ab (note that this is the rise time for each trace independently). The delay between the [Ca2+]i and [Ca2+]mito peaks (peak-to-peak) and start-to-start delays are shown in Fig. 8Ac.
FIGURE 8. Kinetics of [Ca2+]mito vs. [Ca2+]i signals.
Aa, [Ca2+]mito and [Ca2+]i measured in line-scan images in permeabilized myocyte with mitochondrial rhod-2 and 5 μM cytosolic fura-2 salt (15 mM Na+, 80 μM cytochalasin D, 5 point smoothing). Ab, Time-to-Peak (rise time for either [Ca2+]mito or [Ca2+]i). Ac, Delay of [Ca2+]mito after [Ca2+]i as start-to-start and peak-to-peak, Ad, time constant τof decline. B, Curve fitting and expanded mitochondrial (black) and cytosolic (grey) transients indicated in Aa. C, Difference in mitochondrial and cytosolic kinetics (n=3 cells, 25 transients).
Figure 8B shows that [Ca2+]i transients preceded [Ca2+]mito transients. On average, [Ca2+]i started to rise 111±60 ms before [Ca2+]mito. [Ca2+]i rose to peak in 213±59 ms, whereas [Ca2+]mito rose slightly slower (in 275±86 ms, p<0.05, n =25 transients, 3 cells, Fig. 8C). Due to the later start and the slower upstroke, [Ca2+]mito peaked 177±72 ms after [Ca2+]i (Fig. 8C). [Ca2+]mito decline was dramatically slower than [Ca2+]i decline (time constant were 2.8±0.7 s vs. 0.19±0.06 s, respectively, Fig. 8C). Additionally, the time constant of [Ca2+]mito decline was relatively constant from transient-to-transient suggesting that extrusion was not activated by increasing [Ca2+]mito (Fig. 8Ad).
Discussion
Cardiac mitochondrial Ca2+ uptake may be important in controlling energy supply-demand balance (via activation of mitochondrial dehydrogenases), protecting myocytes from transient Ca2+ overload and mediating cell death pathways (necrosis or apoptosis) [14, 18–20]. Mitochondrial Ca2+ uptake occurs in response to elevated [Ca2+]i (which in heart occurs transiently with each beat) and it is increasingly clear that some Ca2+ enters the mitochondria with each heartbeat [21–25]. However, most prior studies of [Ca2+]mito in cardiac myocytes lack calibration, and in some cases contamination of the [Ca2+]mito signal by cytosolic indicator has not been completely ruled out. These aspects limit the quantitative understanding of mitochondrial Ca2+ regulation, and motivated the present study. Here we show carefully calibrated [Ca2+]mito signals in permeabilized cardiac myocytes both at rest (where we characterized the steady-state [Ca2+]mito vs. [Ca2+]i relationship) and during regular SR Ca2+ release events. We find that the largest rise in [Ca2+]mito during a local SR Ca2+ release is ~10 nM (e.g. when [Ca2+]mito begins very low), and the rise occurs rapidly (275 ms time to peak) within a 100–200 ms delay of the rise in [Ca2+]i. However, the [Ca2+]mito decline is ten times slower than that of [Ca2+]i (2.8 vs. 0.19 s time constant). The slow [Ca2+]mito decline between beats leads to integration of [Ca2+]mito (even at the low frequency of spontaneous Ca2+ waves here) to a level many times higher than the amplitude of a single [Ca2+]mito transient. While we acknowledge that these myocytes are not in a truly physiological setting, these results provide useful novel quantitative data to help understanding mitochondrial Ca2+ balance in cardiac myocytes.
Limitations
We have measured [Ca2+]mito in quantitative detail in a relatively physiological mitochondrial environment using saponin-permeabilized myocytes, selective mitochon-drial ratiometric Ca2+ indicator and intrinsic spontaneous large SR Ca2+ release events [26–28]. However, the control gained by permeabilization makes the situation less physiological in several ways. First, small diffusible molecules may be lost by the myocyte, and we cannot rule out that this could alter regulation of mitochondrial Ca2+ transport mechanisms (although the impact of this is unknown). Second, it is possible that the saponin exposure changes the physical geometry between the SR Ca2+ release junctions and the mitochondria. While we have no reason to expect this, it also cannot be ruled out. Third, and perhaps most important, we are limited in the frequency of SR Ca2+ release events, to that which occurs spontaneously (up to ~0.2 Hz). This is much lower than the frequency of the normal heartbeat (even at our sub-physiological 23°C). At higher frequencies, we would expect more dramatic [Ca2+]mito integration (i.e. [Ca2+]mito would rise higher at steady-state), but we do not expect that would increase the transient Δ[Ca2+]mito associated with a single SR Ca2+ release. Indeed, the phasic components might be expected to be smaller at higher [Ca2+]mito in the steady-state (as in cases here as the steady-state is approached in Fig. 7 and 8). Fourth, the spontaneous SR Ca2+ releases occur as propagated waves (which travel at ~100 μm/s) through the cytosol. While this will spread out the time course of [Ca2+]i and [Ca2+]mito kinetics, it should do so in a parallel manner, such that relative comparisons are still well justified. Furthermore, our most critical kinetic analysis is done in local regions containing 3–30 mitochondria, where this concern is less of a limitation. One might also wonder if the local SR Ca2+ release during these waves may be less than during physiological Ca2+ transients. However, these events occur only at high SR Ca2+ loads, and if anything are likely to be higher at the local level than the normal physiological Ca2+ transient [29]. On the other hand, using permeabilized cells allows the measurement of purely mitochondrially derived fluorescence without having to deal with potential problems associated with Mn2+-quench (e.g. inhibition of the mitochondrial Ca2+ transport or inhibition of oxidative phosphorylation by Mn2+) [3, 30], an approach which has been used to minimize cytosolic fluorescence [31, 32]. Thus, while trade-offs are required for the quantitative confidence we have in our results, this work is highly relevant for understanding physiological mitochondrial Ca2+ regulation.
Quantitative changes in [Ca2+]mito
Our experiments start from Ca2+ depleted mitochondria, because of pre-incubation in low [Ca2+]o prior to permeabilization and permeabilization in Ca2+-free solution. Starting from this low level, we see the largest increases of [Ca2+]mito during the first several Ca2+ transients. Note that the [Ca2+]i signals usually do not change appreciably (see Fig. 8A), so the change in [Ca2+]mito transients is not secondary to [Ca2+]i transient differences. The first few [Ca2+]mito transients have the largest rising phases and often exhibit little decline (consistent with little Ca2+ efflux at very low [Ca2+]mito). Indeed, some of the slight decline in [Ca2+]mito in the first transient in Fig. 8 might be due to buffering of [Ca2+]mito. Notably, the rising phase of [Ca2+]mito becomes much smaller (almost 10 times, Fig. 8Ab) as integrated [Ca2+]mito approaches steady-state. This might be partly due to faster Ca2+ extrusion as [Ca2+]mito rises. However, because the Ca2+ efflux kinetics are so slow (τ=2.8 s even at higher [Ca2+]mito, Fig. 8Ad), speeding efflux by 2-fold should only reduce amplitude <10%. Thus the reduced amplitude may also reflect reduced Ca2+ influx (although the mechanism is not obvious). We also showed that NCXm is required for Ca2+ efflux from mitochondria. [Na+]i was held constant here at 15 mM, but when [Na+]i changes physiologically this would be expected to alter the steady-state [Ca2+]mito and rate of [Ca2+]mito decline [23, 33]. In any event, at steady-state (where [Ca2+]mito stops rising) influx and efflux must be the same and both appear to be much lower than the maximal rising phase of [Ca2+]mito when influx starts.
The maximal rise of [Ca2+]mito during a single SR Ca2+ release is ~10 nM (Fig. 6C) with typical rise values of 2–4 nM (Fig. 5D). If we assume that intra-mitochondrial Ca2+ buffering is 100:1 (as in cytosol), and use the highest value (10 nM) this would translate to 1 μM rise in total mitochondrial Ca2+ content, which corresponds to removal of 0.5 μmol/l cytosol. Surprisingly, this agrees well with Bassani et al. estimates of the quantitative contribution of mitochondrial Ca2+ uptake to removal of cytosolic Ca2+ during E-C coupling by analysis of [Ca2+]i decline by different Ca2+ transporters in intact rat ventricular myocytes [13]. They found that ~75 μmol/l cytosol of Ca2+ were added and removed to the cytosol at a normal Ca2+ transient, and that about 1% was removed by the combination of mitochondria plus sarcolemmal Ca2+-ATPase (0.8 μmol/l cytosol) which contribute about equally with each other [34]. Given the completely different methods and limitations, the quantitative agreement encourages us to think we are close to correct.
Local vs. global [Ca2+]i drives mitochondrial Ca2+ uptake
Several studies have suggested that mitochondria are in close physical proximity to the sites of SR Ca2+ release and consequently that SR (or endoplasmic reticulum) Ca2+ release has preferential access to drive mitochondrial Ca2+ uptake [7, 35–39]. Indeed, Sharma et al. [36] showed that 1 mM BAPTA (a fast Ca2+ buffer), which reduced the caffeine-induced rise in [Ca2+]i by 90% in permeabilized rat myocytes, only decreased the mitochondrial rhod-2 signal by 23%. Our results are consistent with this general idea and provide some quantitative context in terms of [Ca2+]mito. Note that when we abruptly switch bath [Ca2+] from 0 to 429 nM (heavy [Ca2+]i buffering; Fig. 3B) or pretreat myocyte with thapsigargin (Fig. 4B) the rate of [Ca2+]mito rise is linear over several minutes (0.1–0.7 nM/s). This is much slower than during an SR Ca2+ release 36 nM/s (10 nM/0.275 s), where global [Ca2+]i is only transiently raised to a slightly higher level (0.5–1 μM [Ca2+]i). This suggests that phasic mitochondrial Ca2+ influx must be driven in large part by the higher local (vs. global) [Ca2+]i during SR Ca2+ release. This makes sense with the high K0.5 for [Ca2+]i of the mCU [3], which is required for the observed mitochondrial Ca2+ uptake seen here. We can look at this another way. The 20 Ca2+ waves during the 2 min in Fig. 4A only raise average [Ca2+]i from 150 to 200 nM (assuming each has peak [Ca2+]i ~1 μM with kinetics as in Fig. 8). Based on the data in Fig. 3C and with thapsigargin in Fig. 4B, this small rise in global [Ca2+]i alone could not increase [Ca2+]mito to 200 nM. So the SR Ca release events are clearly important drivers of [Ca2+]mito rise.
Two points should be borne in mind here. First, while high local SR Ca2+ release accelerates mitochondrial Ca2+ uptake, the total amount is still small compared to SR Ca2+ uptake or Na+/Ca2+ exchange in cardiac myocytes [13]. Second, while one end of a large mitochondrion may be close to the site of SR Ca2+ release (e.g. 37–270 nm; [36]) the other end of a typical intramyofibrillar mitochondrion is ~1 μm away, at the middle of the sarcomere. Considering the overall mitochondrial geometry, the average place on the mitochondrion within the sarcomere probably senses a similar local [Ca2+]i as does the cytosol. Thus, there may be preferential local Ca2+ influx on the end of a mitochondrion that is very close to an SR Ca2+ release unit, but this may be diluted and buffered strongly in the whole mitochondrion. Sub-mitochondrial [Ca2+]mito gradients might even exist, at least transiently.
Phasic vs. integrative signaling
Our [Ca2+]mito dependence on [Ca2+]i in highly buffered solutions agrees fairly well with and validates the classical studies in isolated mitochondria [40] and of Miyata et al. [31] who used Mn2+ to quench cytosolic indo-1 during slow Ca2+ transients mediated by Na+/Ca2+ exchange (rather than SR Ca2+ release; compare our Fig. 3C with their Fig. 7B). Thus, Fig. 3C represents well the static quasi-equilibrium relationship. It seems clear that Fig. 3C is a good representation of the static quasi-equilibrium relationship. While helpful, this alone does not inform the question of dynamic [Ca2+]mito regulation during SR Ca2+ release.
Experimental data in favor of both “slow integrating” and “phasic” theories of [Ca2+]mito changes during Ca transients were summarized by Dedkova and Blatter [8]. Among recent studies, rapid switches in [Ca2+]i simulating Ca2+ transients in permeabilized cat ventricular myocytes by Sedova et al. [12] supports a “slow integrating” model, whereas in guinea-pig cardiomyocytes Maack et al. [23] observed rapid mitochondrial Ca2+ transients during every cytosolic Ca2+ transient elicited by voltage clamp pulses to initiate SR Ca2+ release. While these were both uncalibrated [Ca2+]mito measurements they indicate extremes. Sometimes phasic [Ca2+]mito transients have not been detected [12, 31, 32]. This could be either because the very small [Ca2+]mito transients were simply below the detection limit, or because local SR Ca release events were not used (and may be essential as above). There may also be species differences in resting [Na+]i or mitochondrial Ca2+ transport, such that beat-to-beat changes in [Ca2+]mito have been seen in guinea-pig [41, 42], but not in rat [22, 43] and hamster [44, 45]. The apparently large [Ca2+]mito transients observed by Maack et al. [23] in guinea-pig myocytes (which seem to even limit [Ca2+]i transients) are convincing, but seem to require PKA activation and strong cellular Ca2+ loading. We were unable to demonstrate substantially larger [Ca2+]mito transients here by including cAMP to activate PKA (not shown).
Our work suggests that both phasic and integrative changes in [Ca2+]mito occur, and we have added some quantitative framework to better understand the amplitude and kinetics of these components of [Ca2+]mito control.
Supplementary Material
Acknowledgments
This work was supported by National Institute of Health Grants (R37-HL30077, P01-HL80101).
Abbreviations
- SR
Sarcoplasmic reticulum
- [Ca2+]mito
Intra-mitochondrial free Ca2+ concentration
- [Ca2+]i
Cytosolic Ca2+ concentration
- mCU
Mitochondrial Ca2+ uniporter
- RaM
Rapide mode of Ca2+ uptake
- NCXm
Mitochondrial Na+/Ca2+-exchanger
- [Na+]i
Cytosolic Na+ concentration
- EC
Excitation-contraction
- RT
room temperature
- Fc
Ca2+-insensitive, isosbestic signal
Footnotes
Publisher's Disclaimer: This is a PDF file of an unedited manuscript that has been accepted for publication. As a service to our customers we are providing this early version of the manuscript. The manuscript will undergo copyediting, typesetting, and review of the resulting proof before it is published in its final citable form. Please note that during the production process errors may be discovered which could affect the content, and all legal disclaimers that apply to the journal pertain.
References
- 1.Denton RM, McCormack JG. Ca2+ as a second messenger within mitochondria of the heart and other tissues. Annu Rev Physiol. 1990;52:451–66. doi: 10.1146/annurev.ph.52.030190.002315. [DOI] [PubMed] [Google Scholar]
- 2.Bers DM. Calcium cycling and signaling in cardiac myocytes. Annu Rev Physiol. 2008;70:23–49. doi: 10.1146/annurev.physiol.70.113006.100455. [DOI] [PubMed] [Google Scholar]
- 3.Gunter TE, Pfeiffer DR. Mechanisms by which mitochondria transport calcium. Am J Physiol. 1990 May;258(5 Pt 1):C755–86. doi: 10.1152/ajpcell.1990.258.5.C755. [DOI] [PubMed] [Google Scholar]
- 4.Kirichok Y, Krapivinsky G, Clapham DE. The mitochondrial calcium uniporter is a highly selective ion channel. Nature. 2004 Jan 22;427(6972):360–4. doi: 10.1038/nature02246. [DOI] [PubMed] [Google Scholar]
- 5.Buntinas L, Gunter KK, Sparagna GC, Gunter TE. The rapid mode of calcium uptake into heart mitochondria (RaM): comparison to RaM in liver mitochondria. Biochim Biophys Acta. 2001 Apr 2;1504(2–3):248–61. doi: 10.1016/s0005-2728(00)00254-1. [DOI] [PubMed] [Google Scholar]
- 6.Beutner G, Sharma VK, Lin L, Ryu SY, Dirksen RT, Sheu SS. Type 1 ryanodine receptor in cardiac mitochondria: transducer of excitation-metabolism coupling. Biochim Biophys Acta. 2005 Nov 10;1717(1):1–10. doi: 10.1016/j.bbamem.2005.09.016. [DOI] [PubMed] [Google Scholar]
- 7.Szalai G, Csordas G, Hantash BM, Thomas AP, Hajnoczky G. Calcium signal transmission between ryanodine receptors and mitochondria. J Biol Chem. 2000 May 19;275(20):15305–13. doi: 10.1074/jbc.275.20.15305. [DOI] [PubMed] [Google Scholar]
- 8.Dedkova EN, Blatter LA. Mitochondrial Ca2+ and the heart. Cell Calcium. 2008 Jul;44(1):77–91. doi: 10.1016/j.ceca.2007.11.002. [DOI] [PubMed] [Google Scholar]
- 9.Murphy E, Perlman M, London RE, Steenbergen C. Amiloride delays the ischemia-induced rise in cytosolic free calcium. Circ Res. 1991 May;68(5):1250–8. doi: 10.1161/01.res.68.5.1250. [DOI] [PubMed] [Google Scholar]
- 10.Pogwizd SM, Sipido KR, Verdonck F, Bers DM. Intracellular Na in animal models of hypertrophy and heart failure: contractile function and arrhythmogenesis. Cardiovasc Res. 2003 Mar 15;57(4):887–96. doi: 10.1016/s0008-6363(02)00735-6. [DOI] [PubMed] [Google Scholar]
- 11.Rizzuto R, Bernardi P, Favaron M, Azzone GF. Pathways for Ca2+ efflux in heart and liver mitochondria. Biochem J. 1987 Sep 1;246(2):271–7. doi: 10.1042/bj2460271. [DOI] [PMC free article] [PubMed] [Google Scholar]
- 12.Sedova M, Dedkova EN, Blatter LA. Integration of rapid cytosolic Ca2+ signals by mitochondria in cat ventricular myocytes. Am J Physiol Cell Physiol. 2006 Nov;291(5):C840–50. doi: 10.1152/ajpcell.00619.2005. [DOI] [PubMed] [Google Scholar]
- 13.Bassani JW, Bassani RA, Bers DM. Relaxation in rabbit and rat cardiac cells: species-dependent differences in cellular mechanisms. J Physiol. 1994 Apr 15;476(2):279–93. doi: 10.1113/jphysiol.1994.sp020130. [DOI] [PMC free article] [PubMed] [Google Scholar]
- 14.Maack C, O’Rourke B. Excitation-contraction coupling and mitochondrial energetics. Basic Res Cardiol. 2007 Sep;102(5):369–92. doi: 10.1007/s00395-007-0666-z. [DOI] [PMC free article] [PubMed] [Google Scholar]
- 15.Huser J, Blatter LA, Sheu SS. Mitochondrial calcium in heart cells: beat-to-beat oscillations or slow integration of cytosolic transients? J Bioenerg Biomembr. 2000 Feb;32(1):27–33. doi: 10.1023/a:1005556227425. [DOI] [PubMed] [Google Scholar]
- 16.Zhou Z, Neher E. Mobile and immobile calcium buffers in bovine adrenal chromaffin cells. J Physiol. 1993 Sep;469:245–73. doi: 10.1113/jphysiol.1993.sp019813. [DOI] [PMC free article] [PubMed] [Google Scholar]
- 17.Uto A, Arai H, Ogawa Y. Reassessment of Fura-2 and the ratio method for determination of intracellular Ca2+ concentrations. Cell Calcium. 1991 Jan;12(1):29–37. doi: 10.1016/0143-4160(91)90082-p. [DOI] [PubMed] [Google Scholar]
- 18.Pacher P, Csordas G, Hajnoczky G. Mitochondrial ca(2+) signaling and cardiac apoptosis. Biol Signals Recept. 2001 May-Aug;10(3–4):200–23. doi: 10.1159/000046888. [DOI] [PubMed] [Google Scholar]
- 19.Gunter TE, Gunter KK, Sheu SS, Gavin CE. Mitochondrial calcium transport: physiological and pathological relevance. Am J Physiol. 1994 Aug;267(2 Pt 1):C313–39. doi: 10.1152/ajpcell.1994.267.2.C313. [DOI] [PubMed] [Google Scholar]
- 20.Gunter TE, Buntinas L, Sparagna G, Eliseev R, Gunter K. Mitochondrial calcium transport: mechanisms and functions. Cell Calcium. 2000 Nov-Dec;28(5–6):285–96. doi: 10.1054/ceca.2000.0168. [DOI] [PubMed] [Google Scholar]
- 21.Seguchi H, Ritter M, Shizukuishi M, Ishida H, Chokoh G, Nakazawa H, et al. Propagation of Ca2+ release in cardiac myocytes: role of mitochondria. Cell Calcium. 2005 Jul;38(1):1–9. doi: 10.1016/j.ceca.2005.03.004. [DOI] [PubMed] [Google Scholar]
- 22.Griffiths EJ. Species dependence of mitochondrial calcium transients during excitation-contraction coupling in isolated cardiomyocytes. Biochem Biophys Res Commun. 1999 Sep 24;263(2):554–9. doi: 10.1006/bbrc.1999.1311. [DOI] [PubMed] [Google Scholar]
- 23.Maack C, Cortassa S, Aon MA, Ganesan AN, Liu T, O’Rourke B. Elevated cytosolic Na+ decreases mitochondrial Ca2+ uptake during excitation-contraction coupling and impairs energetic adaptation in cardiac myocytes. Circ Res. 2006 Jul 21;99(2):172–82. doi: 10.1161/01.RES.0000232546.92777.05. [DOI] [PMC free article] [PubMed] [Google Scholar]
- 24.Bell CJ, Bright NA, Rutter GA, Griffiths EJ. ATP regulation in adult rat cardiomyocytes: time-resolved decoding of rapid mitochondrial calcium spiking imaged with targeted photoproteins. J Biol Chem. 2006 Sep 22;281(38):28058–67. doi: 10.1074/jbc.M604540200. [DOI] [PubMed] [Google Scholar]
- 25.Trollinger DR, Cascio WE, Lemasters JJ. Selective loading of Rhod 2 into mitochondria shows mitochondrial Ca2+ transients during the contractile cycle in adult rabbit cardiac myocytes. Biochem Biophys Res Commun. 1997 Jul 30;236(3):738–42. doi: 10.1006/bbrc.1997.7042. [DOI] [PubMed] [Google Scholar]
- 26.O’Neill SC, Miller L, Hinch R, Eisner DA. Interplay between SERCA and sarcolemmal Ca2+ efflux pathways controls spontaneous release of Ca2+ from the sarcoplasmic reticulum in rat ventricular myocytes. J Physiol. 2004 Aug 15;559(Pt 1):121–8. doi: 10.1113/jphysiol.2003.058917. [DOI] [PMC free article] [PubMed] [Google Scholar]
- 27.Terentyev D, Kubalova Z, Valle G, Nori A, Vedamoorthyrao S, Terentyeva R, et al. Modulation of SR Ca release by luminal Ca and calsequestrin in cardiac myocytes: effects of CASQ2 mutations linked to sudden cardiac death. Biophys J. 2008 Aug;95(4):2037–48. doi: 10.1529/biophysj.107.128249. [DOI] [PMC free article] [PubMed] [Google Scholar]
- 28.MacQuaide N, Dempster J, Smith GL. Measurement and modeling of Ca2+ waves in isolated rabbit ventricular cardiomyocytes. Biophys J. 2007 Oct 1;93(7):2581–95. doi: 10.1529/biophysj.106.102293. [DOI] [PMC free article] [PubMed] [Google Scholar]
- 29.Macquaide N, Smith GL. 487.11-Pos Quantification Of SR Depletion During Spontaneous Ca2+ Waves In Ventricular Cardiomyocytes. Biophys J. 2008 February 1;94(1MeetingAbstracts):487–k. [Google Scholar]
- 30.Gavin CE, Gunter KK, Gunter TE. Mn2+ sequestration by mitochondria and inhibition of oxidative phosphorylation. Toxicol Appl Pharmacol. 1992 Jul;115(1):1–5. doi: 10.1016/0041-008x(92)90360-5. [DOI] [PubMed] [Google Scholar]
- 31.Miyata H, Silverman HS, Sollott SJ, Lakatta EG, Stern MD, Hansford RG. Measurement of mitochondrial free Ca2+ concentration in living single rat cardiac myocytes. Am J Physiol. 1991 Oct;261(4 Pt 2):H1123–34. doi: 10.1152/ajpheart.1991.261.4.H1123. [DOI] [PubMed] [Google Scholar]
- 32.Zhou Z, Matlib MA, Bers DM. Cytosolic and mitochondrial Ca2+ signals in patch clamped mammalian ventricular myocytes. J Physiol. 1998 Mar 1;507(Pt 2):379–403. doi: 10.1111/j.1469-7793.1998.379bt.x. [DOI] [PMC free article] [PubMed] [Google Scholar]
- 33.Liu T, O’Rourke B. Enhancing mitochondrial Ca2+ uptake in myocytes from failing hearts restores energy supply and demand matching. Circ Res. 2008 Aug 1;103(3):279–88. doi: 10.1161/CIRCRESAHA.108.175919. [DOI] [PMC free article] [PubMed] [Google Scholar]
- 34.Bassani RA, Bassani JW, Bers DM. Mitochondrial and sarcolemmal Ca2+ transport reduce [Ca2+]i during caffeine contractures in rabbit cardiac myocytes. J Physiol. 1992;453:591–608. doi: 10.1113/jphysiol.1992.sp019246. [DOI] [PMC free article] [PubMed] [Google Scholar]
- 35.Csordas G, Thomas AP, Hajnoczky G. Calcium signal transmission between ryanodine receptors and mitochondria in cardiac muscle. Trends Cardiovasc Med. 2001 Oct;11(7):269–75. doi: 10.1016/s1050-1738(01)00123-2. [DOI] [PubMed] [Google Scholar]
- 36.Sharma VK, Ramesh V, Franzini-Armstrong C, Sheu SS. Transport of Ca2+ from sarcoplasmic reticulum to mitochondria in rat ventricular myocytes. J Bioenerg Biomembr. 2000 Feb;32(1):97–104. doi: 10.1023/a:1005520714221. [DOI] [PubMed] [Google Scholar]
- 37.Garcia-Perez C, Hajnoczky G, Csordas G. Physical Coupling Supports the Local Ca2+ Transfer between Sarcoplasmic Reticulum Subdomains and the Mitochondria in Heart Muscle. J Biol Chem. 2008 Nov 21;283(47):32771–80. doi: 10.1074/jbc.M803385200. [DOI] [PMC free article] [PubMed] [Google Scholar]
- 38.Ramesh V, Sharma VK, Sheu SS, Franzini-Armstrong C. Structural proximity of mitochondria to calcium release units in rat ventricular myocardium may suggest a role in Ca2+ sequestration. Ann N Y Acad Sci. 1998 Sep 16;853:341–4. doi: 10.1111/j.1749-6632.1998.tb08295.x. [DOI] [PubMed] [Google Scholar]
- 39.Pacher P, Thomas AP, Hajnoczky G. Ca2+ marks: miniature calcium signals in single mitochondria driven by ryanodine receptors. Proc Natl Acad Sci U S A. 2002 Feb 19;99(4):2380–5. doi: 10.1073/pnas.032423699. [DOI] [PMC free article] [PubMed] [Google Scholar]
- 40.McCormack JG, Browne HM, Dawes NJ. Studies on mitochondrial Ca2+-transport and matrix Ca2+ using fura-2-loaded rat heart mitochondria. Biochim Biophys Acta. 1989 Mar 23;973(3):420–7. doi: 10.1016/s0005-2728(89)80384-6. [DOI] [PubMed] [Google Scholar]
- 41.Isenberg G, Han S, Schiefer A, Wendt-Gallitelli MF. Changes in mitochondrial calcium concentration during the cardiac contraction cycle. Cardiovasc Res. 1993 Oct;27(10):1800–9. doi: 10.1093/cvr/27.10.1800. [DOI] [PubMed] [Google Scholar]
- 42.Griffiths EJ, Stern MD, Silverman HS. Measurement of mitochondrial calcium in single living cardiomyocytes by selective removal of cytosolic indo 1. Am J Physiol. 1997 Jul;273(1 Pt 1):C37–44. doi: 10.1152/ajpcell.1997.273.1.C37. [DOI] [PubMed] [Google Scholar]
- 43.Horikawa Y, Goel A, Somlyo AP, Somlyo AV. Mitochondrial calcium in relaxed and tetanized myocardium. Biophys J. 1998 Mar;74(3):1579–90. doi: 10.1016/S0006-3495(98)77869-5. [DOI] [PMC free article] [PubMed] [Google Scholar]
- 44.Moravec CS, Desnoyer RW, Milovanovic M, Schluchter MD, Bond M. Mitochondrial calcium content in isolated perfused heart: effects of inotropic stimulation. Am J Physiol. 1997 Sep;273(3 Pt 2):H1432–9. doi: 10.1152/ajpheart.1997.273.3.H1432. [DOI] [PubMed] [Google Scholar]
- 45.Moravec CS, Bond M. Effect of inotropic stimulation on mitochondrial calcium in cardiac muscle. J Biol Chem. 1992 Mar 15;267(8):5310–6. [PubMed] [Google Scholar]
Associated Data
This section collects any data citations, data availability statements, or supplementary materials included in this article.


