

Abstract
Changes in residual conformational entropy of proteins can be significant components of the thermodynamics of folding and binding. Nuclear magnetic resonance (NMR) spin relaxation is the only experimental technique capable of probing local protein entropy, by inference from local internal conformational dynamics. To assess the validity of this approach, the picosecond-to-nanosecond dynamics of the arginine side-chain Nε-Hε bond vectors of E. coli ribonuclease H (RNase H) were determined by NMR spin relaxation and compared to the mechanistic detail provided by molecular dynamics (MD) simulations. The results indicate that arginine Nε spin relaxation primarily reflects persistence of guanidinium salt bridges and correlates well with simulated side-chain conformational entropy. In particular cases, the simulations show that the aliphatic part of the arginine side chain can retain substantial disorder while the guanidinium group maintains its salt bridges; thus, the Nε-Hε bond-vector orientation is conserved and side-chain flexibility is concealed from Nε spin relaxation. The MD simulations and an analysis of a rotamer library suggest that dynamic decoupling of the terminal moiety from the remainder of the side chain occurs for all five amino acids with more than two side-chain dihedral angles (R, K, E, Q and M). Dynamic decoupling thus may represent a general biophysical strategy for minimizing the entropic penalties of folding and binding.
Keywords: NMR, order parameter, molecular dynamics simulation, rotamer library, arginine
INTRODUCTION
Protein side-chain dynamics represent a major component of protein conformational entropy.1 Perturbations of dynamics upon folding or molecular interaction are therefore believed to contribute to the thermodynamics of these processes.2 Nuclear magnetic resonance (NMR) relaxation of backbone and side-chain spin probes has been used to infer conformational entropy from internal protein dynamics.2-4 Side-chain methyl C-H bond vectors, the N-H bond vectors in the carboxyamide group of asparagine and glutamine, and the secondary amines (Nε-Hε) of arginine and tryptophan are routinely used as spin-relaxation probes of local side-chain dynamics.2,5 Methods for NMR spin-relaxation studies of the dynamics of the terminal groups of other amino acids are in development.6,7
The full spectrum of possible enthalpy-entropy partitioning has been experimentally observed when using NMR spin relaxation to probe changes in entropy upon biologically relevant transitions: (1) enthalpically driven processes with global rigidification of the protein; (2) allosteric entropic compensation, in which the binding site becomes more rigid while more distal regions become more flexible; and (3) entirely entropically driven processes with apparently increased global conformational entropy.4,8
Arginine side chains often participate in molecular recognition by proteins, because the terminal positively-charged guanidinium group affords multiple salt bridge geometries.9,10 The long arginine side-chain also can bear substantial residual conformational entropy. Arginine 15Nε spin-relaxation has been used to investigate arginine side-chain dynamics with applications to protein-protein11 and protein-nucleic acid3,11-14 interactions. The underlying structural determinants and mechanisms of arginine side-chain motion, however, remain obscure. Both side-chain solvent accessibility15 and electrostatic interactions11-13,16 have been proposed as the primary structural determinants of arginine side-chain dynamics. The lack of mechanistic insight results from the limited atomistic detail afforded by NMR spin-relaxation parameters. Several studies of protein-substrate complexes reported substantial Nε flexibility for arginine side chains believed to be involved in specific substrate interactions.3,12,13 The observations were interpreted as indicative of either alternative electrostatic interactions or stable interactions with concerted motions of protein and ligand. An analogous observation was made for lysine side chains in a protein-DNA complex and attributed to alternative hydrogen-bond acceptors based on the NMR-derived structure.17 In contrast, Forman-Kay and coworkers observed broadening of aliphatic resonances for arginine side-chains with essentially rigid Nε-Hε bond vectors in a protein-peptide complex.11 They offer three explanations: exchange between hydrogen-bonded and non-hydrogen-bonded conformations, alternative hydrogen-bond acceptors or stable Nε interactions with aliphatic disorder accommodating internal relocation of the complex.
Molecular dynamics (MD) simulations provide a full atomistic description of protein motions. The method is therefore perfectly poised for mechanistic interpretation of NMR spin-relaxation data, provided that quantitative agreement and thus experimental validation of the simulations is achieved.4,18-21 In addition to biophysical insight, MD simulations allow investigation of the implicit assumptions of spin-relaxation based entropy determination, such as homogeneity of local dynamics and uncoupling of local motions.22,23 An early study comparing spin-relaxation parameters and MD simulations divided asparagine, glutamine and arginine side-chain dynamics into three classes, depending upon the value of the generalized order parameter S2, which reports on the amplitude of motion of the bond vector under investigation on a timescale typically less than or similar to the timescale of overall rotational tumbling of the protein.2 The three classes represented no dihedral disorder (S2>0.7), one disordered side-chain dihedral angle (0.7≥S2≥0.3), and two or more disordered side-chain dihedral angles (S2<0.3).24 This partitioning suggests quantitative correlation between NMR spin-relaxation probes of side-chain dynamics and side-chain conformational entropy.
The 18 kDa nucleotidyl-transferase E. coli ribonuclease H (RNase H) has been the subject of several NMR25-30 and MD31-33 studies of protein dynamics. Here we report a comparison between arginine Nε spin relaxation at four static magnetic fields and extensive MD simulations for RNase H. Good agreement between simulated and experimental order parameters encourages use of the simulations for atomistic interpretation of the experimental data. The analysis confirms that Nε dynamics are primarily sensitive to the presence of salt bridges formed by the guanidinium group. Importantly, the arginine side-chain can occupy several rotameric states while forming stable salt bridges, thereby retaining substantial residual entropy. The simulations together with analysis of a rotamer library34 suggest that dynamic decoupling of the side-chain terminus from the aliphatic part can be expected for all amino acids with more than two side-chain dihedral angles. The results imply that spin-relaxation based determination of side-chain conformational entropy is limited by inherent sensitivity to local interactions, and that dynamic decoupling may be a general biophysical strategy for maximizing residual side-chain conformational entropy.
MATERIALS AND METHODS
1. NMR Spectroscopy
R1, R2 and {1H}-15N NOE parameters were measured for the 10 arginine Nε-Hε moieties in a 0.75 mM sample of [U-2H, 15N] RNase H at pH 5.5 and 300 K using established sensitivity-enhanced gradient-selected pulse sequences35 (Tables S1-S3, Supporting Information). R1 and NOE were measured at 9.4, 11.7, 14.1 and 16.4 T. R1 experiments used the following time points: 0.01 s, 0.2 s, 0.4 s, 0.8 s, and 1.6 s at 9.4 T; 0.01 s, 0.25 s, 0.5 s, 1 s, and 2 s at 11.7 T; 0.01 s, 0.25 s, 0.5 s, 1.25 s, and 2.5 s at 14.1 T; 0.01 s, 0.3 s, 0.75 s, 1.5 s, and 3 s at 16.4 T. NOE experiments used saturation periods of 4 s at 9.4 T and 11.7 T, 5.8 s at 14.1 T, and 7.8 s at 16.4 T; control experiments used a 12 s recycle delay. Three NOE experiments were conducted at each field, and average NOE rates were used for the analysis. R2 rates were measured with CPMG experiments at 9.4, 11.7 and 14.1 T, using a spin echo delay of 1.0 ms and time points at 0.006 s, 0.03 s, 0.06 s, 0.1 s and 0.15 s. Two spectra were acquired for each time point in all R1 and R2 experiments. The R2 experiment at 14.1 T was repeated, and average rates from the two experiments were used for the analysis. Rates were extracted from spectra processed with an exponential line broadening of 6 Hz in F2 and a cosine bell in F1 for all arginine Nε-Hε resonances. For the unassigned resonance near that of R138, Lorentzian-to-Gaussian resolution enhancement was used in F2, with an exponential line broadening of −6 Hz and a Gaussian broadening of 8 Hz. Errors were derived from jackknife calculations. Spin-relaxation data were analyzed using reduced spectral density mapping36 with an N-H bond length of 1.04 Å.37 Data measured at the three lower fields were used to estimate the spectral density J(0), while the parameters measured at the three higher fields were used for the higher frequency components of the spectral density function, J(ωN) and J(0.87ωH).26,27 Spectral densities of all arginines except R46 and R106 were fitted using two order parameters and an internal correlation time, while R46 and R106 required only one order parameter and an internal correlation time. Fitting used the nonlinear least-squares regression algorithm implemented in MATLAB. The correlation times for overall tumbling were obtained using a previously reported axial diffusion tensor.38
2. MD Simulations
The crystal structure of RNase H (PDB code 2RN2)39, 9,387 TIP3P40 water molecules and 7 Cl− ions were placed in an orthorhombic box to accommodate a minimum water shell thickness of 1 nm, with the protein described by the AMBER99SB force field.41 The system was energy minimized in two steps by first minimizing only the solvent and then minimizing the whole system. The system was equilibrated to 300 K over 110 ps at constant temperature and constant pressure (NPT), using periodic boundary conditions and a cut-off of 1 nm for both Particle-Mesh-Ewald and Lennard-Jones interactions; protein coordinates were constrained for the first 10 ps. The SHAKE42 algorithm was applied for constraining vibrations of bonds involving hydrogen atoms and a time step of 1 fs was used. The system was then equilibrated for a further 1 ns at NPT. Eight structures with temperatures close to 300 K were extracted from the equilibration and used as starting structures for eight 20 ns constant energy (NVE) production runs, using identical simulation parameters. One of these simulations was extended to 117 ns. The procedure was repeated with the TIP4P water model,40 yielding an additional set of eight 20 ns trajectories. All unconstrained simulations were conducted with the pmemd module, and all constrained simulations were conducted with the sander module in the AMBER 9.0 molecular dynamics package.
3. Simulated Order Parameters
Simulated generalized order parameters were calculated from
| (1) |
in which μ1, μ2 and μ3 are the x, y and z components of the relevant bond vector scaled to unit magnitude, μ, respectively.43 Angular brackets indicate averaging over the snapshots in a 10 ns block, after superposition of backbone heavy atoms to remove the effects of overall tumbling. The block length is chosen to mimic the time scale limitation of NMR spin-relaxation (RNase H has an overall tumbling time of 9.7 ns).18 To assess the separability of internal and overall protein motion, the rotationally invariant iRED approach44 also was used to calculate order parameters from 10 ns blocks. The results obtained from the two methods agree within errors (not shown).
4. Conformational Entropy
Arginine side-chain conformational entropy was calculated from dihedral-angle distributions sampled during the simulations. In principle, this entropy can be computed exactly from computer simulations by numerically evaluating
| (2) |
in which is the four-dimensional probability density function of the four dihedral-angles of the arginine side-chain.45 Recent increases in computational resources allow direct computation of adequately converged estimates of without the need for approximations of the underlying form and structure of the probability density function.
In this study was approximated with a four-dimensional histogram of the dihedral-angle distribution sampled in silico. This discrete probability density function then was used to numerically evaluate equation 2. The choice of units for measuring dihedral angles when evaluating equation 2 only affects absolute entropy values, not differences. In the present work, dihedral angles were measured in degrees, yielding a maximum entropy of 46.78 cal/(mol·K) for a uniform dihedral angle distribution. The dependence of the computed entropies on the bin size of the integration mesh is shown in figure S1 (Supporting Information). Standard errors of the computed entropies were estimated with the bootstrap method (10,000 random bootstrap samples per computed entropy).46
5. Hydrogen Bonds and Salt Bridges
A hydrogen bond was considered formed between a donor hydrogen atom (attached to a nitrogen or oxygen atom) and an acceptor atom (nitrogen or oxygen atom) when the distance between donor hydrogen and acceptor was less than 3.0 Å, and simultaneously the angle between donor, donor hydrogen and acceptor as well as the angle between donor hydrogen, acceptor and the acceptor-bound atom were larger than 100°.47 A given hydrogen atom was considered to participate in a salt bridge if it formed a hydrogen bond with the salt-bridge acceptor. Because the hydrogen atoms of the terminal amino group of lysine are equivalent, a lysine salt bridge was considered formed if its terminal nitrogen atom was closer than 4 Å to its partner oxygen.48 The results are not significantly affected if this cut-off is reduced to 3.2 Å.
6. Rotamer Nomenclature
Rotameric conformations are labeled according to their four χ angles: p (gauche positive), ∼60°; t (trans), ∼180°; m (gauche negative), ∼300°. For terminal χ angles in residues with planar functional groups, where the ideal rotamers deviate from these values, the mean value rounded to the nearest 10° is given.34
RESULTS
1. Nε-Hε Flexibility
Flexibilities of the 10 arginine side-chain Nε-Hε bond vectors of E. coli RNase H (fig. 1a) were examined using NMR spin relaxation and MD simulations. Resonances of all Nε-Hε moieties are well resolved in 1H-15N correlation spectra (fig. 1b). Generalized order parameters and effective correlation times were obtained for all Nε sites using reduced spectral density mapping. An average chemical shift anisotropy (CSA) value of −114.0 ppm was determined from the field dependence of the relaxation rate constants.28 Nε order parameters were also calculated from eight 20 ns MD simulations of the protein conducted using the AMBER99SB force field in both TIP3P and TIP4P explicit water. One of the TIP3P trajectories was extended to 117 ns. Nε order parameters agree within errors for simulations using the two water models. The choice of explicit solvent model is known to influence overall tumbling significantly; however, effects of the solvent model on internal dynamics are a matter of ongoing research.49 The thoroughly validated combination of AMBER99SB force field and TIP3P water model therefore was chosen for comparison with NMR spin-relaxation data on timescales faster than the experimentally determined tumbling time of RNase H.
Figure 1.

RNase H arginine residues. (a) Location of arginines in the crystal structure of RNase H (PDB code 2RN2).39 (b) Section of the 10 ms time point spectrum from the 16.4 T R1 experiment showing the arginine Nε-Hε resonances of RNase H. X indicates a minor unassigned resonance (see text).
Experimental and simulated Nε order parameters agree well (correlation coefficient of 0.94) and cover a wide range of motional amplitudes (fig. 2). All comparisons between simulation and experiment refer to the eight 20 ns trajectories, unless otherwise stated. The unassigned resonance near that of R138 may represent a minor conformation of this side chain, with a population of approximately 20% based on intensity differences in the control spectra of the 16.4 T NOE experiment. The resonance has an experimental order parameter of 0.31 ± 0.02, even lower than the Nε order parameter for R138, and was not investigated further.
Figure 2.
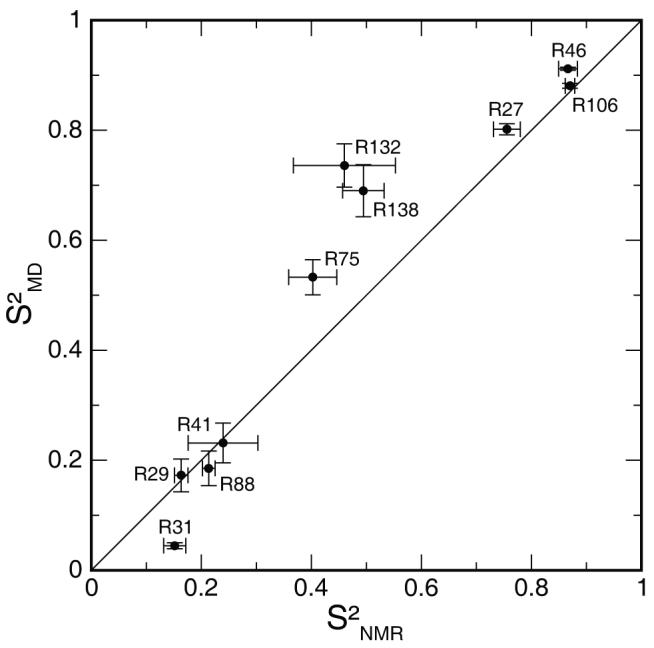
Experimental vs. simulated arginine Nε order parameters. Experimental error bars were derived as described in Materials and Methods. Simulated error bars indicate the standard error of the mean over sixteen 10 ns blocks.
2. Structural Determinants
As observed previously15 and shown in figure 3a, relative side-chain solvent accessibility (rsa), calculated from the crystal structure of RNase H (PDB code 2RN2)39 using NACCESS,50 correlates with Nε flexibility (correlation coefficient of −0.81). Some sites, however, most notably R106, deviate from this trend. The high rsa and Nε rigidity of R106 are reconciled by the presence of a solvent-exposed salt bridge to the carboxylate of E57, formed 85% of the time in the simulations. Nε salt bridges indeed appear to be an important factor of local dynamics (fig. 3b). The additional restriction observed for R132 and R138 can be explained by Nη salt bridges, which can restrict the Nε-Hε bond-vector orientation in the absence of prevalent Nε interactions. The Nη groups of R132 form a salt bridge to the carboxylate of E32 91% of the time, while the Nη groups of R138 form a salt bridge to the carboxylate of D134 94% of the time in silico.
Figure 3.

Structural determinants of Nε flexibility. (a) Relative side-chain solvent accessibility, calculated from the crystal structure of RNase H (PDB code 2RN2)39 using NACCESS,50 vs. experimental order parameters. (b) Average maximal fraction of time the Nε-Hε moiety (black) or the two Nη-Hη moieties (red) of an arginine participate in a salt bridge during a 20 ns trajectory. Standard errors of the mean of the salt-bridge fractions calculated over the eight 20 ns trajectories are shown. Dashed lines connect data points belonging to the same residue when needed for clarity.
The intermediate flexibility of R75, however, cannot be explained by guanidinium salt bridges. The aliphatic part of the side chain of R75 maintains hydrophobic packing with W120 in silico, thereby somewhat restricting Nε-Hε flexibility in the absence of any prevalent guanidinium group interactions.
3. Order Parameters and Entropy
Simulated side-chain conformational entropies calculated from equation 2 are shown in figure S1 (Supporting Information). Although computed entropies decrease uniformly with decreasing bin size of the integration mesh, the correlation coefficient between entropies computed with a 20° mesh and those computed with a 5° mesh is 0.99, suggesting that this bias does not systematically alter relative side-chain entropies. In addition, the standard error of the computed entropies, as estimated by bootstrap statistics, which do not include the error due to the bias introduced by the integration bin size, is calculated to be less than 0.1 cal/(mol·K) for each of the computed entropies, regardless of bin size. These data indicate that torsional sampling in silico was sufficient to converge the four-dimensional probability density functions, and that qualitative trends in computed entropies are invariant to bin size.
Simulated side-chain conformational entropies correlate with Nε order parameters (correlation coefficient of −0.94 for simulated and −0.86 for experimental order parameters and 20° entropy data, fig. 4). The correlation is poor, however, among the six side chains with S2MD>0.5 (correlation coefficient of −0.59). R75, R132 and R138 exhibit lower side-chain entropy than R27, although they have lower Nε order parameters than R27. Notably, R75, with a simulated Nε order parameter of 0.53, displays slightly lower side-chain entropy than R27, with the third highest simulated Nε order parameter of 0.80.
Figure 4.

Simulated (a) and experimental (b) arginine Nε order parameters vs. side-chain conformational entropy computed using a 20° integration mesh. Bootstrap standard errors of the entropies are shown. Error bars not shown are similar to or smaller than the plotted points.
4. Structural Analysis
The side chains of both R27 and R75 occupy several rotameric states in silico (fig. 5a,b). The side chain of R27 undergoes concerted rotameric flips in χ1 and χ3 that keep its Nε-Hε bond vector pointing in one direction (indicated by color coding of conformations in fig. 5). R27 therefore retains substantial side-chain conformational entropy while maintaining its salt bridge to the carboxylate of E6 (fig. 5a). The χ1 and χ2 dihedral angles of R75, on the other hand, are essentially constrained to the t rotamer by hydrophobic packing with the aromatic ring of W120 (χ1 is always t, χ2 is t 98% of the time). The guanidinium group of R75 is solvent exposed, and its χ3 and χ4 angles are disordered (fig. 5b). R75 therefore exhibits a relatively low Nε order parameter while its conformational side-chain entropy is substantially reduced compared to completely solvent-exposed arginine side chains.
Figure 5.

Two-dimensional χ-angle plots for select arginine residues. For R27, R75 and R106, every 10th conformation from all eight 20 ns trajectories is shown; for R46 every 7th conformation from the extended 117 ns trajectory is shown. Conformations are color-coded with respect to the scalar product of the orientation of the Nε-Hε bond vector and its orientation in the first snapshot according to the color bar in the plot of R46. Representative structures of the respective arginine side chain and its interaction partner are shown, with salt bridges indicated by red dashed lines.
Analysis of the other two arginine side chains with essentially rigid Nε-Hε bond vectors, R46 and R106, reveals that R27 is not unique in its ability to maintain side-chain disorder in a salt bridge (fig. 5c,d). The solvent exposed side-chain of R106 interconverts freely in all simulations between two rotameric states which preserve Nε-Hε orientation and thus its salt bridge. R106 undergoes concerted flips in χ1 and χ3, in analogy to R27 (fig. 5c). The side chain of R46, however, is buried. It remains in one rotameric state (mtp70) throughout the eight 20 ns simulations, but it occupies another state (ttt80) for the second half of the extended 117 ns simulation. This second state also is accessed through concerted χ1-χ3 flips in order to maintain the salt-bridge interactions (fig. 5d). The side-chain conformational entropy of R46 calculated from the 117 ns trajectory increases by 1.73 cal/(mol·K), further reducing the S2-entropy correlation among the rigid sites (correlation coefficient of −0.57).
Arginine side chains engaged in Nη-dominated salt bridges show behavior similar to those in Nε salt bridges. The main difference is the possibility of alternative salt-bridge configurations. The side chain of R132, for example, can form its salt bridge to E32 through its Nη groups in two possible ways (conformations labeled red and blue, respectively, in fig. 6). In each configuration the side chain occupies several rotameric states, as observed for Nε salt bridges. In contrast to Nε salt bridges, however, interconversion between Nη salt-bridge configurations reorients the Nε-Hε vector substantially. Analogous behavior is observed for R138 (Figure S2, Supporting Information). The conformational space sampled by a solvent-exposed arginine side-chain (R41) is shown in figure S3 for comparison (Supporting Information).
Figure 6.
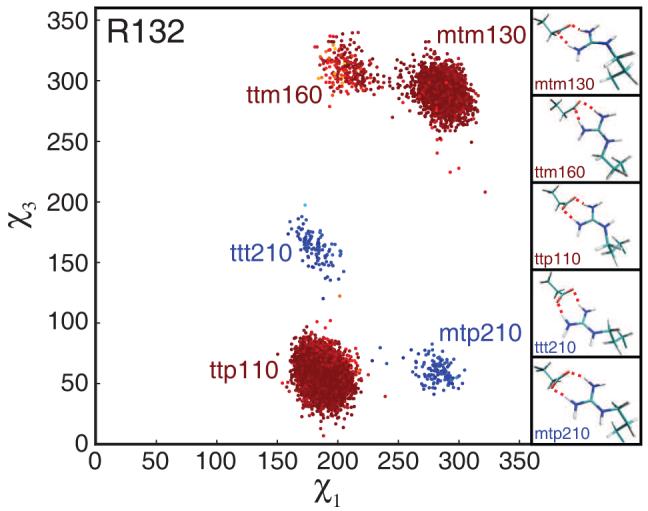
Two-dimensional χ-angle plot for R132. For clarity, every 10th conformation forming the salt bridge to E32 from all eight 20 ns trajectories is shown. Conformations are color-coded as in figure 5. In addition, the salt-bridge configuration of each conformation is indicated by the color of the corresponding rotamer label (red and blue). Representative structures are shown, with salt bridges indicated by red dashed lines.
Analysis of a rotamer library confirms the degeneracy of the conformational space of arginine with respect to Nε-Hε orientation.34 Twenty seven of the 28 conformations in the library can be grouped into six clusters with Nε-Hε orientations varying less than 30° between member conformations. Two of these clusters are shown in Figure 7. For any one of the five arginines forming salt bridges with Nε participation, the majority of conformations sampled in silico fall into one of the six clusters. The remaining conformations deviate in at least one χ angle from the ideal rotamer in order to allow for Nε salt-bridge participation. In all cases the deviations are within the bounds observed in the raw data used to generate the library. Deviations from ideal rotamers were not considered in the clustering of the rotamer library.
Figure 7.
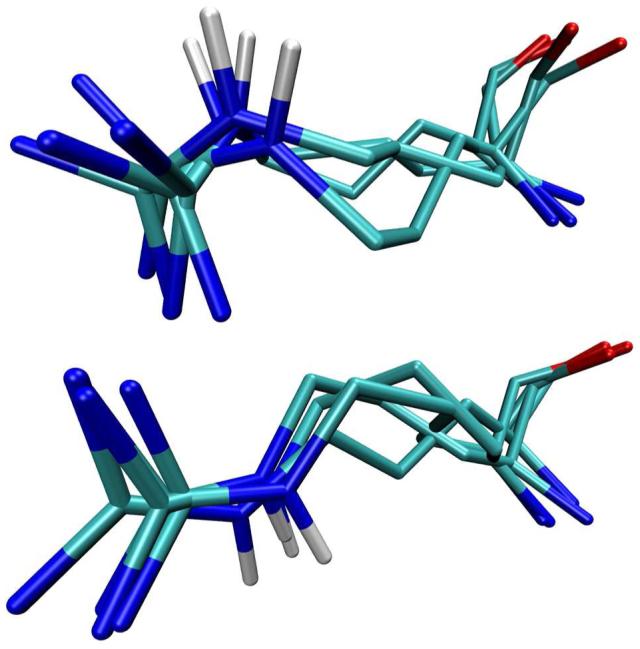
Two groups of arginine rotamer-library conformations clustered according to Nε-Hε bond-vector orientation after joint heavy-atom superposition.
5. Other Side Chains
Populations of several rotamers in a salt bridge also are observed for all glutamate residues engaging in such interactions. All of these form salt bridges with arginines in RNase H (Figure S4a-c, Supporting Information). The ability of glutamates to maintain rotameric disorder in salt bridges is predicted by the rotamer library. When the χ2 angle of the glutamate side-chain is in the t rotamer, χ3 is largely unconstrained within a basin approximately 180° wide.34 All three conformations with χ2 in the t rotamer show similar Cγ-Cδ bond orientations and consequently can maintain the same salt bridge (Figure S4d, Supporting Information). Most salt bridges examined show little association between side-chain dynamics of salt-bridge partners in silico (Figure S4a,b, Supporting Information). The maximum association observed amounts to a Cramer’s V of 0.36 using products of individual dihedral-angle distributions as null-hypotheses (Figure S4c, Supporting Information).51
The behavior of glutamine side chains is analogous to that of glutamate side chains, despite the lack of symmetry in the carboxyamide group. Q76, the only glutamine residue engaged in a persistent hydrogen bond in silico (formed 51.9% of the time) populates several rotamers while maintaining the hydrogen bond (Figure S5a, Supporting Information). For glutamines, like glutamates, χ3 is unconstrained when χ2 is in the t rotamer. The corresponding cluster found in the rotamer library is shown in figure S5b (Supporting Information). The order parameter calculated over all hydrogen-bonded conformations of the relevant N-H bond is 0.76 ± 0.02.
Both lysine side chains forming persistent salt bridges in silico (>50% of the time), K86 and K96, populate several rotameric states while maintaining terminal salt bridges. K86 forms a salt bridge with D108 98.9% of the time in silico. Most of the conformational space sampled by K86 (red conformations in Figure S6a, Supporting Information) corresponds to a cluster of rotamer-library conformations with similar Cε-Nζ bond orientations (Figure S6b(i), Supporting Information). Three additional conformations, however, are able to form the salt bridge with altered Cε-Nζ bond orientations (blue conformations in Figure S6a, Supporting Information), reflecting the lack of orientational constraint on the amino group in a salt bridge due to the three equivalent amino hydrogen atoms. The simulated order parameter for the Cε-Nζ bond of K86 is 0.57 ± 0.04.
No analogous behavior is observed for methionine side chains in silico. Interestingly, the methionine conformations found in the rotamer library can be clustered with respect to Sδ-Cε bond orientation, indicating that the methionine side chain is able to keep its terminal methylsulfanyl group fixed while retaining rotameric disorder (Figure S7, Supporting Information). Although methionine methyl order parameters are usually low, in calmodulin methionines account for some of the highest methyl order parameters and exhibit the most pronounced increases in methyl order parameters upon ligand binding.2
Neither the simulations nor the rotamer library contain any evidence that amino acids with less than three side-chain dihedral angles have similar capabilities, in agreement with the established correlation between methyl order parameters and rotamer jumps for all methyl-bearing side chains except methionine.2,52
DISCUSSION
The results presented herein indicate that arginine Nε dynamics are primarily governed by salt bridges of the guanidinium group and secondarily by packing interactions. Furthermore, the data show that the degrees of freedom of the arginine side chain enable it to retain substantial disorder while maintaining specific interactions through its charged terminus. Dynamic decoupling in arginines can occur even when the side chain is completely buried, as in the case of R46 (2.2% rsa). A significant fraction of salt bridges are buried in proteins, and the majority of these buried salt bridges appear functionally important.48
The effect of terminal interactions on Nε spin relaxation depends on salt bridge geometry: Nε salt bridges necessarily restrict Nε-Hε orientation, but Nη salt bridges may or may not do so. Interconversion between Nη salt-bridge configurations, which reorients the Nε-Hε bond vector, must be faster than overall tumbling in order to affect Nε spin relaxation. Convergence of the internal correlation functions for R132 and R138 is incomplete and indicates that the reconfiguration timescales must be at least on the order of overall tumbling for both residues. Thus, larger S2MD values for R132 and R138 may stem from excessive energy barriers for transiently breaking the salt bridges in silico. Nε order parameters calculated from the full conformational ensemble of the eight 20 ns simulations are reduced to 0.62 and 0.51 for R132 and R138, respectively, yielding significantly better agreement with experiment. Thus, a lower barrier and consequent faster reconfiguration would result in a higher contribution of the associated Nε-Hε reorientation to spin relaxation and would reduce the order parameter. A detailed analysis of the discrepancy, however, is outside the scope of this work, not only due to sampling limitations, but also due to the large number of factors possibly affecting the stability of salt bridges in silico (including protein parameterization, solvent model, ionic strength, and deviations from classical electrostatics). On the experimental side, fast reconfiguration of Nη salt bridges could explain low Nε order parameters measured previously for arginines with putatively specific substrate interactions in complexes, without the requirement of alternate hydrogen-bonding patterns or concerted motions of protein and ligand.3,12,13
Both R132 and R138 show decoupling of Nε dynamics from rotameric disorder within each of two Nη salt-bridged configurations. In analogy to arginines forming Nε salt bridges, local interactions of the guanidinium group restrict Nε-Hε orientation, while the aliphatic part can populate several rotameric states. Motional independence of the terminus from the rest of the side chain suggests that the aliphatic broadening in arginine residues with high Nε order parameters observed by Forman-Kay and coworkers can be explained by stable salt bridges without the need for coupled motions at the complex interface.11 Instead, interactions of the terminal group introduce coupling between dihedral angles of the arginine side chain. The strongest dihedral-angle association observed in silico across a salt bridge, i.e. between an arginine and a glutamate side chain, amounts to a Cramer’s V of 0.36 (R27 χ3 - E6 χ1), whereas the strongest association within an arginine side-chain amounts to a Cramer’s V of 1.00 (R46 χ1-χ3 from the extended simulation). The majority of strong dihedral-angle associations are observed between the χ1 and χ3 angles of an arginine side chain, reflecting the aforementioned concerted χ1-χ3 flips. In most of these cases, χ2 is in the t rotamer, making the χ1 and χ3 axes of rotation (Cα-Cβ and Cγ-Cδ bonds, respectively) nearly parallel. In this geometry, concerted rotations in opposite directions around χ1 and χ3 preserve the orientation of the guanidinium group, and thus its salt bridges. Analogous main-chain—side-chain torsional correlations in both polar and non-polar amino acids have been observed by LeMaster and coworkers (also termed “crankshaft” motions).53,54
In addition to revealing dynamic decoupling in arginines, the simulations also indicate that all polar side chains with more than two dihedral angles are able to reconcile local interactions of the terminus with substantial residual conformational entropy. The resulting thermodynamic benefit for glutamates, glutamines, and lysines forming salt bridges or hydrogen bonds is analogous to that for arginines. The behavior observed in silico is in agreement with a rotamer library for all four amino acids. Importantly for estimates of conformational entropy from spin relaxation, the simulations indicate that the orientations of the relevant bond vectors of glutamine and lysine side chains can be restricted by salt bridges or hydrogen bonds, and therefore might become insensitive to aliphatic disorder, like the Nε-Hε bond vectors of arginines. Finally, although not observed in silico, analysis of the rotamer library indicates that methionine side chains also have the potential to restrict their side-chain terminus while retaining rotameric disorder. This might afford some thermodynamic benefit due to the large surface area of the methylsulfanyl group.
Taken together, the findings of this study illuminate the difficulties of inferring side-chain conformational entropy from NMR spin-relaxation probes of local dynamics. For example, an arginine side chain could engage in intramolecular hydrophobic packing in the apo state, with its guanidinium group solvent exposed, and form an Nε salt bridge with the substrate. The side chain would show a substantial increase in Nε order parameter upon binding although its conformational entropy would largely remain unchanged. Based on a difference in order parameter of 0.3 (corresponding to the difference in order parameters between R75 and R27) the estimated difference in side-chain entropy at 300 K would amount to approximately 0.6 kcal/mol, or 1 kT, per residue.55 Resolution of these difficulties requires further development of methods for direct detection of methylene conformational dynamics, which hitherto have been limited to relatively small proteins (<15 kD).56-60
CONCLUSION
Comparison of simulated and experimental arginine side-chain Nε order parameters for RNase H has shown that modern MD simulations can provide detailed biophysical interpretations of NMR spin-relaxation data. Nε dynamics are primarily determined by guanidinium salt bridges and secondarily by packing interactions. Residual disagreement between simulation and experiment may indicate that energy barriers for breaking salt bridges are too large in current MD force fields. Nevertheless, the strikingly good overall agreement between the two methods has revealed that local interactions can dynamically decouple the Nε-Hε bond vector from the aliphatic part of the arginine side chain. Guanidinium salt bridges can restrict the Nε-Hε bond vector while the aliphatic part remains relatively disordered, and hydrophobic packing can restrict the aliphatic part while the guanidinium group remains relatively flexible. The simulations in concert with the analysis of a rotamer library reveal that all amino acids with more than two side-chain dihedral angles, including present (R, Q, M) and future (E, K) NMR probes of side-chain dynamics, may have similar capabilities. Thus, determination of side-chain conformational entropy from NMR spin relaxation suffers from insensitivity of side-chain termini to rotameric disorder, in addition to other well-known limitations due to overall tumbling and coupling of local motions.22 The generality of the results for long side chains suggests that dynamic decoupling of the functional terminus from the rest of the side chain may be a general biophysical strategy for preserving residual conformational entropy in proteins and their complexes.
Supplementary Material
Acknowledgment
This work was supported by National Institutes of Health grants GM50291 (A.G.P.), GM063855 (M.R.), GM52018 (R. A. F), and a Boehringer Ingelheim Fonds Ph.D. scholarship (to N.T.). A.G.P. is a member of the New York Structural Biology Center supported by NIH Grant GM66354.
Footnotes
Supporting Information Available: Tables containing measured R1 (S1), R2 (S2) and NOE (S3) rates. Figures depicting dependence of computed side-chain conformational entropies on the bin size of the integration mesh (S1), as well as dynamic decoupling in R138 (S2), R41 (S3), glutamate (S4), glutamine (S5), lysine (S6), and methionine (S7) side chains.
REFERENCES
- (1).Pickett SD, Sternberg MJ. J. Mol. Biol. 1993;231:825–839. doi: 10.1006/jmbi.1993.1329. [DOI] [PubMed] [Google Scholar]
- (2).Igumenova TI, Frederick KK, Wand AJ. Chem. Rev. 2006;106:1672–1699. doi: 10.1021/cr040422h. [DOI] [PMC free article] [PubMed] [Google Scholar]
- (3).Berglund H, Baumann H, Knapp S, Ladenstein R, Härd T. J. Am. Chem. Soc. 1995;117:12883–12884. [Google Scholar]
- (4).Jarymowycz VA, Stone MJ. Chem. Rev. 2006;106:1624–1671. doi: 10.1021/cr040421p. [DOI] [PubMed] [Google Scholar]
- (5).Kempf JG, Loria JP. Cell Biochem. Biophys. 2003;37:187–211. doi: 10.1385/cbb:37:3:187. [DOI] [PubMed] [Google Scholar]
- (6).Iwahara J, Jung YS, Clore GM. J. Am. Chem. Soc. 2007;129:2971–2980. doi: 10.1021/ja0683436. [DOI] [PubMed] [Google Scholar]
- (7).Paquin R, Ferrage F, Mulder FA, Akke M, Bodenhausen G. J. Am. Chem. Soc. 2008 doi: 10.1021/ja803794g. [DOI] [PubMed] [Google Scholar]
- (8).Frederick KK, Marlow MS, Valentine KG, Wand AJ. Nature. 2007;448:325–329. doi: 10.1038/nature05959. [DOI] [PMC free article] [PubMed] [Google Scholar]
- (9).Bogan AA, Thorn KS. J. Mol. Biol. 1998;280:1–9. doi: 10.1006/jmbi.1998.1843. [DOI] [PubMed] [Google Scholar]
- (10).Hoffman MM, Khrapov MA, Cox JC, Yao J, Tong L, Ellington AD. Nucleic Acids Res. 2004;32:D174–181. doi: 10.1093/nar/gkh128. [DOI] [PMC free article] [PubMed] [Google Scholar]
- (11).Pascal SM, Yamazaki T, Singer AU, Kay LE, Forman-Kay JD. Biochemistry. 1995;34:11353–11362. doi: 10.1021/bi00036a008. [DOI] [PubMed] [Google Scholar]
- (12).Slijper M, Boelens R, Davis AL, Konings RN, van der Marel GA, van Boom JH, Kaptein R. Biochemistry. 1997;36:249–254. doi: 10.1021/bi961670d. [DOI] [PubMed] [Google Scholar]
- (13).Wilkinson TA, Botuyan MV, Kaplan BE, Rossi JJ, Chen Y. J. Mol. Biol. 2000;303:515–529. doi: 10.1006/jmbi.2000.4143. [DOI] [PubMed] [Google Scholar]
- (14).Wilkinson TA, Zhu L, Hu W, Chen Y. Biochemistry. 2004;43:16153–16160. doi: 10.1021/bi048409e. [DOI] [PubMed] [Google Scholar]
- (15).Buck M, Boyd J, Redfield C, MacKenzie DA, Jeenes DJ, Archer DB, Dobson CM. Biochemistry. 1995;34:4041–4055. doi: 10.1021/bi00012a023. [DOI] [PubMed] [Google Scholar]
- (16).Cai M, Huang Y, Prakash O, Wen L, Dunkelbarger SP, Huang JK, Liu J, Krishnamoorthi R. Biochemistry. 1996;35:4784–4794. doi: 10.1021/bi953038a. [DOI] [PubMed] [Google Scholar]
- (17).Foster MP, Wuttke DS, Radhakrishnan I, Case DA, Gottesfeld JM, Wright PE. Nat. Struct. Biol. 1997;4:605–608. doi: 10.1038/nsb0897-605. [DOI] [PubMed] [Google Scholar]
- (18).Maragakis P, Lindorff-Larsen K, Eastwood MP, Dror RO, Klepeis JL, Arkin IT, Jensen MO, Xu H, Trbovic N, Friesner RA, Palmer AG, Shaw DE. J. Phys. Chem. B. 2008;112:6155–6158. doi: 10.1021/jp077018h. [DOI] [PMC free article] [PubMed] [Google Scholar]
- (19).Showalter SA, Brüschweiler R. J. Chem. Theory Comput. 2007;3:961–975. doi: 10.1021/ct7000045. [DOI] [PubMed] [Google Scholar]
- (20).Showalter SA, Brüschweiler-Li L, Johnson E, Zhang F, Brüschweiler R. J. Am. Chem. Soc. 2008;130:6472–6478. doi: 10.1021/ja800201j. [DOI] [PubMed] [Google Scholar]
- (21).Trbovic N, Kim B, Friesner RA, Palmer AG. Proteins: Struct., Funct., Bioinf. 2008;71:684–694. doi: 10.1002/prot.21750. [DOI] [PMC free article] [PubMed] [Google Scholar]
- (22).Akke M, Brüschweiler R, Palmer AG. J. Am. Chem. Soc. 1993;115:9832–9833. [Google Scholar]
- (23).Prompers JJ, Bruschweiler R. J. Phys. Chem. B. 2000;104:11416–11424. [Google Scholar]
- (24).Smith LJ, Mark AE, Dobson CM, van Gunsteren WF. Biochemistry. 1995;34:10918–10931. doi: 10.1021/bi00034a026. [DOI] [PubMed] [Google Scholar]
- (25).Butterwick JA, Palmer AG. Protein Sci. 2006;15:2697–2707. doi: 10.1110/ps.062398606. [DOI] [PMC free article] [PubMed] [Google Scholar]
- (26).Butterwick JA, Loria J. Patrick, Astrof NS, Kroenke CD, Cole R, Rance M, Palmer AG. J. Mol. Biol. 2004;339:855–871. doi: 10.1016/j.jmb.2004.03.055. [DOI] [PubMed] [Google Scholar]
- (27).Kroenke CD, Loria JP, Lee LK, Rance M, Palmer AG. J. Am. Chem. Soc. 1998;120:7905–7915. [Google Scholar]
- (28).Kroenke CD, Rance M, Palmer AG. J. Am. Chem. Soc. 1999;121:10119–10125. [Google Scholar]
- (29).Mandel AM, Akke M, Palmer AG., 3rd J. Mol. Biol. 1995;246:144–163. doi: 10.1006/jmbi.1994.0073. [DOI] [PubMed] [Google Scholar]
- (30).Mandel AM, Akke M, Palmer AG., 3rd Biochemistry. 1996;35:16009–16023. doi: 10.1021/bi962089k. [DOI] [PubMed] [Google Scholar]
- (31).Philippopoulos M, Lim C. J. Mol. Biol. 1995;254:771–792. doi: 10.1006/jmbi.1995.0654. [DOI] [PubMed] [Google Scholar]
- (32).Philippopoulos M, Lim C. Proteins: Struct., Funct., Genet. 1999;36:87–110. doi: 10.1002/(sici)1097-0134(19990701)36:1<87::aid-prot8>3.0.co;2-r. [DOI] [PubMed] [Google Scholar]
- (33).Philippopoulos M, Mandel AM, Palmer AG, Lim C. Proteins: Struct., Funct., Genet. 1997;28:481–493. [PubMed] [Google Scholar]
- (34).Lovell SC, Word JM, Richardson JS, Richardson DC. Proteins: Struct., Funct., Genet. 2000;40:389–408. [PubMed] [Google Scholar]
- (35).Cavanagh J, Fairbrother WJ, Palmer AG, Rance M, Skelton NJ. Protein NMR Spectroscopy. 2nd Academic Press; San Diego, CA: 2007. [Google Scholar]
- (36).Farrow NA, Zhang OW, Szabo A, Torchia DA, Kay LE. J. Biomol. NMR. 1995;6:153–162. doi: 10.1007/BF00211779. [DOI] [PubMed] [Google Scholar]
- (37).Case DA. J. Biomol. NMR. 1999;15:95–102. doi: 10.1023/a:1008349812613. [DOI] [PubMed] [Google Scholar]
- (38).Kroenke CD. Ph.D. thesis. Columbia University; 2001. [Google Scholar]
- (39).Katayanagi K, Miyagawa M, Matsushima M, Ishikawa M, Kanaya S, Nakamura H, Ikehara M, Matsuzaki T, Morikawa K. J. Mol. Biol. 1992;223:1029–1052. doi: 10.1016/0022-2836(92)90260-q. [DOI] [PubMed] [Google Scholar]
- (40).Jorgensen WL, Chandrasekhar J, Madura JD, Impey RW, Klein ML. J. Chem. Phys. 1983;79:926–935. [Google Scholar]
- (41).Hornak V, Abel R, Okur A, Strockbine B, Roitberg A, Simmerling C. Proteins: Struct., Funct., Bioinf. 2006;65:712–725. doi: 10.1002/prot.21123. [DOI] [PMC free article] [PubMed] [Google Scholar]
- (42).Ryckaert J-P, Ciccotti G, Berendsen HJC. J. Comput. Phys. 1977;23:327–341. [Google Scholar]
- (43).Chandrasekhar I, Clore GM, Szabo A, Gronenborn AM, Brooks BR. J. Mol. Biol. 1992;226:239–250. doi: 10.1016/0022-2836(92)90136-8. [DOI] [PubMed] [Google Scholar]
- (44).Prompers JJ, Brüschweiler R. J. Am. Chem. Soc. 2002;124:4522–4534. doi: 10.1021/ja012750u. [DOI] [PubMed] [Google Scholar]
- (45).Karplus M, Kushick JN. Macromolecules. 1981;14:325–332. [Google Scholar]
- (46).Efron B, Tibshirani RJ. An Introduction to the Bootstrap. Chapman & Hall/CRC; 1994. [Google Scholar]
- (47).Fabiola F, Bertram R, Korostelev A, Chapman MS. Protein Sci. 2002;11:1415–1423. doi: 10.1110/ps.4890102. [DOI] [PMC free article] [PubMed] [Google Scholar]
- (48).Barlow DJ, Thornton JM. J. Mol. Biol. 1983;168:867–885. doi: 10.1016/s0022-2836(83)80079-5. [DOI] [PubMed] [Google Scholar]
- (49).Wong V, Case DA. J. Phys. Chem. B. 2008;112:6013–6024. doi: 10.1021/jp0761564. [DOI] [PubMed] [Google Scholar]
- (50).Hubbard SJ, Thornton JM. [Google Scholar]
- (51).Agresti A. Categorical Data Analysis. 2nd Wiley Interscience; Hoboken, NJ: 2002. [Google Scholar]
- (52).Best RB, Clarke J, Karplus M. J. Am. Chem. Soc. 2004;126:7734–7735. doi: 10.1021/ja049078w. [DOI] [PubMed] [Google Scholar]
- (53).LeMaster DM. J. Am. Chem. Soc. 1999;121:1726–1742. [Google Scholar]
- (54).LeMaster DM, Kushlan DM. J. Am. Chem. Soc. 1996;118:9255–9264. [Google Scholar]
- (55).Yang D, Kay LE. J. Mol. Biol. 1996;263:369–382. doi: 10.1006/jmbi.1996.0581. [DOI] [PubMed] [Google Scholar]
- (56).Idiyatullin D, Daragan VA, Mayo KH. J. Magn. Reson. 2004;171:4–9. doi: 10.1016/j.jmr.2004.06.019. [DOI] [PubMed] [Google Scholar]
- (57).Zheng Y, Yang D. J. Biomol. NMR. 2004;28:103–116. doi: 10.1023/B:JNMR.0000013826.82936.0e. [DOI] [PubMed] [Google Scholar]
- (58).Engelke J, Rüterjans H. J. Biomol. NMR. 1998;11:165–183. doi: 10.1023/A:1008251319019. [DOI] [PubMed] [Google Scholar]
- (59).Jin C, Prompers JJ, Brüschweiler R. J. Biomol. NMR. 2003;26:241–247. doi: 10.1023/a:1023833407515. [DOI] [PubMed] [Google Scholar]
- (60).Yang D, Mittermaier A, Mok YK, Kay LE. J. Mol. Biol. 1998;276:939–954. doi: 10.1006/jmbi.1997.1588. [DOI] [PubMed] [Google Scholar]
Associated Data
This section collects any data citations, data availability statements, or supplementary materials included in this article.