

Abstract
BACKGROUND:
The diagnosis of asthma is based on clinical symptoms, physical examination and pulmonary function tests, and can be very challenging. Most patients with asthma have a significant postbronchodilator response on spirometry indicating airway hyperresponsiveness. However, having a significant bronchodilator response by itself is not diagnostic of asthma. The definition of a ‘significant’ response has also been controversial. Many respirologists use the American Thoracic Society (ATS) postbronchodilator response criteria of 12% (provided it is 200 mL or greater) improvement in forced expiratory volume in 1 s (or forced vital capacity) from the baseline spirometry.
METHODS:
In the present study, 644 patients who met the ATS criteria for a significant postbronchodilator spirometric response were retrospectively reviewed. The staff respirologist’s diagnosis of asthma, based on all clinical and pulmonary function data, was used as the standard for the diagnosis of asthma.
RESULTS:
Relying on spirometric criteria alone was inadequate in asthma diagnosis because only 54.7% of 310 patients who met the ATS bronchodilator response criteria were thought to have clinical asthma. Increasing the postbronchodilator percentage improvement from the ATS criteria only marginally improved diagnostic specificity and resulted in a decline in sensitivity.
CONCLUSIONS:
The results of the present study further emphasize the need to use spirometric criteria as a guide but not as an unimpeachable gold standard with which to make a diagnosis of asthma. The diagnosis of asthma depends on expert physician correlation of patient history, physical examination and pulmonary function test results.
Keywords: Asthma, Diagnosis, Pulmonary function, Reactive airways, Spirometry
Abstract
HISTORIQUE :
Le diagnostic d’asthme se fonde sur les symptômes cli-niques, l’examen physique et les explorations fonctionnelles respiratoires et peut être très complexe. La plupart des patients asthmatiques ont une réponse importante à la spirométrie après l’administration d’un bron-chodilatateur, indicatrice d’une hyperréactivité. Cependant, une réponse importante à l’administration d’un bronchodilatateur ne constitue pas en soi un diagnostic d’asthme. D’ailleurs, la définition de réponse « importante » est controversée. De nombreux pneumologues utilisent les critères d’amélioration du volume expiratoire maximal par seconde (capacité vitale forcée) de 12 % après l’administration d’un bronchodilatateur (pourvu qu’elle soit d’au moins 200 mL) par rapport à la spirométrie de base.
MÉTHODOLOGIE :
Dans la présente étude, 644 patients qui respectaient les critères de réponse importante à la spirométrie après l’administration d’un bronchodilatateur établis par l’ATS ont fait l’objet d’une analyse rétrospective. Le diagnostic d’asthme posé par le pneumologue traitant d’après toutes les données relatives à la fonction clinique et pulmonaire, a été utilisé comme norme pour le diagnostic d’asthme.
RÉSULTATS :
On ne pouvait se fier seulement aux critères spirométriques pour poser un diagnostic d’asthme, parce qu’on pensait que seulement 54,7 % des 310 patients qui respectaient les critères de réponse de l’ATS après l’administration d’un bronchodilatateur étaient atteints d’asthme clinique. Le fait d’accroître le pourcentage d’amélioration après l’administration d’un bronchodilatateur selon les critères de l’ATS n’améliorait que légèrement la spécificité diagnostique et entraînait une diminution de la sensibilité.
CONCLUSIONS :
Les résultats de la présente étude font ressortir davantage la nécessité d’utiliser les critères spirométriques pour orienter le diagnostic, qui ne constituent toutefois pas la norme d’excellence irrécusable pour poser un diagnostic d’asthme. Le diagnostic d’asthme dépend de la corrélation, déterminée par un médecin expert, avec les antécédents du patient, son examen physique et les résultats de l’exploration fonctionnelle respiratoire.
Asthma is an inflammatory disease of the airways with generally reversible air flow obstruction and airway hyper-responsiveness causing episodic respiratory symptoms (1). In contrast, chronic obstructive pulmonary disease (COPD) is defined by the presence of air flow limitation that is not fully reversible after inhaled bronchodilators (2). The current standard for asthma diagnosis is based on the typical clinical features in conjunction with objective documentation of airway dysfunction, either with a significant change in forced expiratory volume in 1 s (FEV1) after bronchodilator administration or with airways hyperresponsiveness. Alternatively, a significant change in forced vital capacity (FVC) postbronchodilator may be used. A postbronchodilator spirometric response by itself is nonspecific, and the diagnosis relies on physician confirmation. The level of bronchodilator response considered to be diagnostically ‘significant’ has been the subject of controversy (3,4). The definition of the degree of airway reversibility varies widely (5,6). The American Thoracic Society (ATS) has developed criteria which suggest a significant postbronchodilator FEV1 and/or FVC response of 200 mL or greater and 12% improvement from baseline (7). The ATS has recently updated these criteria in collaboration with the European Respiratory Society (8). To our knowledge, these criteria have never been fully validated in a North American population by testing against the clinical diagnosis of asthma. In the present study, patients at the Royal University Hospital (Saskatoon, Saskatchewan) who met the ATS bronchodilator spirometric criteria were examined for bronchodilator responses in reference to clinical diagnosis.
METHODS
All spirometry tests performed on patients referred to the Royal University Hospital adult pulmonary function testing laboratory between September 1999 and September 2004 were reviewed. All pulmonary function testing was performed in accordance with standard ATS protocol with the patient seated, the use of nose clips and the best of three spirometry flow readings recorded. Testing was performed using the Vmax 22 devices (SensorMedics Yorba Linda, USA). The Morris equation was used for predicted FEV1 and FVC (9). A significant bronchodilator response was defined as an increase in FEV1 (or FVC) of 12% (and 200 mL or greater) (5). If a patient had multiple spirometric tests, the most recent test results were recorded. Because access to medical records was required for clinical correlation, only adult patients (older than 18 years of age) who had been seen in outpatient clinics by staff physicians (n=10) of the respirology division were included in the present study. The total spirometry tests and delineation of patients meeting the study criteria are outlined in Figure 1.
Figure 1).
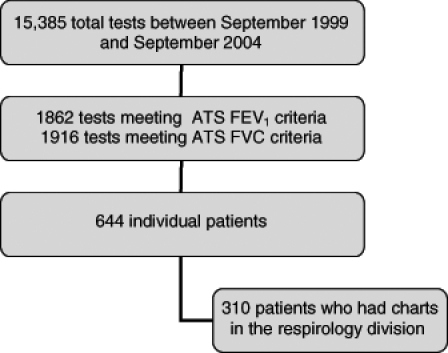
Total spirometry tests and delineation of patients meeting the study criteria. ATS American Thoracic Society; FEV1 Forced expiratory volume in 1 s; FVC Forced vital capacity
All medical records were reviewed by a single investigator using a standard data collection form. The data recorded included age, sex, height, weight, FVC pre- and postbronchodilator, FEV1 pre- and postbronchodilator, forced expiratory flow at 25% to 75% (FEF[25%–75%]) pre- and postbronchodilator, referring physician diagnosis and staff respirologist’s diagnosis. Diagnoses were recorded as asthma, COPD, bronchiectasis and ‘other’. The ‘other’ category included chronic cough, dyspnea, pleural diseases, pneumonia, interstitial lung disease, cardiac diseases, sinus diseases, sleep-disordered breathing and miscellaneous lung diseases. While each separate diagnosis in the ‘other’ category was recorded in the database, these diagnostic codes were grouped together for data analysis to assess the spirometry bronchodilator response in comparison with the respirologist’s clinical diagnosis of asthma. Because of the patient population, the study observed COPD and bronchiectasis, and thus this led to the four diagnostic categories. For the purposes of the present study, all patients who had either an isolated diagnosis of asthma or a concomitant diagnosis of asthma were considered to have asthma for data analysis. The standard for asthma diagnosis was the staff respirologist’s recorded diagnosis based on an extensive consultation assessment (history, complete physical examination and spirometry) in the outpatient respirology clinic. A standard questionnaire was not used by the 10 respirologists because the present study was a retrospective real-life comparison of physician diagnosis with respect to ATS spirometry criteria. All 10 staff respirologists consented to the review of their patients’ data. Approval for the present study was obtained from the University of Saskatchewan Medical Research Ethics Committee.
Statistical analysis
SPSS version 12.0 (SPSS Inc, USA) was used for data entry and analysis. For the purpose of comparison, patients were divided into two categories – ‘asthma’ and ‘nonasthma’. The nonasthma group was further divided into ‘COPD’, ‘bronchiectasis’ and ‘other’. Two group comparisons of continuous data were performed using independent two-tailed t tests. ANOVA was used for three or more group comparisons. The Bonferroni correction for multiple comparisons was used. Frequency data were evaluated by χ2 testing. Comparison of varying levels of FEV1 and FVC response between diagnostic groups allowed the plotting of a receiver-operator characteristic (ROC) curve that was used to further assess the value of these diagnostic criteria.
RESULTS
Of the 310 adult respiratory clinic patients included in the present study, 168 (54.2%) were male. The mean age was 63.2 years (range 22 to 89 years). The clinical diagnoses represented in this population, as extracted from the respiratory clinic medical record, were divided into four general categories –asthma, COPD, bronchiectasis and ‘other’. The referring physician’s diagnosis correlated with the respirologist’s diagnosis for asthma in 94 of 169 patients, for COPD in 61 of 85 patients, for bronchiectasis in six of 13 patients and for ‘other’ diagnoses in 41 of 43 patients.
In the population as a whole, the mean FEV1 was 1.57 L (median 1.46 L, SD 0.67 [range 0.49 to 3.99]), the FVC was 2.91 L (median 2.78 L, SD 0.93 [range 1.35 to 6.15]) and the FEF(25%–75%) was 0.75 L/s (median 0.56 L/s, SD 0.58 [range 0.13 to 3.12]). Of the 310 patients (all meeting ATS bronchodilator response criteria), 273 had a prebronchodilator FEV1/FVC ratio of 70% or less, and 256 had an FEV1 less than 80% predicted.
The mean percentage improvement in FEV1 postbronchodilator for the total population was 18.66% (median 16.67, SD 6.35). The mean percentage improvement for FVC postbronchodilator was 13.25% (median 12.03, SD 8.00). The mean percentage improvement in FEF(25%–75%) postbronchodilator was 28.42 (median 25.53, SD 25.51). The mean values for these variables in each of the diagnostic categories are outlined in Table 1.
TABLE 1.
Mean percentage improvement in spirometry postbronchodilator by diagnosis
| Variable | Diagnosis | n | Mean ± SD | 95% CIs |
|---|---|---|---|---|
| FVC | Asthma | 169 | 14.02±8.09 | 12.79 to 15.24 |
| COPD | 85 | 13.65±8.59 | 11.80 to 15.50 | |
| Bronchiectasis | 13 | 10.75±6.96 | 6.55 to 14.95 | |
| ‘Other’ | 43 | 10.22±5.84 | 8.42 to 12.02 | |
| Total | 310 | 13.25±8.00 | 12.36 to 14.15 | |
| FEV1 | Asthma | 169 | 19.41±6.89 | 18.36 to 20.45 |
| COPD | 85 | 18.06±5.59 | 16.85 to 19.27 | |
| Bronchiectasis | 13 | 18.58±5.66 | 15.15 to 22.00 | |
| ‘Other' | 43 | 16.91±5.42 | 15.24 to 18.58 | |
| Total | 310 | 18.66±6.35 | 17.95 to 19.37 | |
| FEF(25%–75%) | Asthma | 169 | 29.28±25.27 | 25.45 to 33.12 |
| COPD | 85 | 17.12±19.88 | 12.84 to 21.41 | |
| Bronchiectasis | 13 | 39.79±26.28 | 23.91 to 55.68 | |
| ‘Other’ | 43 | 43.93±26.45 | 35.79 to 52.07 | |
| Total | 310 | 28.42±25.51 | 25.57 to 31.27 |
COPD Chronic obstructive pulmonary disease; FEF(25%–75%) Forced expiratory flow at 25% to 75%; FEV1 Forced expiratory volume in 1 s; FVC Forced vital capacity
The comparison of percentage improvements in these variables among these four diagnostic categories revealed significant differences between the groups. For percentage improvement in FEV1, no significant differences were observed by ANOVA among the four diagnostic groups (Figure 2). For percentage improvement in FVC, significant differences were observed among the asthmatic group and the ‘other’ group (P=0.035), and no significant differences in FVC were observed between the asthmatic group and the COPD or bronchiectasis groups (Figure 3). Comparison of percentage improvement in FEF(25%–75%) revealed significant differences between the asthmatic group and both the COPD and ‘other’ groups (P=0.002 and P=0.004, respectively) (Figure 4).
Figure 2).
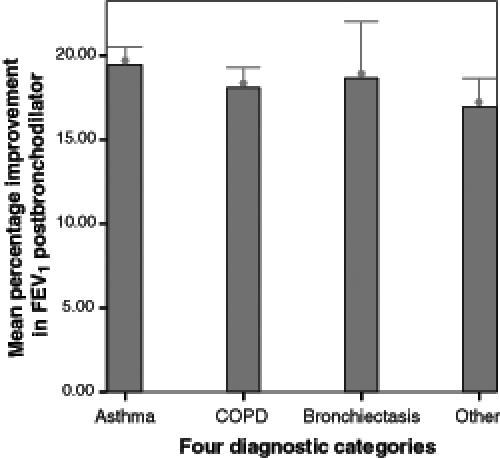
Mean percentage improvement in forced expiratory volume in 1 s (FEV1) postbronchodilator in diagnostic groups. Bars show means and error bars show 95% CI of mean. COPD Chronic obstructive pulmonary disease
Figure 3).
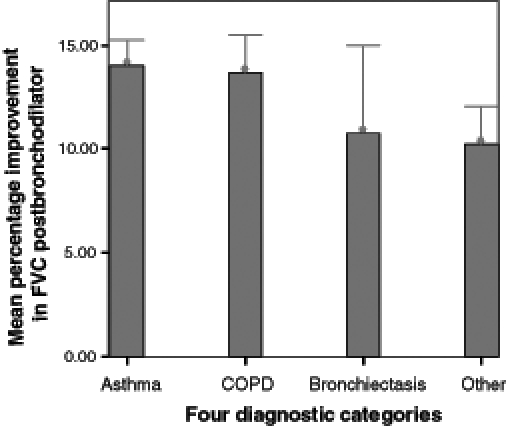
Mean percentage improvement in forced vital capacity (FVC) postbronchodilator in diagnostic groups. Bars show means and error bars show 95% CI of mean. COPD Chronic obstructive pulmonary disease
Figure 4).
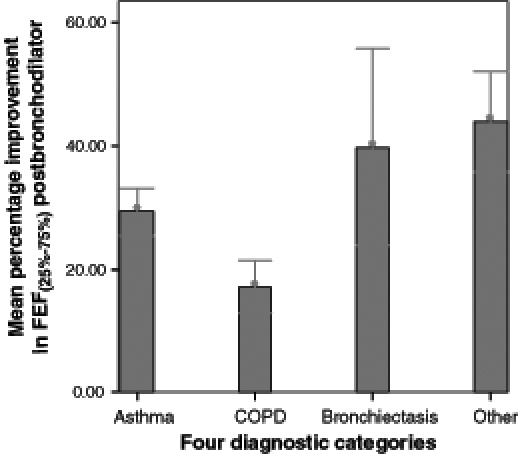
Mean percentage improvement in forced expiratory flow at 25% to 75% (FEF[25%–75%]) postbronchodilator in diagnostic groups. Bars show means and error bars show 95% CI of mean. COPD Chronic obstructive pulmonary disease
When the nonasthmatic diagnostic categories were collapsed into a single disease category, a mean percentage FEV1 postbronchodilator improvement of 17.82% (SD 5.51), mean percentage FVC improvement of 12.34% (SD 7.86) and mean percentage FEF(25%–75%) improvement of 27.53% (SD 25.89) was seen. When these values were compared with the asthma diagnostic group results, a difference between the percentage change in FEV1 (P=0.031) was observed. However, this finding loses significance when corrected for multiple comparisons. No significant differences were observed between percentage changes in FVC or FEF(25%–75%) between these two groups. The population was then divided into those patients who met both the FEV1 and the FVC criteria and patients who fulfilled just one of the two criteria. This comparison resulted in essentially equal numbers of patients in both the asthma and ‘nonasthma’ categories who met only one of the two ATS criteria. In the patients meeting both ATS criteria, 93 of 155 (60%) were diagnosed with asthma. This difference approached, but did not achieve, significance (P=0.06).
Then the diagnostic role of magnitude of bronchodilator responses was considered. Of the 310 patients meeting the 12% ATS criteria, 169 (54.5%) were clinically diagnosed with asthma. By increasing the requirement to 15% improvement in FEV1, 119 of 206 (57.8%) patients were diagnosed with asthma. Of the 96 patients meeting a 20% FEV1 improvement, there were 61 (63.5%) with diagnoses of asthma. When requiring a percentage increase of 12% or greater in FVC and 15% or greater in FEV1, there were 74 (60.2%) asthma patients of 123 patients. Within the confines of these arbitrary thresholds, the highest positive predictive value at the 20% improvement in FEV1 level was observed. However, in this population alone, all patients who met the ATS criteria for a 12% improvement postbronchodilator, placing the diagnostic cut-off point at 20% resulted in a positive predictive value of 63.5%, a negative predictive value of 49.5%, a sensitivity of 36.1% and a specificity of 75.2%.
An ROC curve (Figure 5) was used to further evaluate the relationship between diagnostic sensitivity and specificity of the ATS criteria (200 mL or greater, and 12% improvement) within this particular study population. Recalling that when a test contributes no diagnostic information, the area under the curve would equal 0.5, and that when a test has 100% sensitivity and specificity, the area would then equal 1.0, the value obtained for the area under the curve for percentage improvements in FEV1 was 0.569 (P=0.037), in FVC was 0.569 (P=0.036) and in FEF(25%–75%) was 0.517 (P=0.608). As shown in Figure 5, the ROC curve for each of these variables shadows the diagonal reference line.
Figure 5).
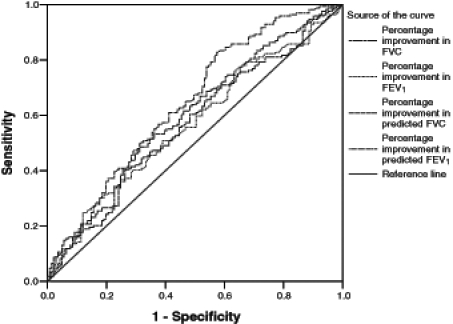
Receiver-operator characteristic curve. FEV1 Forced expiratory volume in 1 s; FVC Forced vital capacity
To correct for (between-subject) variations in baseline values, the data expressing the changes in FEV1 and FVC as percentages of the predicted value (rather than the percentages of baseline) were analyzed. Using the percentage prediction approach in patients who met strict criteria for airway obstruction at baseline (FEV1/FVC ratio of 70% or less, and FEV1 less than 80% predicted, n=213), there was an increase in the ROC area under the curve for a percentage change in FEV1 of 0.678 (P=0.000) and for a percentage change in FVC of 0.583 (P=0.038). For the whole population (n=310), there was a smaller magnitude of increase with a percentage change in FEV1 of 0.640 (P=0.000) and a slight increase in percentage in FVC of 0.598 (P=0.003). In addition, using the percentage difference in predicted FEV1, there were significant differences between the asthma and COPD groups using posthoc comparisons with ANOVA (P=0.000).
DISCUSSION
For many years, the definition of a ‘significant’ bronchodilator response has been controversial. The threshold at which the spirometric response criteria are set determines the prevalence of airway obstruction in the general population. In a recent large cross-sectional study, Viegi et al (10) showed clear differences between ‘clinical criteria’ and both European Respiratory Society and ATS definitions of airway obstruction. In that study population, the ATS criteria had the highest sensitivity but lowest specificity for any respiratory symptom or disease. Likewise, there is a variation in the clinical assessment of FEV1 bronchodilator response. In a recent Australian survey of laboratory testing practices for bronchodilator reversibility testing, Borg et al (11) found significant variation in methods used to assess and interpret bronchodilator response. Even with careful and consistent application of a single method for assessing bronchodilator response, there can be variation over time in the percentage improvement of FEV1 (12). In the Inhaled Steroids in Obstructive Lung Disease (ISOLDE) study population of moderate to severe COPD patients, investigators found that bronchodilator responsiveness was a continuous variable and over 52% of patients changed responder status between trimonthly physician visits (13). This further emphasizes the need to use spirometric criteria as a guide but not as an unimpeachable gold standard with which to make a diagnosis of asthma.
In our study population, relying on spirometric criteria alone was found to be inadequate in asthma diagnosis because only 54.7% of 310 patients meeting ATS bronchodilator response criteria were thought to be clinically asthmatic. By raising the threshold of FEV1 bronchodilator response from the 12% (provided it is 200 mL or greater) required by ATS criteria to 20%, there was a little improvement in the positive predictive value of the spirometric test results, increasing from 54.5% to 63.5%. This increased positive predictive value was associated with a low sensitivity of 36.1%. When the spirometry results of the asthmatic patients were compared with those from the COPD, bronchiectasis and ‘other’ disease categories, we saw no significant differences among groups for percentage improvement in FEV1, and only between the asthma group and ‘other’ group for percentage improvement in FVC. The ROC areas under the curve values for these variables, although statistically significant, are uncomfortably close to the diagonal reference line which represents a test that contributes no information. These study results suggest the current ATS criteria have relatively poor specificity for asthma in our population. Sensitivity of these current criteria was outside the scope of the present study because only patients actually meeting the pulmonary function testing criteria were included in the present study. Other epidemiologically based studies evaluating asthma diagnoses have found that a bronchodilator response gives a higher specificity but overall poor sensitivity (14,15).
It is notable that many patients who did not have a clinical diagnosis of asthma had what is considered a significant bronchodilator response. While it is well recognized that approximately 10% of the COPD population had a component of bronchodilator response (16), this does not explain the overall number of patient FEV1 responders in the ‘nonasthma’ group of the study. It seems a reassessment of what is considered a normal versus a ‘significant’ FEV1 bronchodilator response in diagnosis of reactive airway disease is required. Overall, in the present study, there is poor specificity and positive predictive value of the spirometric bronchodilator response.
Because the present study population was drawn from a tertiary care hospital pulmonary function testing laboratory and respirology subspecialty clinical practice, these findings may not be generalizable to other populations. Furthermore, the patient population included in the present study was heterogeneous with both new and long-standing respiratory clinic patients. Accordingly, varying degrees of pharmacotherapeutic intervention will have been used, hopefully with asthma-controlling benefits. It has been previously reported that fewer than 10% of asthmatic patients attending a tertiary referral respiratory clinic fulfill the typical spirometric inclusion criteria (which indicate suboptimal asthma control) for asthma drug trials (17). Thus, this anticipated superior control may result in a lesser degree of postbronchodilator improvement in established asthma patients, which would influence our results.
The present study was a retrospective analysis comparing a recorded clinical diagnosis of asthma with spirometric results from September 1999 to September 2004. The recorded clinical diagnoses were performed by experienced respirologists at a single site through the review of patient history and physical examinations. The spirometric data were available to these physicians at the time of the clinic visit and may potentially have influenced the clinical diagnosis. However, if so, one would expect the bias to be in favour of a diagnosis of asthma in this population who all met the ATS spirometry criteria for asthma. There were 10 different respirologists contributing to this data pool. Interobserver variation in diagnosis was not determined because patients had seen a single respirologist. It has been previously recognized that significant variation can exist among respirologists, both in the classification of obstruction and in the determination of bronchodilator response. In an Argentinean study (18) of 30 respirologists, the degree of disagreement for response to bronchodilator was 24%.
SUMMARY
While the ATS FEV1 and FVC criteria are helpful in the diagnosis of asthma, relying on spirometric criteria alone is inadequate. In the present study, only 54.7% of patients meeting the ATS bronchodilator improvement criteria were thought to have clinical asthma. The diagnosis of asthma depends upon a careful review of patient history and physical examination. Spirometric changes may be helpful in supporting the diagnosis, but the true significance of various levels of bronchodilator response remains unclear.
Footnotes
FUNDING: The authors thank The Lung Association of Saskatchewan for providing research support to Dr Hurst (The Lung Association of Saskatchewan Professorship) and Dr Cockcroft (Ferguson Professor of the Division of Respiratory Medicine).
REFERENCES
- 1.National Asthma Education and Prevention Program. Expert panel report 2: Guidelines for the diagnosis and management of asthma. <http://www.nhlbi.nih.gov/guidelines/asthma/asthgdln.pdf> (Version current at September 25, 2006).
- 2.Pauwels RA, Buist AS, Calverley PM, Jenkins CR, Hurd SS, GOLD Scientific Committee Global strategy for the diagnosis, management, and prevention of chronic obstructive pulmonary disease. NHLBI/WHO Global Initiative for Chronic Obstructive Lung Disease (GOLD) Workshop summary. Am J Respir Crit Care Med. 2001;163:1256–76. doi: 10.1164/ajrccm.163.5.2101039. [DOI] [PubMed] [Google Scholar]
- 3.Pellegrino R, Rodarte JR, Brusasco V. Assessing the reversibility of airway obstruction. Chest. 1998;114:1607–12. doi: 10.1378/chest.114.6.1607. [DOI] [PubMed] [Google Scholar]
- 4.Anthonisen NR, Wright EC. Bronchodilator response in chronic obstructive pulmonary disease. Am Rev Respir Dis. 1986;133:814–9. [PubMed] [Google Scholar]
- 5.Eliasson O, Degraff AC., Jr The use of criteria for reversibility and obstruction to define patient groups for bronchodilator trials. Influence of clinical diagnosis, spirometric, and anthropometric variables. Am Rev Respir Dis. 1985;132:858–64. doi: 10.1164/arrd.1985.132.4.858. [DOI] [PubMed] [Google Scholar]
- 6.Brand PL, Quanjer PH, Postma DS, et al. Interpretation of bronchodilator response in patients with obstructive airways disease. The Dutch Chronic Non-Specific Lung Disease (CNSLD) Study Group. Thorax. 1992;47:429–36. doi: 10.1136/thx.47.6.429. [DOI] [PMC free article] [PubMed] [Google Scholar]
- 7.Standardization of spirometry, 1994 update. American Thoracic Society. Am J Respir Crit Care Med. 1995;152:1107–36. doi: 10.1164/ajrccm.152.3.7663792. [DOI] [PubMed] [Google Scholar]
- 8.Pellegrino R, Viegi G, Brusasco V, et al. Interpretative strategies for lung function tests. Eur Respir J. 2005;26:948–68. doi: 10.1183/09031936.05.00035205. [DOI] [PubMed] [Google Scholar]
- 9.Morris JF, Koski A, Johnson LC. Spirometric standards for healthy nonsmoking adults. Am Rev Respir Dis. 1971;103:57–67. doi: 10.1164/arrd.1971.103.1.57. [DOI] [PubMed] [Google Scholar]
- 10.Viegi G, Pedreschi M, Pistelli F, et al. Prevalence of airways obstruction in a general population: European Respiratory Society vs American Thoracic Society definition. Chest. 2000;177:339S–45S. doi: 10.1378/chest.117.5_suppl_2.339s. [DOI] [PubMed] [Google Scholar]
- 11.Borg BM, Reid DW, Walters EH, Johns DP. Bronchodilator reversibility testing: Laboratory practices in Australia and New Zealand. Med J Aust. 2004;180:610–3. doi: 10.5694/j.1326-5377.2004.tb06121.x. [DOI] [PubMed] [Google Scholar]
- 12.Tweeddale PM, Alexander F, McHardy GJ. Short term variability in FEV1 and bronchodilator responsiveness in patients with obstructive ventilatory defects. Thorax. 1987;42:487–90. doi: 10.1136/thx.42.7.487. [DOI] [PMC free article] [PubMed] [Google Scholar]
- 13.Calverley PM, Burge PS, Spencer S, Anderson JA, Jones PW. Bronchodilator reversibility testing in chronic obstructive pulmonary disease. Thorax. 2003;58:659–64. doi: 10.1136/thorax.58.8.659. [DOI] [PMC free article] [PubMed] [Google Scholar]
- 14.Marabini M, Stopponi R, Matteucci G, et al. Reported diagnosis of previous asthma in a sample of the Italian general population. Monaldi Arch Chest Dis. 2001;56:299–303. [PubMed] [Google Scholar]
- 15.Lewis SA, Weiss ST, Britton JR. Airway responsiveness and peak flow variability in the diagnosis of asthma for epidemiological studies. Eur Respir J. 2001;186:921–7. doi: 10.1183/09031936.01.00211801. [DOI] [PubMed] [Google Scholar]
- 16.Nisar M, Earis JE, Pearson MG, Calverley PM. Acute bronchodilator trials in chronic obstructive pulmonary disease. Am Rev Respir Dis. 1992;146:555–9. doi: 10.1164/ajrccm/146.3.555. [DOI] [PubMed] [Google Scholar]
- 17.Cockcroft DW, Jokic R, Marciniuk DD, Fitzpatrick MF. The current dilemma with spirometric inclusion criteria for asthma drug trials. Ann Allergy Asthma Immunol. 1997;79:226–8. doi: 10.1016/s1081-1206(10)63006-2. [DOI] [PubMed] [Google Scholar]
- 18.Quadrelli SA, Roncoroni AJ, Porcel G. Analysis of variability in interpretation of spirometric tests. Respiration. 1996;63:131–6. doi: 10.1159/000196532. [DOI] [PubMed] [Google Scholar]