

Abstract
This protocol describes the essential steps of mass spectrometry-based analysis of protein samples that can be used to identify post-translational arginylation. We describe special considerations for sample preparation and digestion, mass spectrometry analysis using high precision instruments, database searching for the addition of N-terminal Arg, and multiple steps of automated and manual data validation. Data validation is especially important and involves automated data filtering, manual elimination of mass ambiguities, isotopic peak checking, and analysis of the ion fragmentation patterns of the putative arginylated peptides. Currently this protocol represents the only unambiguous method for identification of posttranslationally arginylated proteins and it can be used for identification of new arginylated proteins. This method gives a definitive answer on the identity of arginylated proteins and peptides in simple and complex protein preparations. It is recommended for studies of arginylation and can be applied to other poorly understood post-translational modifications.
Keywords: Post-translational modifications, protein arginylation, mass spectrometry
Introduction
Identification of new post-translational modifications has been a challenge in the development of mass spectrometry-based methods for detection of modified sites on proteins and peptides. While some of these modifications (e.g., phosphorylation) affect only specific amino acid residues with relatively low frequency of occurrence in an average protein, other modification (e.g., acetylation) affect less defined sites, such as free amino termini of any amino acid chain. It has been found that approximately 80% of eukaryotic proteins are N-terminally acetylated1 and that multiple other modifications occur on proteins in vivo. An emerging role on this list belongs to the recently characterized arginylation—post-translational addition of arginine onto the N-terminal amino group of proteins and peptides 2, 3. This modification had been recently found to be critical in many physiological processes in eukaryotes, including cardiovascular development, angiogenesis, cell motility, and general metabolic events, and has been proposed as a new regulatory mechanism of protein functions in vivo2, 4-6.
To fully understand the role of post-translational arginylation, sound analytical approaches are needed to insure the identification of true post-translational modification from potential artefacts. At present mass spectrometry is the only method for unambiguous identification of post-translationally arginylated sites on proteins. Such identification is complicated by the relative non-specificity of the modified sites, the presence of co-translationally incorporated arginines that are often difficult to distinguish from those incorporated post-translationally, and a variety of mass ambiguities that arise by other protein modifications. The N-terminal amino group of proteins and peptides in particular is very reactive and various chemical groups can be attached to the N-terminus in vivo and during sample preparation. In addition to naturally occurring acetylation, proteins and peptides during sample preparation can undergo modifications by carbamylation (which often occurs in samples prepared in the presence of urea), non-specific N-terminal alkylation (resulting from treatment with excessive amounts of iodoacetamide or other alkylation reagents), or glycylation (which can occur in samples treated with high concentrations of glycine, frequently used during immunoaffinity purifications and present in SDS PAGE buffers). These, and other modifications produce mass ambiguities that can mimic the addition of arginine onto the N-terminus of peptides and can confuse the results of the mass spectrometry analysis7.
The mass spectrometry-based protocol presented here has been developed during our recent work on global analysis of protein arginylation and identification of proteins arginylated in vivo2, 5, 6. This protocol involves restrictive conditions for sample preparation, high precision mass spectrometry instruments, and specialized search strategies, followed by automated and manual validation designed to eliminate mass ambiguities and preserve the maximum amount of true arginylated peptides (see the flow chart in Fig. 1 for the protocol outline). While this procedure is the only presently available method for unambiguous identification of arginylated sites on proteins and peptides, it also has certain limitations by being highly labor-intensive and costly, requiring state-of the-art mass spectrometry setup and multiple steps of automated and manual validation. Increased understanding of arginylation as a post-translational modification would lead to new possibilities in perfecting and simplifying arginylation detection methods. Improvement of the mass spectrometry-based detection of arginylation and complementing it with other methods of arginylation detection is among our immediate and longer-term research goals.
Fig. 1.

Flow chart outlining the general steps of the protocol.
The method described here can be applied, in principle, to the analysis of any N-terminal peptide modification, with the understanding of the specifics such as mass ambiguities and ionization patterns in each particular case.
Experimental Design
Sample preparation
In general, any protein solution can be used for the analysis described below. Normally we prepare proteins from cell lysates obtained in the presence of detergent, by sonication, or by grinding of frozen tissues in liquid nitrogen, however we have found little correlation between the specific lysis conditions used and the quality of the protein samples. The specific samples used in each experiment depend on the project goals and the available protein source and enrichment methods. Several considerations, however, should be kept in mind during sample preparation.
First, the probability of detecting arginylated peptides increases greatly with higher sequence coverage during mass spectrometry analysis. To achieve high sequence coverage it is recommended that samples with high protein abundance and low protein complexity be used whenever possible. Purified proteins should work best. However, we found that identification of arginylated peptides in samples containing hundreds of different proteins can also work well.
Second, protein purification and enrichment methods can affect the abundance of arginylated peptides. At present little is known about the percentage of each protein that gets arginylated in vivo and the specific conditions required for functional arginylation during normal metabolism and pathological processes in cells and tissues. It is also not known which conditions should be used to preserve or enrich the arginylated form of each protein during sample preparation. In our previous studies we performed immunoaffinity chromatography, using covalently immobilized antibodies against N-terminally arginylated peptides and non-glycine elution conditions, to obtain samples enriched in arginylated proteins2, however it appears likely that the use of other enrichment methods could in principle be just as successful.
Third, several types of conditions should be avoided during sample preparation. First, the presence of urea at any stage of sample preparation (for example, during protein solubilization or 2D gel analysis) results in non-specific carbamylation. We found that carbamylation of N-terminal Leu and Ile results in a mass shift that makes these two residues virtually indistinguishable from Arg (carbamylation of Leu/Ile: 156.0899, Arg: 156.1011). Therefore, urea should be avoided at all steps of sample preparation and analysis, and if urea has been used, arginylated peptides with preceding Leu/Ile in the (−1) position should be discarded (see Table 2 below listing the mass ambiguities that cannot be distinguished from arginylation). Second, the use of high concentrations of Gly, common during immunoaffinity purifications or SDS PAGE, could theoretically result in non-specific addition of glycine onto the free amino groups of the protein's N-terminus. We found that a combination of N-terminal Val+Gly equals the mass of arginine (Val+Gly: 156.0899), making it difficult to distinguish from N-terminal arginylation. Therefore, Gly should be avoided during the entire procedure. However, since Gly is also present in vivo and certain proteins contain naturally occurring Val+Gly combination at the N-terminus or adjacent to a proteolytic digestion site, all peptides containing N-terminal Val- or Gly-Val/Val-Gly sequence that also appear in the searches as arginylated on the residue immediately following this sequence should be omitted during target validation. Glycine ambiguity could also result from non-specific alkylation (Gly: 57.0215; Alkyl Group: + 57.0215) that occurs in the presence of high concentrations of reducing agents used for the modification of Cys residues.
Table 2.
Troubleshooting
| Step | Problem | Possible reasons | Solution |
|---|---|---|---|
| 1 | TCA precipitate is not visible | Sometimes TCA precipitate forms a thin film on the side of the tube rather than gathering at the bottom. | Carefully examine the tube for evidence of a thin layer of precipitate on one side. If the layer is definitely absent, it is possible that the protein abundance is insufficient for the mass spectrometry analysis (see below). |
| Low protein abundance | Repeat with higher protein amounts; low abundance samples are much less likely to yield good data in arginylation analysis. A minimum of 2 μg for single protein and 20 μg for complex protein solution is recommended. | ||
| 10 | Low sequence coverage after mass spectrometry run and initial database searching | Low protein abundance | Seek alternative purification methods to obtain higher protein yield. See also Troubleshooting for Step 1. |
| 11−12 | All or most positives do not pass automated data filtering | The peptide underwent another modification that produced a similar mass to arginine | Initial hits that do not pass automated data filtering should be discarded. |
| 14 | Peptides identified with high mass accuracy and without obvious ambiguities do not pass isotopic peak checking | The peptide underwent another modification that produced a similar mass to arginine | Hypothetically at some stages during MS analysis peptides may undergo unanticipated modifications, such as neutral loss of hydrogen that results in a mass shift of (−1). At present we discard the peptides that do not pass the isotopic peak checking even if they fit all the other criteria, however it is possible that in the future an explanation for such mass shifts can be found and peptides with mass shift of (−1) can be considered |
| 14 | Mass spectrum contains a mixture of ions that appears too complex for one peptide | In some cases, co-eluting peptides may have very similar mass to charge (m/z) values and appear in the same isolation window, resulting in isotopic envelopes for more than one peptide appearing together in the corresponding MS spectrum. | Check whether at least one of the measured masses in the isolation window matches to the calculated mass with the correct isotopic peak with an acceptable delta mass. In this case, the peptide is considered to be a putative true hit. |
| 15 | The absence of the first 5−6 b ions in the identifiable quantities in the mass spectrum. | The peptide underwent another modification that produced a similar mass to arginine (for example, acetylation of Asp). | B ions in the spectrum should be identified and compared to the theoretical masses for these ions. Consistently observed accuracy within 0.3 Da between the identified b ion masses and the theoretically calculated ones suggest that the peptide is truly arginylated. Absence or inaccuracy of b ion masses greater than 0.3 Da indicate a false positive that should be eliminated. |
| 15 | b ion masses are consistently borderline; some are within 0.3 Da of those theoretically predicted, while others differ by 0.3 Da or more | The peptide underwent another modification that produced a similar mass to arginine | Whenever comparison of calculated and observed b ion masses cannot give a definitive answer, standard peptides with similar sequence should be run under the same conditions and the spectra for the standard peptides should be compared to those in the real sample |
Additional consideration for sample preparation concerns the fact that addition of Arg is expected to change the protein's surface charge and isoelectric point. During some preparation methods, such as ion exchange chromatography, this may result in omitting of the arginylated protein fraction from the preparation due to its reduced binding, for example, to the anion exchange column or even a specific affinity reagent. Another reason for lower abundance or absence of arginylated protein in a preparation could arise from changes in its specific properties (such as, polymerization in the case of actin). Certain preparation methods (for example, cycles of polymerization and depolymerization routinely used during actin purification) could result in alteration or absence of the arginylated protein fraction from the resulting preparation.
For all these reasons, we recommend that mass spectrometry identification of arginylated sites on proteins should be performed on samples in solution, not subjected to treatment with urea and glycine and not fractionated by 1D or 2D electrophoresis or anion exchange chromatography. We also recommend caution with the use of proteins purified based on their specific in vivo properties, since such purification could unpredictably affect the fraction of arginylated protein in the preparation. Based on our experience, immunoaffinity isolation using affinity resins with covalently coupled antibodies (such as CNBr-Sepharose or Aminolink Agarose) and non-glycine high salt elution conditions (e.g., 3.5M MgCl2) work best.
Finally, it has been shown that in some cases proteins can be degraded upon addition of N-terminal arginine8. While in such cases arginylation may be a major and critically important step in the regulation of the biological activity of such proteins in vivo, mass-spectrometry-based identification of arginylated sites on these proteins would require preparation of these proteins in the presence of inhibitors of proteasome-dependent or independent degradation.
While proteins in solution at sufficiently high concentration in buffers that favor protease digestion can in principle be used, we recommend TCA precipitation of the protein sample before using it in the subsequent steps, because this method enables obtaining protein solution at a desired concentration in an appropriate buffer in one step.
It should be noted that many of the arginylated peptides have low abundance in vivo, and that in an average sample, without using special methods such as immunoaffinity chromatography to enrich for arginylated proteins, arginylated peptides may not be detected in each particular run, even if present in low quantities. Therefore, performing multiple runs with varied protein purification conditions should always be considered in this analysis.
Protein digestion
Generally the use of multiple proteases (for example, a combination of trypsin, subtilisin, and elastase) increases sequence coverage during mass spectrometry analysis. However, some of these proteases may destroy arginylated peptides by cutting immediately after the arginylated residue or producing peptides too short for reliable identification of arginylation. This is especially true for proteases with low specificity for proteolytic sites. We tried using multiple proteases for digestion and found that trypsin is the optimal enzyme (highly efficient and enabling the maximum sequence coverage during identification for the majority of proteins), despite its ability to cleave C-terminally of Arg in the amino acid chain. Our preliminary runs showed that the majority of arginylated peptides are still preserved during trypsin digestion, suggesting that trypsin possesses minimal or no exopeptidase activity and does not normally remove the N-terminal arginine from proteins and peptides. Endopeptidase LysC could also be used for digestion of specific proteins, however it is not efficient enough for large-scale analysis because it is more difficult to handle and cuts too selectively, often producing peptides too large for identification. However, Endo LysC should be used when possible for low complexity protein solutions and for confirmation of arginylated sites.
Mass spectrometry
Since elimination of mass ambiguities often requires detection of the precursor mass-to-charge ratio (m/z) with high accuracy, high-resolution mass spectrometers should be used whenever possible for the analysis of arginylated peptides.
Ideally, a high-resolution instrument, such as an Orbitrap, should be used for tandem mass spectrometry (MS/MS) analysis. However, sometimes it is necessary to use an LTQ instrument. The LTQ has a faster scan rate and is more sensitive than an Orbitrap, which can be advantageous because many of the arginylated peptides are found in low abundance in in vivo samples. Peptides identified with a lower mass accuracy instrument should always undergo manual validation (see below) and certain mass ambiguities (such as, acetylation of Asp, which results in a mass shift within 0.6 Da of the mass of arginine) cannot be easily resolved. Lower resolution mass spectrometry (MS1) analysis should be avoided if MS/MS analysis is performed with a low-resolution instrument, since the results of such runs cannot unambiguously differentiate among the possible combinations that match Arg. Data obtained with such instruments can still be correct, but the false positive rate is usually high and validation by independent methods would be needed to confirm arginylation of each peptide.
Database search
In principle any commercially available and/or user-developed programs for identifying of the addition of a fixed mass on a peptide's N-terminus could be used, such as SEQUEST9, Mascot10, X!Tandem11, or OMSSA12, but many factors should be accounted for in the development and use of such programs and the validation steps described below should always be performed on the list of initial positives to identify the true arginylation targets. Based on our experience, ProLuCID13 that we use in our analysis has better sensitivity and specificity for both modified and non-modified peptide identification compared to SEQUEST, Mascot, X!Tandem, and OMSSA. Thus, we recommend ProLuCID over other algorithms.
During our analysis we use ProLuCID to search for the addition of the specific mass of Arg (156.1011) in the ‘differential modification’ mode (i.e., assuming that each N-terminal site may or may not be modified by the addition of Arg), with no enzymatic cleavage conditions imposed on the database search.
ProLuCID searches yield the list of all peptides in the samples, with and without modifications. Usually the vast majority of the identified peptides are unmodified peptides. The unmodified peptides similar to those found with modifications could be helpful for manual data filtering to eliminate such ambiguities as Val+Gly or Arg present in the native protein's sequence at or adjacent to the N-terminus of the peptide (Table 1).
Table 1.
Common mass ambiguities that should be accounted for in the arginylation analysis
| −2 residue | −1 residue | −2 residue mass | −1 residue mass | Post-translational Modification (PTM) | PTM mass shift | Residue(s) + PTM mass | ΔM (amu) | ΔM (ppm) | ppm ΔM/1000 | ppm ΔM/2000 | ppm ΔM/3000 |
|---|---|---|---|---|---|---|---|---|---|---|---|
| V | G | 99.0684 | 57.0215 | None | 156.0899 | −0.0112 | −71.9534 | −11.2320 | −5.6160 | −3.7440 | |
| A | G | 71.0371 | 57.0215 | Formylation | 27.9949 | 156.0535 | −0.0476 | −305.1356 | −47.6320 | −23.8160 | −15.8773 |
| A | G | 71.0371 | 57.0215 | Dimethylation or ethylation | 28.0313 | 156.0899 | −0.0112 | −71.9534 | −11.2320 | −5.6160 | −3.7440 |
| G | A | 57.0215 | 71.0371 | Formylation | 27.9949 | 156.0535 | −0.0476 | −305.1356 | −47.6320 | −23.8160 | −15.8773 |
| G | A | 57.0215 | 71.0371 | Dimethylation or ethylation | 28.0313 | 156.0899 | −0.0112 | −71.9534 | −11.2320 | −5.6160 | −3.7440 |
| G | V | 57.0215 | 99.0684 | 156.0899 | −0.0112 | −71.9534 | −11.2320 | −5.6160 | −3.7440 | ||
| V | 99.0684 | Non-specific alkylation | 57.0215 | 156.0899 | −0.0112 | −71.9534 | −11.2320 | −5.6160 | −3.7440 | ||
| L/I | 113.0841 | Carbamylation | 43.0058 | 156.0899 | −0.0113 | −72.0687 | −11.2500 | −5.6250 | −3.7500 | ||
| N | 114.0429 | Acetylation | 42.0106 | 156.0535 | −0.0476 | −305.0267 | −47.6150 | −23.8075 | −15.8717 | ||
| N | 114.0429 | Guanidination | 42.0218 | 156.0647 | −0.0364 | −233.0669 | −36.3820 | −18.1910 | −12.1273 | ||
| N | 114.0429 | Trimethylation | 42.0470 | 156.0899 | −0.0112 | −71.9406 | −11.2300 | −5.6150 | −3.7433 | ||
| D | 115.0269 | Amidine | 41.0265 | 156.0535 | −0.0476 | −305.0651 | −47.6210 | −23.8105 | −15.8737 | ||
| Q | 128.0586 | Dimethylation or ethylation | 28.0313 | 156.0899 | −0.0112 | −71.9406 | −11.2300 | −5.6150 | −3.7433 | ||
| R | 156.1011 | None | 156.1011 | 0.0000 | 0.0000 | 0.0000 | 0.0000 | 0.0000 |
ΔM (Mass difference) = residue(s) + PTM mass shift − 156.1011
ΔM (ppm) = ΔM /156.1011*1000000
ppm ΔM/1000 = ΔM /1000*1000000, for peptides with mass of 1000 amu
ppm ΔM/2000 = ΔM /2000*1000000, for peptides with mass of 2000 amu
ppm ΔM/3000 = ΔM /3000*1000000, for for peptides with mass of 3000 amu
Data filtering
For automated data filtering we use two filters -- DTASelect2.0 followed by delta mass filtering.
For DTASelect2.0 filtering we use false positive rate parameter (fp) defined as the ratio of the number of reverse (i.e., false) hits to the number of forward (i.e., true) hits that passed the DTASelect filtering. We filter with the false positive rate setting of 0.1% (fp 0.001). To ensure that the false positive rate is constant in the searches for modified and unmodified peptides, DTASelect2.0 applies separate filtering to modified and unmodified peptides, considering the possibilities of tryptic, half tryptic and non-tryptic peptides (--modstat and --trypstat options of DTASelect2.0). One peptide serves as a requirement for the identification of a protein (-p 1) since we are looking for a specific modification feature of the protein rather than protein identification in the sample. Note that the high accuracy precursor mass information is not used in this step.
The deltaMassFilter program can effectively remove most simple ambiguities that result in a significant mass shift. For this filtering, the p-value for each peptide precursor mass is calculated as the delta mass (defined as the difference between the measured mass and the theoretical mass) for each modified peptide against the distribution of the delta masses of all the non-modified peptides (Fig. 2). For each modified peptide, the delta mass p-value defines the chance that the observed mass corresponds to this particular peptide and not a highly similar one created by a similar mass shift as a result of another modification. A true hit (i.e., truly arginylated peptide) is assumed to have delta mass distribution similar to the distribution of the unmodified peptides, as evidenced by sufficiently high p-value.
Fig. 2. Delta mass distribution of the peptides.

enables to establish the p-value cutoff for delta mass filtering, optimal for combine lower false positive rates with higher retention of arginylated peptides. Green and red lines identify p-value cutoffs of −0.05 and −0.0001, respectively.
Manual validation
The modified peptides that passed the DTASelect 2.0 and delta mass filter validation should then be analyzed manually (based on the mass shift in the UniMod database14, http://www.unimod.org/) to exclude more complicated ambiguities (Table 1). Following this step, isotopic peak checking and manual analysis of the b ion peaks in the mass spectrum should be performed.
The presence of the early b ions (especially b1-b3) of the correct masses in the ionization spectrum is a strong indication that this peptide is truly arginylated. The mass ambiguity exceptions to this rule are shown in Table 1 and these cannot be resolved by any validation method and should therefore be discarded from the final list of positives.
For biologically important peptides or difficult-to-resolve mass ambiguities we recommend, when possible, comparing the identified mass spectra to the mass spectra of synthetic peptides with identical sequence. Such a comparison can serve as the final proof that a peptide is truly arginylated. For example, in our previous work we compared standard peptides corresponding to the arginylated and acetylated N-terminal beta actin peptides to resolve the ambiguity between acetylated Asp (Ac-D: 157.03751) and Arg (156.1011), and differences in ion fragment masses as well as the abundance of the lower mass b ions were used to verify the arginylated peptide in the in vivo sample5.
Materials
Reagents
Protein sample in solution.
Trichloroacetic Acid (TCA) (Sigma Aldrich, Cat#T9159) (CRITICAL STEP do not store dry; prepare 100% solution immediately after arrival and store at 4°C)
Acetone (Thermo Fisher, Cat#BP2403−4) (store an ∼50 ml aliquot at −20oC)
Invitrosol LC/MS protein solubilizer (Invitrogen, Cat #MS10007)
Tris(2-carboxyethyl)phosphine hydrochloride (Sigma Aldrich, Cat #C4706)
Iodoacetamide (Sigma Aldrich, Cat #I1149)
Ammonium bicarbonate (Sigma Aldrich, Cat #11213)
Calcium chloride (Sigma Aldrich, Cat #12022)
Trypsin, mass spectrometry grade (Promega, Cat#V5280) (store at 4°C).
Endopeptidase Lys-C (Roche Applied Science, Cat# 11420429001) (store at 4°C).
Formic acid (J.T.Baker, Cat#0129−01)
Acetonitrile (Sigma Aldrich, Cat#00683)
Ammonium acetate (Sigma Aldrich, Cat#73594)
Dithiothreitol (DTT, Sigma Aldrich, Cat# 43815)
Equipment
Mass spectrometer (LTQ-Orbitrap or LTQ)
Software
Database search algorithms (SEQUEST, ProLuCID, DTASelect 2.0, deltaMassFilter)
Reagent setup
100% TCA solution (prepare by adding water to the TCA jar so that the final volume of the solution equals the weight of TCA in the jar, e.g. 250 ml for 250 g package of TCA).
Cold acetone solution (stored at −20°C)
Protein reduction solution 1M DTT in water (store at −20oC)
Protein alkylation solution 500 mM iodoacetamide in 100 mM ammonium bicarbonate and 10 mM Tris(2-carboxyethyl)phosphine hydrochloride pH 8.5 (freshly made)
Protein digestion solution 1 1 mg/ml trypsin solution in 50 mM ammonium bicarbonate and 5 mM CaCl2 (store in aliquots at −20oC; each aliquot after thawing can be used once)
Protein digestion solution 2 1 mg/ml endopeptidase Lys-C solution in 50 mM ammonium bicarbonate and 5 mM CaCl2 (store in aliquots at −20oC; each aliquot after thawing can be used once)
Peptide extraction buffer 5% formic acid (can be stored at room temperature for 1−4 months)
Peptide buffer for liquid chromatography MS/MS (Buffer A) 5% acetonitrile, 0.1% formic acid in water (can be stored at room temperature for 1−4 months)
Acetonitrile solutions for peptide elution from the column, Buffer B: 100% acetonitrile/0.1% formic acid in water; Buffer C: 500 mM ammonium acetate/5% acetonitrile/0.1% formic acid in water (can be stored at room temperature for 1−4 months)
Procedure
Sample preparation (Timing 3 hrs)
1] Precipitate protein solution with TCA as follows:
Add 1:10 volume of 100% TCA solution to the sample.
Vortex briefly and incubate on ice for 30 minutes.
Centrifuge at 13000g for 10 minutes.
Remove the supernatant.
Add 100% cold acetone to the protein pellet (acetone wash)
Centrifuge at 13000g for 10 minutes.
Repeat acetone wash and subsequent centrifugation 2 more times
Aspirate supernatant, air-dry the pellet.
<PAUSE POINT> TCA protein pellet can be stored at −20°C for up to several months.
2] Dissolve the TCA-precipitated protein sample in the protein solubilizer.
3] For reduction, add DTT to the final concentration of 10 mM, incubate 30 min at room temperature
4] For alkylation, add protein alkylation solution to the final concentration of 55 mM, incubate 20 min at room temperature in the dark. CRITICAL STEP: iodoacetamide is highly unstable and light sensitive. Solution needs to be made fresh and protein alkylation needs to be performed in the dark.
Protein digestion (Timing 1 hr-overnight.)
5] Digest protein solution with trypsin and/or endopeptidase Lys-C, added to the protein sample at 1:100 weight ratio (i.e., 1 μg of trypsin per 100 μg of protein in the sample). Longer digestion times, up to overnight, and higher enzyme ratios (1:20 for LysC and 1:50 for trypsin) can be used with higher complexity samples.
Mass spectrometry (Timing 1 hr – 24 hrs, depending on the complexity of the sample)
6] Stop the digestion reaction by adding of 5% formic acid to the protein digestion solution. Collect the soluble fraction containing the extracted peptides.
7] (optional) Concentrate the extracts on the Speedvac until only the insoluble peptide pellet remains.
8] (optional) Redissolve the pellet in the solution of 5% acetonitrile:0.1% formic acid.
9] Load the sample onto a reverse phase (RP) or strong cation exchange/RP MudPIT column and elute with a gradient of acetonitrile. For single proteins and low complexity samples a one-step linear 5%−100% acetonitrile gradient is typically used. For the analysis of complex samples using Multidimensional Protein Identification Technology (MudPIT15) see box 1 for a recommended 12-step gradient.
Database searching (Timing varies depending on the complexity of the sample and protein database size)
10] Analyze the results by database searching using ProLuCID or an equivalent program to identify the peptides in the sample and obtain the initial list of putative arginylated peptides.
CRITICAL STEP Depending on the sample preparation conditions, static modifications should be added into the search, e.g., for Cys in case of treatment with a reducing reagent. (+ 57.02146)
Automated data filtering (Timing varies depending on the complexity of the sample and protein database size, usually it takes a few minutes to a couple of hours for DTASelect, and less than one minute for deltaMassFilter)
11] Use DTASelect 2.0 algorithm16, 17 for automated data filtering of the results of the ProLuCID search to eliminate the initial set of the false positives.
12] Use deltaMassFilter on the data from step 9 for high mass accuracy filtering. Use the p-value setting -p 0.0001 or higher (lower p-value setting results in a higher number of false positives and less probability of eliminating a true positive by automated filtering; settings above –p 0.0001 are recommended).
Manual data validation (Timing varies depending on the number of positives in previous steps)
13] Manually analyze the identified arginylated peptides for possible mass ambiguities listed in Table 1. Discard the peptides, for which mass ambiguities cannot be resolved even with the high mass accuracy data (e.g., preceding R, preceding I/L if urea was used in the sample, preceding V, and preceding GV/VG sequence).
14] Validate the arginylated peptide spectra manually by isotopic peak checking. Manually view the precursor ion in the mass spectrum (MS spectrum) for each of these peptides in the Xcalibur Raw file using the Qual Browser program (Thermo Fisher) to see whether the theoretical isotopic peak agrees with the experimentally identified one. Spectra can be viewed by opening the Raw file with the Qual Browser and finding the corresponding scan numbers (as identified in the file produced after database searching) in the raw data.
For example, if the calculated mass (M) of the identified peptide is 1500, and the measured mass of the peptide is 1501, check the peak in the corresponding MS spectrum in the Raw file to confirm that the measured peak is indeed the M+1 peak, (which occurs if one of the carbons in the peptide is a heavy 13C; Figure 3). If the measured mass of the peptide is 1500, then confirm that the peak in the corresponding MS spectrum is a monoisotopic peak. If this cannot be confirmed, eliminate the corresponding peptides as false positives.
Fig. 3. Isotopic peak distribution for the identified arginylated peptide.
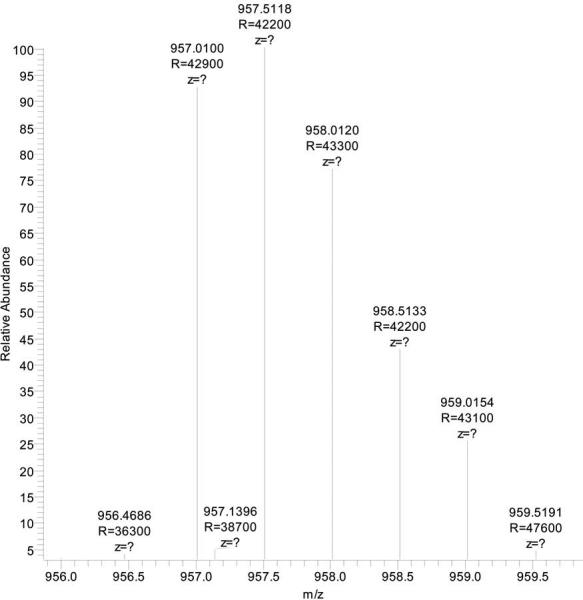
with the sequence K.(156.1011)VITAFNDGLNHLDSLK.G. The peptide has a calculated mass (M) of 1913.0245, and the measured mass 1914.0159, a ∼1 Da difference. The isolated doubly charged peak had a mass to charge ratio (m/z) of 957.5118, which is indeed an M+1 peak in the precursor isotopic peak envelope.
15] Check the ion fragmentation (MS/MS) spectrum for arginylated peptides in the Xcalibur Raw file using the Qual Browser program by manual viewing to identify the b ion series. Addition of N-terminal Arg onto peptides is expected to result in an altered pattern of fragment ions generated from the peptide's N-terminus (b ion series). Arginylated peptides usually have more prominent early b ions (corresponding to the lower mass fragments generated from the N-terminus) (Fig. 4)2, 5, 18, 19.
Fig. 4. An example of a mass spectrum for the identified arginylated peptide.

Mass spectrum for the arginylated peptide with the sequence RWIGLAEAMGTLMHAWAGSPK identified during our global analysis of protein arginylation target (image reprinted from2 where it has been published as Fig, 39 in the Supplemental Dataset S1). Note the abundance of the prominent b ions throughout the spectrum, especially in the early range.
16] Perform additional data validation as needed to verify the identified arginylated peptides, using the following options. CRITICAL STEP consider one or more of these options: (A) high resolution MS/MS analysis; (B) comparison of the identified spectra with the spectra of synthetic peptides with the same sequence; and (C) perform additional analysis to obtain more structural information on the peptides as outlined below.
A) Confirm arginylated peptides by high-resolution MS/MS analysis. However, if the abundance of the arginylated protein is low and high sensitivity is required, mass spectrometers with lower mass accuracy, such as LTQ, could be used for MS/MS, followed by extensive manual validation.
B) For ambiguous and/or biologically important peptides compare the spectrum found in the real sample with the spectrum of a synthetic peptide with the same sequence using the same instrument and the same conditions. To resolve each particular mass ambiguity, synthesize both arginylated and alternatively modified peptides and compare the real sample with both standards under the same conditions.
C) Obtain additional structural information on the peptides by triple quadrupole MS, PQD or MS3 mass analysis to detect the b1 ion corresponding to Arg residue fragmented off the N terminus.
TROUBLESHOOTING
Troubleshooting advice can be found in Table 2.
ANTICIPATED RESULTS
Following all these steps will result in the unambiguous mass-spectrometry-based identification of the peptides in the sample with Arg post-translationally added onto their N-terminus. This information could then be used to perform biological studies with these proteins in vivo.
Box 1. Recommended gradient conditions for the mass spectrometry of complex samples (step 9).
Complex samples should be loaded onto strong cation exchange/RP MudPIT column and eluted as a 12-step gradient. For each of the steps 1−11 we recommend the following conditions, using buffers A, B, and C as described in the Reagent setup:
1 min of 100% buffer A
5 min of X% buffer C (the 5 min buffer C percentages (X) are 10, 15, 20, 25, 30, 35, 40, 45, 50, 60% respectively for the 11-step analysis)
a 13 min 0−15% gradient of buffer B
a 107 min 15−45% gradient of buffer B
a 30 min 45−75% gradient of buffer B
a 5 min 75−100% gradient of buffer B
5 -- 20 min of 100% buffer A.
For the final (12th) step we suggest the following conditions:
3 min of 100% buffer A
20 min of 100% buffer C
a 10 min 0−15% gradient of buffer B
a 107 min 15−70% gradient of buffer B.
Acknowledgements
We thank Xuemei Han for performing some of the searches during the final stages of the development of the automated filtering criteria for arginylated peptides, Daniel Cociorva for help with optimizing DTASelect filtering conditions, members of the Kashina lab, Sougata Saha, Junling Wang, Reena Rai, and Fangliang Zhang for preparation the samples used in the mass spectrometry runs that defined the procedure described above. This work was supported by NIH grant 1R01HL084419-01A1, U.S. Army Research Program Award No. W81XWH-04-1-0879, and research award from W.W.Smith Charitable Trust to A.K., and by NIH grants P41 RR11823-09 and 5R01 MH067880 to J.R.Y.
Footnotes
COMPETING INTERESTS STATEMENTS
The authors declare no competing financial interests.
References
- 1.Brown JL, Roberts WK. Evidence that approximately eighty per cent of the soluble proteins from Ehrlich ascites cells are Nalpha-acetylated. J. Biol. Chem. 1976;251:1009–1014. [PubMed] [Google Scholar]
- 2.Wong CCL, et al. Global Analysis of Posttranslational Protein Arginylation. PLoS Biology. 2007;5:e258. doi: 10.1371/journal.pbio.0050258. [DOI] [PMC free article] [PubMed] [Google Scholar]
- 3.Kaji H, Novelli GD, Kaji A. A Soluble Amino Acid-Incorporating System from Rat Liver. Biochim Biophys Acta. 1963;76:474–477. [PubMed] [Google Scholar]
- 4.Kashina AS. Differential arginylation of actin isoforms: the mystery of the actin N-terminus. Trends Cell Biol. 2006;16:610–615. doi: 10.1016/j.tcb.2006.10.001. [DOI] [PubMed] [Google Scholar]
- 5.Karakozova M, et al. Arginylation of beta-actin regulates actin cytoskeleton and cell motility. Science. 2006;313:192–196. doi: 10.1126/science.1129344. [DOI] [PubMed] [Google Scholar]
- 6.Rai R, et al. Arginyltransferase regulates alpha cardiac actin function, myofibril formation and contractility during heart development. Development. 2008;135:3881–3889. doi: 10.1242/dev.022723. [DOI] [PMC free article] [PubMed] [Google Scholar]
- 7.Shen Y, et al. Proteome-wide identification of proteins and their modifications with decreased ambiguities and improved false discovery rates using unique sequence tags. Anal Chem. 2008;80:1871–1882. doi: 10.1021/ac702328x. [DOI] [PMC free article] [PubMed] [Google Scholar]
- 8.Varshavsky A. The N-end rule pathway of protein degradation. Genes Cells. 1997;2:13–28. doi: 10.1046/j.1365-2443.1997.1020301.x. [DOI] [PubMed] [Google Scholar]
- 9.Eng JK, McCormack AL, Yates JR., 3rd An Approach to Correlate Tandem Mass Spectral Data of Peptides with Amino Acid Sequences in a Protein Database. J Am Soc Mass Spectrom. 1994;5:976–989. doi: 10.1016/1044-0305(94)80016-2. [DOI] [PubMed] [Google Scholar]
- 10.Perkins DN, Pappin DJ, Creasy DM, Cottrell JS. Probability-based protein identification by searching sequence databases using mass spectrometry data. Electrophoresis. 1999;20:3551–3567. doi: 10.1002/(SICI)1522-2683(19991201)20:18<3551::AID-ELPS3551>3.0.CO;2-2. [DOI] [PubMed] [Google Scholar]
- 11.Craig R, Beavis RC. TANDEM: matching proteins with tandem mass spectra. Bioinformatics. 2004;20:1466–1467. doi: 10.1093/bioinformatics/bth092. [DOI] [PubMed] [Google Scholar]
- 12.Geer LY, et al. Open mass spectrometry search algorithm. J Proteome Res. 2004;3:958–964. doi: 10.1021/pr0499491. [DOI] [PubMed] [Google Scholar]
- 13.Xu T, Venable JD, Park SK, Cociorva D, Lu B, Liao L, Wohlschlegel J, Hewel J, Yates JR., IIIrd ProLuCID, a fast and sensitive tandem mass spectra-based protein identification program. Molecular & Cellular Proteomics. 2006;5:S174. [Google Scholar]
- 14.Creasy DM, Cottrell JS. Unimod: Protein modifications for mass spectrometry. Proteomics. 2004;4:1534–1536. doi: 10.1002/pmic.200300744. [DOI] [PubMed] [Google Scholar]
- 15.Washburn MP, Wolters D, Yates JR. Large-scale analysis of the yeast proteome by multidimensional protein identification technology. 2001;19:242–247. doi: 10.1038/85686. [DOI] [PubMed] [Google Scholar]
- 16.Tabb DL, McDonald WH, Yates JR., 3rd DTASelect and Contrast: tools for assembling and comparing protein identifications from shotgun proteomics. J Proteome Res. 2002;1:21–26. doi: 10.1021/pr015504q. [DOI] [PMC free article] [PubMed] [Google Scholar]
- 17.Cociorva D, D LT, Yates JR. Validation of tandem mass spectrometry database search results using DTASelect. Curr Protoc Bioinformatics. 2007 doi: 10.1002/0471250953.bi1304s16. Chapter 13, Unit 13 14. [DOI] [PubMed] [Google Scholar]
- 18.Tsaprailis G, et al. Influence of secondary structure on the fragmentation of protonated peptides. JOURNAL OF THE AMERICAN CHEMICAL SOCIETY. 1999;121:5142–5154. [Google Scholar]
- 19.Dongre A, Jones J, Somogyi A, Wysocki V. Influence of peptide composition, gas-phase basicity, and chemical modification on fragmentation efficiency: Evidence for the mobile proton model. JOURNAL OF THE AMERICAN CHEMICAL SOCIETY. 1996;118:8365–8374. [Google Scholar]