Abstract
Background/Aims
Non-alcoholic fatty liver disease (NAFLD) is a common health problem and includes a spectrum of hepatic steatosis, steatohepatitis and fibrosis. The renin–angiotensin system (RAS) plays a vital role in blood pressure regulation and appears to promote hepatic fibrogenesis. We hypothesized that increased RAS activity causes NAFLD due to increased hepatic oxidative stress.
Methods
We employed the transgenic TG(mRen2)27(Ren2) hypertensive rat, harboring the mouse renin gene with elevated tissue Angiotensin II (Ang II).
Results
Compared with normotensive Sprague–Dawley (SD) control rats, Ren2 developed significant hepatic steatosis by 9 weeks of age that progressed to marked steatohepatitis and fibrosis by 12 weeks. These changes were associated with increased levels of hepatic reactive oxygen species (ROS) and lipid peroxidation. Accordingly, 9-week-old Ren2 rats were treated for 3 weeks with valsartan, an angiotensin type 1 receptor blocker, or tempol, a superoxide dismutase/catalase mimetic. Hepatic indices for oxidative stress, steatosis, inflammation and fibrosis were markedly attenuated by both valsartan and tempol treatment.
Conclusions
This study suggests that Ang II causes development and progression of NAFLD in the transgenic Ren2 rat model by increasing hepatic ROS. Our findings also support a potential role of RAS in prevention and treatment of NAFLD.
Keywords: Angiotensin II, Oxidative stress, Non-alcoholic fatty liver disease
1. Introduction
Non-alcoholic fatty liver disease (NAFLD) has emerged as the most common liver disease in Western societies and affects up to 20% of the general population [1–4]. NAFLD encompasses a spectrum of liver disorders from simple hepatic steatosis to the more ominous non-alcoholic steatohepatitis (NASH) to end-stage of cirrhosis [2–6], which underlie development of hepatocellular carcinoma [7]. The overall survival of NAFLD patients is significantly lower than that of the general cohort population [8] and is predicted to become the leading indication for liver transplantation [9]. Clearly, an imbalance between the uptake, synthesis, oxidation and export of fatty acids results in excessive fat accumulation in the liver [2,10]. To date, there is no effective drug therapy for prevention and treatment of NAFLD.
The renin–angiotensin system (RAS) is integral in regulating blood pressure and cardiovascular homeostasis, and increased activity of RAS plays a crucial role in the pathogenesis of hypertension and cardiovascular disease [11]. RAS is widely expressed by various tissues/organs including the liver. Increased activation of both systemic and local RAS has been noted in the patients with cirrhosis [12] and chronic hepatitis C [13]. The blockage of the RAS significantly ameliorates hepatic fibrogenesis in animal models induced by methionine choline deficient diet, CCl4 or bile duct ligation [14–16], suggesting that RAS plays a role in hepatic fibrogenesis in these models. However, to date, there is no published study using a genetic model with excessive activity of RAS to directly evaluate its role on the development and progression of hepatic steatosis, inflammation and fibrosis. The transgenic TG(mRen2)27(Ren2) rat harbors the mouse Ren-2d renin gene and exhibits elevated renin and Ang II levels [17–19] with subsequent fulminant hypertension [20]. Thus, the Ren2 rat provides a unique animal model to directly explore the role of chronic endogenous elevations of tissue Ang II on the development of NAFLD. We hypothesized that Ang II in this model promotes development of NAFLD and that this effect is mediated by oxidative stress. We further hypothesized that the effects of Ang II in this model could be attenuated by in vivo treatment with AT1R blocker valsartan and the superoxide dismutase (SOD)/catalase mimetic tempol.
2. Methods
2.1. Animals and treatment
Male transgenic heterozygous (+/−) Ren2 and Sprague–Dawley (SD) rats were received from Wake Forest University (Winston-Salem, NC). All rats were maintained on Formulab Diet (5008, PMI® Nutrition International, LLC; Brentwood, MO) with free access to drinking water. At age of 9 weeks, Ren2 and SD rats were randomly assigned to untreated Ren2 control (RC) and SD control (SD) or Ren2-treated with valsartan (RV) supplied by Novartis (East Hanover, NJ) at 30 mg/kg/day or Ren2 with tempol (RT) purchased from Sigma–Aldrich Co. (St. Louis, MO) at 1 mM in their drinking water for 3 weeks. All animal procedures followed the University of Missouri animal care and use committees and NIH guidelines.
2.2. Systolic blood pressure (SBP) and total body weight (TBW) measurement
SBP was measured in triplicate using the tail-cuff method (Student Oscillometric Recorder, Harvard Systems) and TBW was obtained prior to and after treatment.
2.3. Histology analysis
Routine Hematoxylin–Eosin (H&E) and Sirius Red staining for collagen were performed in paraffin liver sections for histological analysis. Inflammatory cell infiltration was assessed by H&E staining for neutrophils and by immunostaining for T lymphocytes using anti-CD3 antibody. Oil Red O staining was performed in frozen liver sections for detecting the presence of fat. Hepatic steatosis was graded as reported [3,21] as follows: absent (score 0); or present in <33% of hepatocytes (score 1); in ≥33% but <66% of hepatocytes (score 2); or in ≥66% of hepatocytes (score 3).
2.4. Triglycerides (TG) content assay
Liver (30 mg) was homogenized in 1 ml of a solution (2:1 Chloroform: Methanol) and mixed up using a running wheel overnight at 4 °C. One millilier of 4 mM MgCl was added and mixed and centrifuged for 1 h at 1000g at 4 °C. Organic phase (500 μl, bottom phase) was removed into a fresh tube. After drying overnight, lipids were reconstituted in Butanol:Triton X-114 mix (3:2 vol:vol) and assayed for TG using spectrometer at 540 nm.
2.5. Serum alanine aminotransaminases (ALT) assay
The serum ALT levels were measured using analyzers from Olympus American Inc. (Center Valley, PA) and AU400e Chemistry Immuno Analyzer (Dallas, TX), following the manufacturer’s instructions.
2.6. ROS detection
Liver ROS generation was determined using lucigenin assay. Briefly, fresh liver tissue was homogenized in a buffer (250 mM sucrose, 0.5 mM EDTA, 50 mM HEPES, protease inhibitor tablet, pH 7.5) using glass/glass homogenizer and centrifuged at 1500g for 10 min at 4 °C. The supernatants (whole homogenate) were removed and 20 μL of whole homogenate was added to 0.68 mL of lucigenin working solution (50 mM KH2PO4, 150 mM sucrose, 1 mM EGTA, 5 μM lucigenin, 100 μM NADPH, pH 7.0). The samples were counted every 20 s for 10 counts on LB953 luminometer (lucigenin working solution dark adaptation for at least 1 h prior to use). Blanks were counted without whole homogenate. The counts of sample subtracted blanks and normalized to total protein.
2.7. Measurement of NADPH oxidase activity
NADPH oxidase activity was determined in plasma membrane fractions (PMF). Briefly, fresh liver tissues were homogenized on ice in homogenization buffer (50 mM phosphate buffer, 0.01 mM EDTA, 1 mM phenylmethylsulfonyl fluoride, 2 μM leupeptin, 2 μM pepstatin A, pH 7.4) using a Duall homogenizer. The homogenate was centrifuged at 1000g for 30 min at 4 °C and the supernatant further centrifuged at 13,000g for 20 min at 4 °C. The supernatant was centrifuged at 37,500g for 1 h at 4 °C. The resulting pellet was resuspended and centrifuged at 100,000g for 1 h at 4 °C. The final pellet (PMF) was resuspended in the buffer. Protein (50 μg) of PMF was incubated with NADPH (100 μM) at 37 °C. The NADPH oxidase activity was then determined by measuring the conversion of radical detector (Cayman Chemical, Ann Arbor, MI) using a spectrophotometer (Bio-Tek EL808) at 450 nm every 10 min for 1 h.
2.8. Superoxide dismutase (SOD) activity
SOD activity was determined by SOD detection kit (OxisResearch, Foster City, CA) according to the manufacturer’s instructions using a spectrophotometer at 525 nm. The enzyme activity was calculated from the ratio of the autoxidation rates in the presence (Vs) and in the absence (Vc) of SOD using a formula: SOD = 0.93 * (Vs/Vc−1)/1.073–0.073 * (Vs/Vc) and normalized to protein concentration.
2.9. Immunohistochemistry
Liver sections were incubated with primary antibody for CD3, 4-HNE, NADPH oxidase subunits (gp91, p47, Rac1), or TNF-α (1:200) (Alpha Diagnostic International Inc., San Antonio, TX; Santa Cruz Biotechnology, Santa Cruz, CA). After washing, a second antibody conjugated with alex-586 was applied and mounted with DAPI (Vector) or biotin conjugated second antibody, follow by 0.3% H2O2, ABC (Vector), NovaRed (Vector), and counterstained with hematoxylin. Images were obtained with a light and fluorescence microscope (Nikon).
2.10. RT-PCR amplification
Collagen α1 mRNA expression was measured by RT-PCR using primers, forward: GTGCTAAAGGTGCCAATGGT, reversed: ACCAGGTTCACCGCTGTTAC. TNF-α: forward, TGGCCCAG ACCCTCACACTC, reversed, CTCCTGGTATGAAATGGCAAA TC. To determine the relative initial amounts of collagen α1 cDNA, the cDNA sample was serially diluted 1:5 and 1:25. GAPDH was used as a housekeeping gene to verify that the same amount of RNA was amplified. The intensities of PCR products were analyzed using a digital imaging system (Kodak).
2.11. Western blot
Twenty micrograms of protein from liver tissue was loaded in SDS–PAGE gel and probed with primary antibodies (1:1000) against CRP (R&D Systems, Minneapolis, MN), 4-HNE, and NADPH oxidase subunit p67 (Santa Cruz Biotechnology, Santa Cruz, CA). After washing, the membrane was incubated with HRP-conjugated secondary antibodies (1:10,000). The intensities of the immunoblot bands were quantified using Quantity One software (Bio-Rad).
2.12. Terminal desoxynucleotide transferase-mediated dUTP nick end labeling (TUNEL)
To evaluate apoptotic cell death, TUNEL was performed in liver sections using In Situ Apoptosis Detection Kit (Roche Applied Science, Indianapolis, IN) as per the manufacturer’s instructions. TUNEL- positive and -negative nuclei were counted at five random fields. Results are expressed as number of TUNEL-positive cell/total cells ×100%.
2.13. Statistical analysis
All data are reported as means ± SEM. Student’s t-test or One-way ANOVA test was used to determine the significance among groups. A value of p < 0.05 was considered to be statistically significant.
3. Results
3.1. Characteristics of animals studied
Consistent with previous reports [20,22], Ren2 rats developed significant hypertension compared with age matched SD rats (p < 0.01, Table 1). Treatment with valsartan, but not tempol, significantly reduced SBP in the Ren2 (Table 2). There were no statistical differences of body weight between Ren2 and SD rats in all age groups (p > 0.05, Tables 1 and 2).
Table 1.
Experimental parameters and hepatic steatosis score for SD and Ren2 Rats
| Rat | Age (weeks) | Numbers | Body weight (g) | SBP (mmHg) | Steatosis score | TG (mmol/g) | ALT (U) |
|---|---|---|---|---|---|---|---|
| SD | 9 | 5 | 256 ± 9.7 | 140 ± 3.8 | 0 | 0.57 ± 0.03 | 16 ± 2.7 |
| Ren2 | 9 | 5 | 254 ± 7.3 | 190 ± 3.0 | 0.6 ± 0.27 | 0.94 ± 0.18 | 29 ± 3.9 |
| p = 0.92 | p < 0.01 | p < 0.05 | p < 0.05 | p < 0.05 | |||
| SD | 12 | 5 | 364 ± 5.6 | 105 ± 3.8 | 0.2 ± 0.23 | 0.58 ± 0.05 | 14 ± 2.0 |
| Ren2 | 12 | 5 | 357 ± 12 | 200 ± 8.4 | 1.26 ± 0.23 | 1.41 ± 0.07 | 51 ± 12 |
| p = 0.87 | p < 0.01 | p < 0.01 | p < 0.01 | p < 0.01 |
Values are means ± SEM. SBP, systolic blood pressure; TG, liver triglycerides content; ALT, serum alanine aminotransaminases.
Table 2.
Experimental parameters for Ren2 rats treated with valsartan or tempol
| Treatment | Age (weeks) | Numbers | Body weight (g) | SBP (mmHg) | Steatosis score | TG (mmol/g) | ALT (U) |
|---|---|---|---|---|---|---|---|
| Untreated | 12 | 6 | 369 ± 16 | 197 ± 11 | 1.36 ± 0.38 | 1.41 ± 0.07 | 51 ± 12 |
| Valsartan | 12 | 7 | 364 ± 12 | 143 ± 13* | 0.42 ± 0.26* | 0.70 ± 0.06** | 14 ± 3** |
| Tempol | 12 | 6 | 369 ± 14 | 190 ± 14 | 0.38 ± 0.26* | 0.54 ± 0.18*,*** | 22 ± 6** |
Values are mean ± SEM. SBP, systolic blood pressure; TG, liver triglycerides content; ALT, serum alanine aminotransaminases.
P < 0.01 vs. Untreated group.
P < 0.05 vs. Untreated group.
p < 0.05 vs. Valsartan group.
3.2. Ren2 rats develop progressive NAFLD associated with oxidative stress
3.2.1. Hepatic steatosis in Ren2 rat
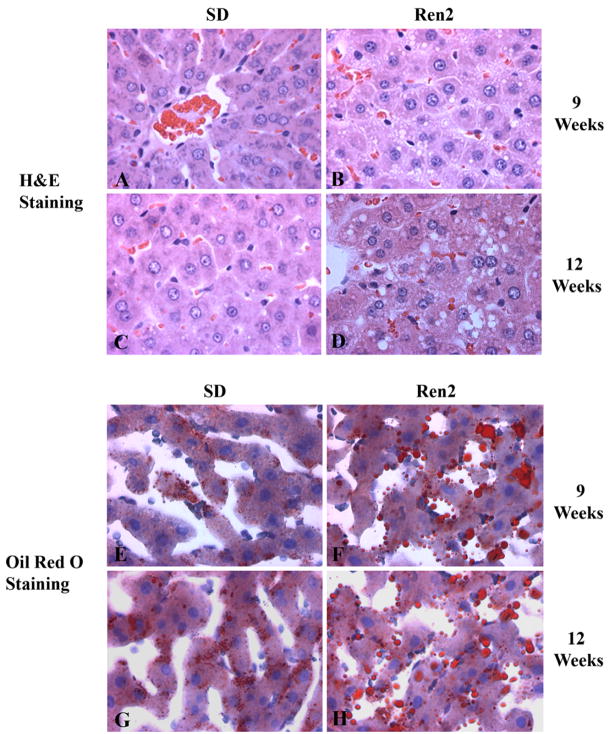
Hepatic steatosis was evaluated in 9 and 12 weeks Ren2 and SD rats (5 rats/group) using H&E staining after overnight fasting. Ren2 livers exhibited an increased fat accumulation within hepatocytes compared to SD rats at age 9 weeks that was more severe at 12 weeks, with mixed macro- and micro-vesicular patterns (Fig. 1A–D). Oil red O staining confirmed fat accumulation in Ren2 livers compared to SD (Fig. 1E–H). The Ren2 rats had higher hepatic steatosis score (0.6 ± 0.27 vs. 0, p < 0.05) at age 9 weeks and that was more marked at age 12 weeks (1.26 ± 0.23 vs. 0.2 ± 0.23, p < 0.01) compared to age matched SD rats, respectively (Table 1). This observation was further confirmed by a significant increase of hepatic TG content in Ren2 livers compared with SD controls at 9 weeks (0.94 ± 0.18 vs. 0.57 ± 0.03 mmol/g, p < 0.05) and 12 weeks of age (1.41 ± 0.07 vs. 0.58 ± 0.05 mmol/g, p < 0.01) (Table 1).
Fig. 1.
Hepatic histopathological analyses. Representative liver sections obtained from SD and Ren2 rats at age 9 and 12 weeks and stained with H&E (A–D) and oil red O (E–H). SD liver sections showed minimal lipid droplets when stained with H&E (A and C) and confirmed by Oil Red O staining (E and G, red). Ren2 liver sections stained with H&E showed prominent hepatic steatosis (B and D) which was confirmed by Oil Red O staining (F and H, red). Magnification 400×.
3.2.2. Hepatic inflammation in Ren2 rat
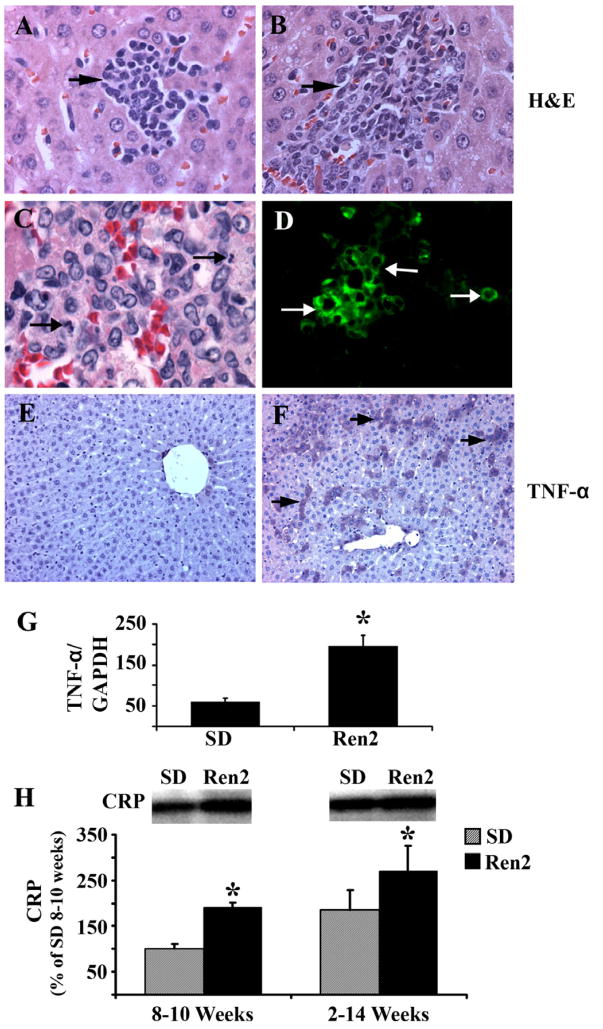
There were local foci of inflammatory cells in Ren2 livers at age 9 weeks (Fig. 2A) with more inflammatory cells infiltrate at age 12 weeks (Fig. 2B) including neutrophils (Fig. 2C) and CD3+ T lymphocytes (Fig. 2D), whereas no or minimal inflammatory cells were noted in SD livers (data not shown). Hepatic inflammation in 12 weeks Ren2 rats was further evaluated by assessment of TNF-α and C-reactive protein (CRP) expression in liver tissue utilizing immunostaining, RT-PCR and Western blot analyses. TNF-α triggers the production of other cytokines that together recruit inflammatory cells, induce hepatocyte death, and initiate fibrogenesis [23]. CRP is an independent predictor of inflammation state, which has been used as a biomarker for the screening of NASH. Both TNF-α (protein and mRNA levels, Fig. 2F and G, respectively) and CRP expression (Fig. 2H) were upregulated in Ren2 livers compared with SD controls (Fig. 2E,G,H). Serum levels of ALT were significantly increased in Ren2 rats compared with SD controls (Table 1).
Fig. 2.
Assessment of hepatic inflammation. (A and B) Representative liver sections obtained from Ren2 rats stained with H&E and showed progressive increase in clusters of inflammatory cell infiltrates in Ren2 rats (A, 9 weeks; B, 12 weeks; arrows). (C and D) Representative liver sections obtained from Ren2 rats at 12 weeks of age demonstrating neutrophils (C, arrow) and CD3+ T lymphocytes (D, green). (E and F) Representative immunostaining microphotographs showed increased TNF-α expression in 12-week Ren2 liver (D, purple, arrows) compared with the SD control (C). (G) The Bar graph showed hepatic TNF-α mRNA expression standardized to internal control (GAPDH) expression in 12-week-old Ren2 and SD rats. (H) Representative immunoblot analyses for C-reactive protein (CRP) with bars representing band densitometry in livers obtained from 9- and 12-week-old Ren2 and SD rats. Magnification: A and B, 400×; C, 1000×; D, 600×; E and F, 100×. The results are means ± SEM for 4–5 rats for each group, *p < 0.05, Ren2 vs. SD controls.
3.2.3. Hepatic fibrosis in Ren2 rat
Liver fibrosis was assessed by detecting collagen deposition by Sirius Red staining (Fig. 3A–D) and measuring collagen mRNA expression by RT-PCR (Fig. 3E). Compared with SD, Ren2 liver showed early fibrosis at 9 weeks (Fig. 3B) that became marked at 12 weeks of age (Fig. 3D). Collagen deposition in Ren2 liver was mainly observed in zone 3 and the periportal area. Pericellular fibrosis (Fig. 3D) and zone 3 bridging fibrosis (data not shown) were also noted in the Ren2 liver. Collagen α1 mRNA expression was significantly increased in Ren2 liver compared with SD rats at age 12 weeks (Fig. 3E).
Fig. 3.
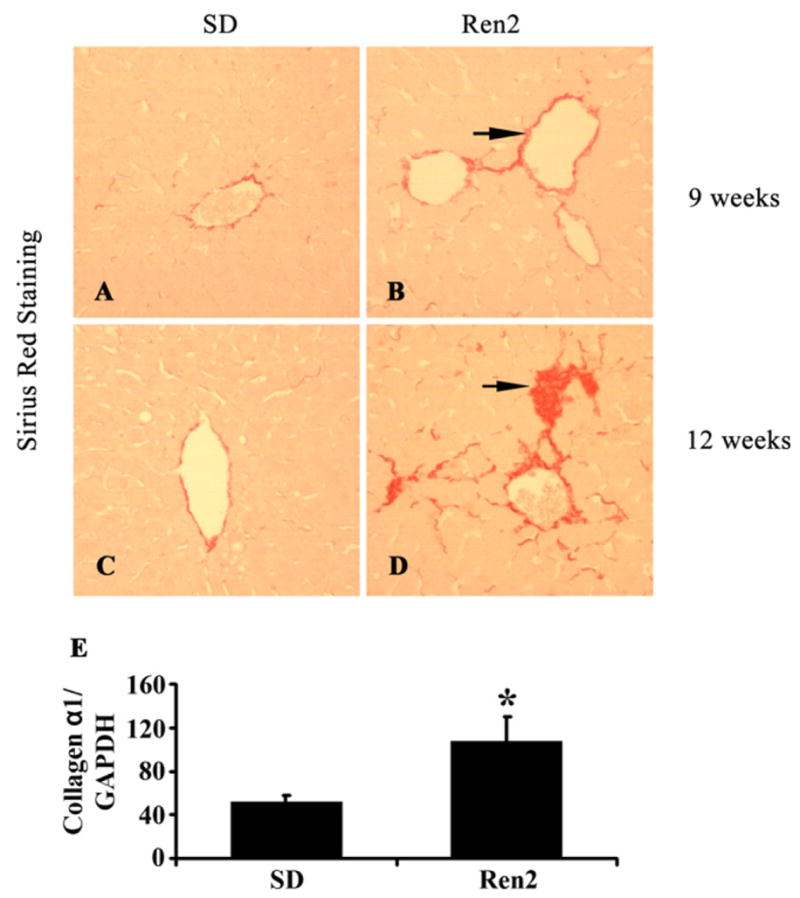
Assessment of hepatic fibrosis. (A–D) Representative Sirius Red staining showed progressive hepatic fibrosis in Ren2 livers at age 9 and 12 weeks (red, arrow). Ren2 liver sections (B and D, red) showed a marked increase of collagen accumulation compared with SD livers (A and C). (E) RT-PCR showed increased collagen type 1 (α1) mRNA expression in Ren2 livers compared with SD controls at 12 weeks of age. Magnification 100×. The results are means ± SEM for 4–5 rats for each group, *p < 0.05, Ren2 vs. SD controls.
3.2.4. Hepatic apoptosis in Ren2 rat
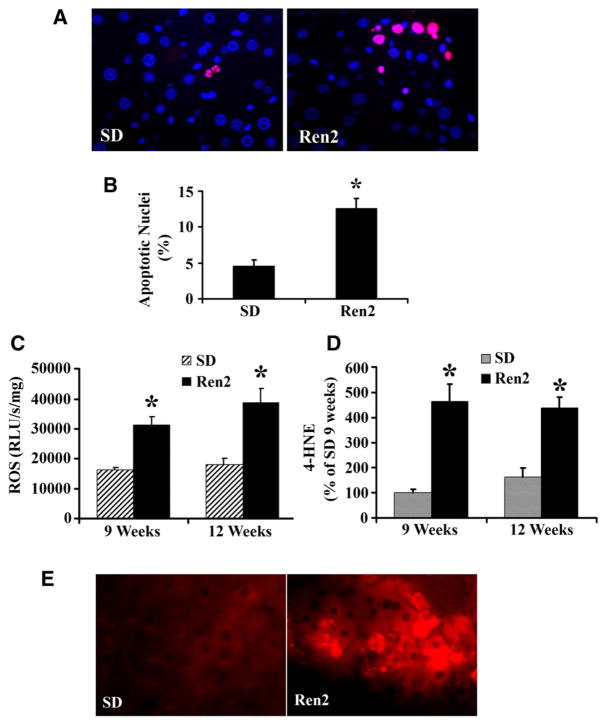
Liver cell apoptosis is an important mechanism for hepatocyte elimination and is a useful biomarker to monitor disease severity in NAFLD [24]. Increased TNF-α and ROS formation could induce cell apoptosis contributing to liver injury in Ren2 rats. There were more apoptotic cells (percentage TUNEL-positive nuclei) in Ren2 livers compared with SD livers at age 12 weeks (Fig. 4A and B). Apoptotic cell deaths in Ren2 livers were mainly located in zone 3.
Fig. 4.
Assessment of hepatic apoptosis and hepatic oxidative stress. (A) Representative TUNEL staining showed increased apoptotic cells in Ren2 liver sections compared with SD controls at age 12 weeks (red for apoptotic nuclei; blue for nuclear stained with DAPI). (B) The bars represented the ratio of TUNEL-positive/negative as counted at five random fields in liver sections obtained from 12-week-old Ren2 and SD rats. (C) ROS were detected by the lucigenin assay as described in 2; there was significant increase in the ROS formation in the Ren2 livers compared with SD controls at ages of 9 and 12 weeks. (D) Oxidative stress marker 4-HNE detected by Western blot, the bar graphs represented band densitometries at ages of 9 and 12 weeks. (E) Representative immunofluorescent photomicrographs for oxidative stress marker 4-HNE (red) showed increased staining intensity in Ren2 livers compared with SD controls at age 12 weeks. The results are means ± SEM for 4–5 rats for each group, *p < 0.01, Ren2 vs. SD controls. Magnification: 400×.
3.2.5. Hepatic oxidative stress in Ren2 rat
Compared with SD rats, Ren2 livers exhibited significantly increased ROS production at ages of 9 and 12 weeks (p < 0.01, Fig. 4C) by lucigenin assay, suggesting a contribution of Ang II to liver ROS formation. 4- HNE is considered to be a reliable index of the deleterious effects of ROS on various cellular components including membranes, proteins and DNA. There was a significant increase of 4-HNE in Ren2 livers compared with SD by immunoblot (p < 0.05, Fig. 4D) and immunofluorescent (Fig. 4E) analyses.
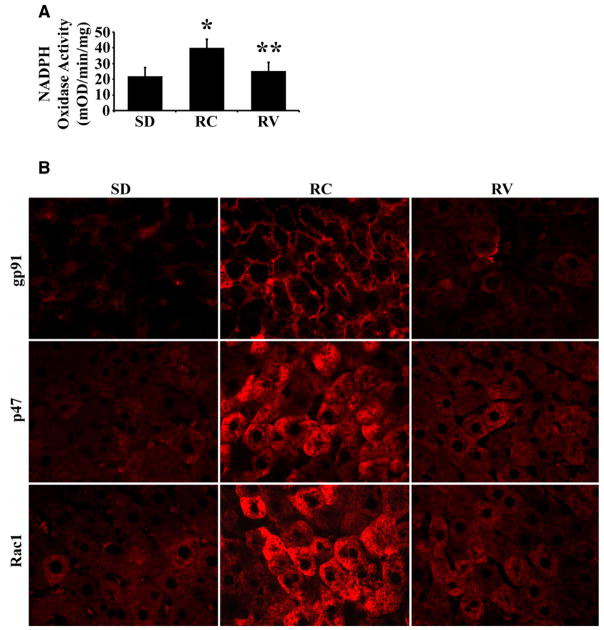
To investigate the source of ROS in liver, we measured NADPH oxidase activity in livers of Ren2 (n = 6) and control SD (n = 6) rats at 12 weeks of age. NADPH oxidase is a highly regulated membrane-bound enzyme complex that catalyzes the one-electron reduction of oxygen to superoxide anion. NADPH oxidase is composed of membrane-bound subunits (p22 and gp91) and the cytosolic subunits p47, p67, p40 and Rac1 [25]. Ren2 livers had markedly increased levels of NADPH oxidase activity (Fig. 5A, p = 0.01). Further, expression of gp91, p47 and Rac1 in Ren2 livers was significantly increased by immunofluorescent staining (Fig. 5B) compared with SD rats. In addition, Western blot analysis showed that p67 protein levels were markedly increased (>2-fold) in Ren2 livers compared with SD rats (p < 0.01, data not shown). Measurement of the antioxidant enzyme SOD activity revealed a reduced level in Ren2 livers compared with SD rats (1.6 ± 0.7 vs. 3.9 ± 1.8 U/mg) that was not statistically significant (p = 0.26). These results suggest that NADPH oxidase is a critical source for Ang II-induced oxidative stress in Ren2 livers.
Fig. 5.
Measurement of NADPH oxidase activity and expression. (A) NADPH oxidase activity was significantly increased in Ren2 livers compared with SD, treatment with valsartan attenuated the enzyme activity. (B) Representative immunofluorescent photomicrographs for NADPH oxidase subunit gp91, p47 and Rac1 expression (red) showed increased staining intensity in Ren2 livers compared with SD controls; treatment with valsartan deceased the expression of gp91, p47 and Rac1. The results are means ± SEM for 6 rats for each group at 12 weeks of age, *p < 0.05 Ren2 control (RC) (untreated) vs. SD, **p < 0.05 Ren2 valsartan (RV) vs. RC. Magnification: 400×.
3.3. AT1R blocker valsartan attenuates the development of NAFLD in Ren2 rats
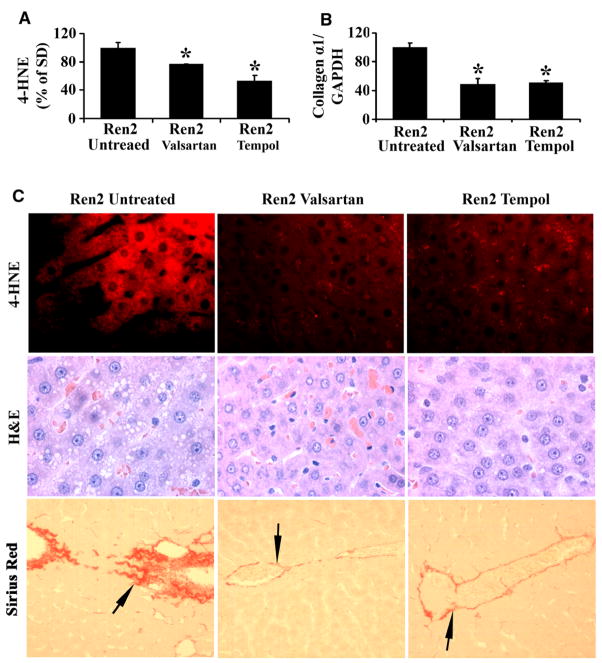
To further determine the causative relationship between Ang II and the development of NAFLD, 9-week Ren2 rats were treated with AT1R blocker valsartan for 3 weeks as described under Section 2. Treatment with valsartan markedly reduced both NADPH oxidase activity (Fig. 5A, p < 0.05) and expression of NADPH subunits gp91, p47, Rac1 (Fig. 5B) and p67 (data not shown), and significantly ameliorated oxidative stress in Ren2 livers assessed by immunoblot (Fig. 6A) and immunofluorescent staining (Fig. 6C) for 4-HNE. Valsartan treatment substantially attenuated liver steatosis in 12-week-old Ren2 rats, as shown in Fig. 6C (H&E panel) and Table 2. The steatosis score (0.42 ± 0.26 vs. 1.36 ± 0.38, p < 0.01) and liver TG (0.70 ± 0.06 vs. 1.41 ± 0.07, p < 0.05) at age 12 weeks were significantly reduced in the valsartan-treated Ren2 group compared with the untreated Ren2 littermates, respectively (Table 2). Valsartan treatment also decreased hepatic collagen α1 mRNA expression in Ren2 livers (Fig. 6B) and collagen deposition (Fig. 6C). In addition, liver apoptotic cell deaths and TNF-α mRNA expression were markedly attenuated (Fig. 7A and B) and serum ALT was dramatically decreased by valsartan treatment (Table 2). There were significant reduction of systolic blood pressure and no significant differences of body weight between the valsartan-treated and -untreated Ren2 groups (Table 2). These results suggest that elevated expression of Ang II caused NAFLD in Ren2 rats.
Fig. 6.
Assessment of hepatic steatosis, fibrosis, and oxidative stress in valsartan-treated, tempol-treated, and -untreated 12-week-old Ren2 rats: (A) Oxidative stress marker 4-HNE detected by Western blot, the bars represented band densitometries of hepatic 4-HNE expression. Ren2 values expressed as percentage of the values obtained from control untreated SD rats. (B) RT-PCR of collagen α1 gene expression standardized to internal GAPDH control in Ren2 livers compared with SD controls at age 12 weeks. (C) Representative immunofluorescent photomicrographs for 4-HNE (Red) showed reduced staining intensity in valsartan and tempol-treated Ren2 rats compared with untreated Ren2 livers (4-HNE panel, red); representative H&E liver sections showed reduced hepatic steatosis in both valsartan and tempol treatments compared with untreated Ren2 littermates (H&E panel); representative Sirius Red staining sections showed reduced hepatic fibrosis in the treated groups for valsartan and tempol compared with untreated Ren2 littermates (Sirius Red staining panel, red, arrow). The results are means ± SEM for 4–5 rats for each group, *p < 0.05 Ren2 valsartan or Ren2 tempol vs. Ren2-untreated. Magnification: 4-HNE and H&E, 400×; Sirius Red, 100×.
Fig. 7.
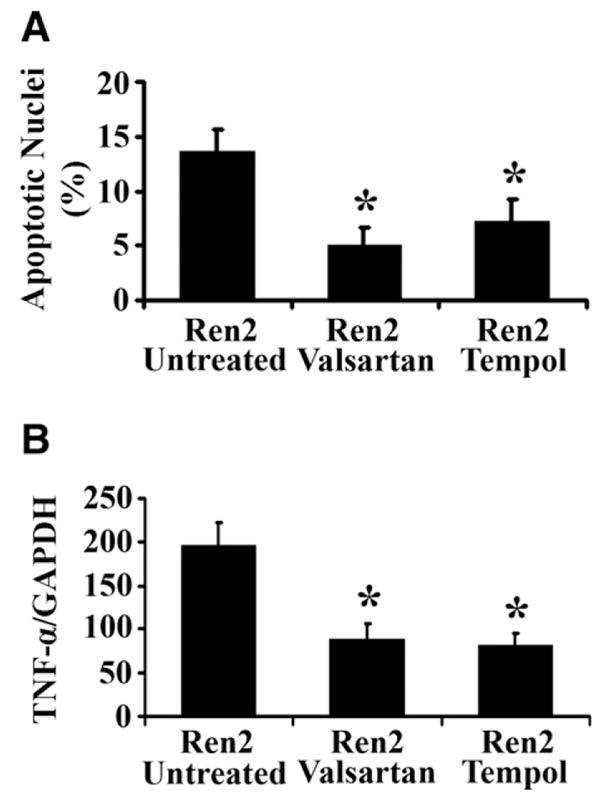
Hepatic apoptosis and TNF-α mRNA expression in 12-week-old Ren2 rats treated with valsartan or tempol. (A) Bars represent the ratio of TUNEL-positive/negative as counted at five random fields. (B) Bars represent TNF-α mRNA expression by RT-PCR standardized to internal GAPDH control expression at age 12 weeks. The results are means ± SEM for 4–5 rats for each group, *p < 0.05 Ren2 valsartan or Ren2 tempol vs. Ren2-untreated.
3.4. ROS scavenger tempol attenuates the development of NAFLD in Ren2 rat
To investigate whether ROS mediate Ang II-induced NAFLD in Ren2 rats, we treated 9-week-old Ren2 rats with superoxide dismutase/catalase mimetic tempol as described under Section 2. Tempol treatment, which had no significant effect on blood pressure (Table 2), dramatically reduced tissue levels of ROS (4-HNE immunoblot, Fig. 6A and C) and prevented development of NAFLD in 12-week-old Ren2 rats compared with untreated Ren2 littermates (Fig. 6C and Table 2). The hepatic steatosis score (0.38 ± 0.26 vs. 1.36 ± 0.38, p < 0.01) and liver TG levels (0.54 ± 0.18 vs. 1.41 ± 0.07, p < 0.01) at age 12 weeks were significantly reduced in the tempol-treated Ren2 group compared with the untreated Ren2 littermates, respectively (Table 2). Tempol treatment also inhibited hepatic collagen deposition in Ren2 rats (Fig. 6B and C). Liver apoptotic cell deaths and TNF-α mRNA expression and serum ALT in Ren2 were also significantly attenuated by tempol treatment (Fig. 7A and B and Table 2). There were no significant differences in body weight between the tempol-treated and -untreated groups (Table 2). These data document that ROS is an important mediator of Ang II-induced NAFLD in this transgenic Ren2 rat model.
4. Discussion
NAFLD is considered the most common liver disease in Western societies. The histological spectrum of NAFLD includes hepatic steatosis, steatohepatitis, fibrosis, and cirrhosis. NAFLD increases the risk for hepatocellular carcinoma and cardiovascular disease [7]. To date, there is no effective and well-tolerated drug therapy established to treat NAFLD, largely because of an incomplete understanding of the mechanisms underlying the disease. Therefore, it is of critical importance to expand our current understanding of the pathophysiology of NAFLD and explore new therapeutic pathways.
The RAS is integral in maintaining blood pressure and cardiovascular homeostasis. However, increased activation of RAS and Ang II causes hypertension and cardiovascular disease [11]. Recent studies indicate that plasma Ang II levels and local liver RAS significantly increased in patients with cirrhosis [26,27]. Blocking RAS attenuates the progression of hepatic fibrosis in several experimental hepatic fibrosis models induced by pig serum [28], methionine choline deficient diet [14], bile duct ligation [29,30] or CCl4 infusion [15]. These results suggest that RAS has a fibrogenic effect on the liver. Yet, little is known about the direct effects of Ang II on the development of hepatic steatosis and progression of NAFLD. To date, there are no published studies that directly evaluate the role of chronic increased endogenous Ang II on the development of hepatic steatosis, inflammation and fibrosis. Therefore, further studies using genetic models with excessive activity of RAS are necessary to address the effect of Ang II on the liver and explore the relationship between RAS and NAFLD.
In this study, we utilized the transgenic Ren2 rat that harbors the mouse Ren-2d renin gene and exhibits elevated serum renin and tissue Ang II levels [17–19] to explore the relationship between the RAS and the development of NAFLD. Our investigation reveals novel findings:
The Ren2 rat develops progressive NAFLD; treatment with the AT1R blocker valsartan attenuates steatosis and prevents progression of NAFLD in this model.
Increased RAS activity in the Ren2 model causes hepatic oxidative stress that is attenuated by the ROS scavenger tempol; treatment with tempol also attenuates steatosis and prevents progression of NAFLD. Furthermore, valsartan treatment, but not tempol, significantly reduced systolic blood pressure. This study provides strong evidence that Ang II-induced NAFLD is mediated by increased hepatic oxidative stress. These results also suggest that RAS is potentially a novel therapeutic target for treatment of NAFLD.
Our study supports that Ang II has pro-oxidant, pro-inflammatory and pro-fibrotic activity in liver. Increased ROS generation has been shown to induce cell membrane lipid peroxidation, inflammation, fibrogenesis, and cell apoptosis [31,32] by upregulating inflammatory molecules such as TNF-α and CRP [33,34]. Excessive apoptosis is linked to the development of hepatic fibrosis [35]. Our results show that the Ren2 livers had dramatically increased apoptotic cell deaths compared with SD controls and that apoptosis was reduced by in vivo treatment with valsartan or tempol. Apoptosis can be triggered by several factors including TNF-α. Hepatic TNF-α expression is also increased in the Ren2 compared with SD rats (Fig. 2), and treatment with valsartan or tempol attenuates TNF-α expression (Fig. 7). Thus, the Ang II-induced TNF-α expression in Ren2 livers is mediated by hepatic oxidative stress. Taken together, we have demonstrated that Ang II induces significant hepatic ROS generation, lipid peroxidation, inflammatory cell infiltration, apoptosis, and fibrosis in Ren2 liver compared with SD controls (Fig. 4), and that these effects were markedly attenuated by in vivo treatment with AT1R blocker valsartan or the SOD/catalase mimetic tempol (Figs. 6 and 7). These results provide strong evidence that ROS mediate Ang II-induced NAFLD in the Ren2 model.
Previous studies have shown that Ang II plays a role in liver fibrogenesis in patients [12,13] and animal models [14–16]. However, it should be noted that Ang II infusion studies in normal rats revealed conflicting results such that some studies failed to demonstrate liver fibrosis in the infused rats [36,37]. The likely explanation for these conflicting results is the variation in the concentration and duration of Ang II treatment between different studies [36,37]. Our Ren2 rats develop significant fibrosis at early age likely due to the marked activation of the RAS in this transgenic model. In addition, Ren2 rats exhibit increased liver 4-HNE levels (Fig. 4) which is known to activate hepatic stellate cells and enhance procollagen expression [38]. These factors may have contributed to the development of rapid and more severe liver fibrosis in the Ren2 rat model (Fig. 3).
Previous studies have documented an important role of NADPH oxidase in mediating Ang II-induced hepatic stellate cells (HSC) activation and liver fibrosis [25]. Our data demonstrate that Ren2 livers exhibit significant increases of activity and expression of NADPH oxidase compared with SD control rats. Furthermore, our study documents that Ang II promotes NADPH oxidase activation in Ren2 livers and that treatment with valsartan significantly reduces hepatic NADPH oxidase activity and expression in the Ren2 rats.
In conclusion, our study demonstrates that RAS activation plays a critical role in the development and progression of NAFLD through ROS generation. These findings expand our current understanding of the pathogenesis of NAFLD and suggest that RAS is a potential target for drug therapy for NAFLD.
Acknowledgments
5. Financial support
NIH RO1-DK-56345 (J.A.I.). RO1-HL073101 (J.R.S.). RO1-HL-51952 (C.M.F.). VA Merit 0018 (J.R.S.).
We thank Novartis Pharmaceutical Co. for providing valsartan for this study.
Abbreviations
- NAFLD
non-alcoholic fatty liver disease
- RAS
renin–angiotensin system
- Ang II
Angiotensin II
- Ren2
transgenic TG(mRen2) 27(Ren2) rat
- SD
Sprague–Dawley rat
- NASH
non-alcoholic steatohepatitis
- ROS
reactive oxygen species
- ACE
angiotensin-converting enzyme
- AT1R
angiotensin type 1 receptor
- TG
triglycerides
- ALT
alanine aminotransferase
- 4-HNE
4-hydroxy-2-nonenal
- SOD
superoxide dismutase
- NADPH
nicotinamide adenine dinucleotide phosphate
- TUNEL
terminal desoxynucleotide transferase-mediated dUTP nick end labeling
- CRP
C-reactive protein
Footnotes
The authors who have taken part in the research of this paper declared that they do not have a relationship with the manufacturers of the drugs involved either in the past or present but they received funding from the manufacturers to carry out their research. NIH funded study (NIH RO1-DK-56345, RO1-HL073101 and RO1-HL-51952).
References
- 1.Clark JM, Brancati FL, Diehl AM. Nonalcoholic fatty liver disease. Gastroenterology. 2002;122:1649–1657. doi: 10.1053/gast.2002.33573. [DOI] [PubMed] [Google Scholar]
- 2.Angulo P. Nonalcoholic fatty liver disease. N Engl J Med. 2002;346:1221–1231. doi: 10.1056/NEJMra011775. [DOI] [PubMed] [Google Scholar]
- 3.Brunt EM, Janney CG, Di Bisceglie AM, Neuschwander-Tetri BA, Bacon BR. Nonalcoholic steatohepatitis: a proposal for grading and staging the histological lesions. Am J Gastroenterol. 1999;94:2467–2474. doi: 10.1111/j.1572-0241.1999.01377.x. [DOI] [PubMed] [Google Scholar]
- 4.Matteoni CA, Younossi ZM, Gramlich T, Boparai N, Liu YC, McCullough AJ. Nonalcoholic fatty liver disease: a spectrum of clinical and pathological severity. Gastroenterology. 1999;116:1413–1419. doi: 10.1016/s0016-5085(99)70506-8. [DOI] [PubMed] [Google Scholar]
- 5.Friedman SL, Bansal MB. Reversal of hepatic fibrosis – fact or fantasy? Hepatology. 2006;43:S82–S88. doi: 10.1002/hep.20974. [DOI] [PubMed] [Google Scholar]
- 6.Mato JM, Lu SC. Role of S-adenosyl-L-methionine in liver health and injury. Hepatology. 2007;45:1306–1312. doi: 10.1002/hep.21650. [DOI] [PubMed] [Google Scholar]
- 7.Shimada M, Hashimoto E, Taniai M, Hasegawa K, Okuda H, Hayashi N, et al. Hepatocellular carcinoma in patients with nonalcoholic steatohepatitis. J Hepatol. 2002;37:154–160. doi: 10.1016/s0168-8278(02)00099-5. [DOI] [PubMed] [Google Scholar]
- 8.Adams LA, Lymp JF, St Sauver J, Sanderson SO, Lindor KD, Feldstein A, et al. The natural history of nonalcoholic fatty liver disease: a population-based cohort study. Gastroenterology. 2005;129:113–121. doi: 10.1053/j.gastro.2005.04.014. [DOI] [PubMed] [Google Scholar]
- 9.Charlton M. Nonalcoholic fatty liver disease: a review of current understanding and future impact. Clin Gastroenterol Hepatol. 2004;2:1048–1058. doi: 10.1016/s1542-3565(04)00440-9. [DOI] [PubMed] [Google Scholar]
- 10.Newberry EP, Xie Y, Kennedy S, Han X, Buhman KK, Luo J, et al. Decreased hepatic triglyceride accumulation and altered fatty acid uptake in mice with deletion of the liver fatty acid-binding protein gene. J Biol Chem. 2003;278:51664–51672. doi: 10.1074/jbc.M309377200. [DOI] [PubMed] [Google Scholar]
- 11.Sowers JR. Hypertension, angiotensin II, and oxidative stress. N Engl J Med. 2002;346:1999–2001. doi: 10.1056/NEJMe020054. [DOI] [PubMed] [Google Scholar]
- 12.Helmy A, Jalan R, Newby DE, Hayes PC, Webb DJ. Role of angiotensin II in regulation of basal and sympathetically stimulated vascular tone in early and advanced cirrhosis. Gastroenterology. 2000;118:565–572. doi: 10.1016/s0016-5085(00)70263-0. [DOI] [PubMed] [Google Scholar]
- 13.Powell EE, Edwards-Smith CJ, Hay JL, Clouston AD, Crawford DH, Shorthouse C, et al. Host genetic factors influence disease progression in chronic hepatitis C. Hepatology. 2000;31:828–833. doi: 10.1053/he.2000.6253. [DOI] [PubMed] [Google Scholar]
- 14.Hirose A, Ono M, Saibara T, Nozaki Y, Masuda K, Yoshioka A, et al. Angiotensin II type 1 receptor blocker inhibits fibrosis in rat nonalcoholic steatohepatitis. Hepatology. 2007;45:1375–1381. doi: 10.1002/hep.21638. [DOI] [PubMed] [Google Scholar]
- 15.Ohishi T, Saito H, Tsusaka K, Toda K, Inagaki H, Hamada Y, et al. Anti-fibrogenic effect of an angiotensin converting enzyme inhibitor on chronic carbon tetrachloride-induced hepatic fibrosis in rats. Hepatol Res. 2001;21:147–158. doi: 10.1016/s1386-6346(01)00102-4. [DOI] [PubMed] [Google Scholar]
- 16.Ueki M, Koda M, Yamamoto S, Matsunaga Y, Murawaki Y. Preventive and therapeutic effects of angiotensin II type 1 receptor blocker on hepatic fibrosis induced by bile duct ligation in rats. J Gastroenterol. 2006;41:996–1004. doi: 10.1007/s00535-006-1891-1. [DOI] [PubMed] [Google Scholar]
- 17.Kopkan L, Kramer HJ, Huskova Z, Vanourkova Z, Skaroupkova P, Thurmova M, et al. The role of intrarenal angiotensin II in the development of hypertension in Ren-2 transgenic rats. J Hypertens. 2005;23:1531–1539. doi: 10.1097/01.hjh.0000174972.46663.5e. [DOI] [PubMed] [Google Scholar]
- 18.Peters J, Munter K, Bader M, Hackenthal E, Mullins JJ, Ganten D. Increased adrenal renin in transgenic hypertensive rats, TGR(mREN2)27, and its regulation by cAMP, angiotensin II, and calcium. J Clin Invest. 1993;91:742–747. doi: 10.1172/JCI116292. [DOI] [PMC free article] [PubMed] [Google Scholar]
- 19.Zhao Y, Bader M, Kreutz R, Fernandez-Alfonso M, Zimmermann F, Ganten U, et al. Ontogenetic regulation of mouse Ren-2d renin gene in transgenic hypertensive rats, TGR(mREN2)27. Am J Physiol. 1993;265:E699–E707. doi: 10.1152/ajpendo.1993.265.5.E699. [DOI] [PubMed] [Google Scholar]
- 20.Mullins JJ, Peters J, Ganten D. Fulminant hypertension in transgenic rats harbouring the mouse Ren-2 gene. Nature. 1990;344:541–544. doi: 10.1038/344541a0. [DOI] [PubMed] [Google Scholar]
- 21.Ibdah JA, Perlegas P, Zhao Y, Angdisen J, Borgerink H, Shadoan MK, et al. Mice heterozygous for a defect in mitochondrial trifunctional protein develop hepatic steatosis and insulin resistance. Gastroenterology. 2005;128:1381–1390. doi: 10.1053/j.gastro.2005.02.001. [DOI] [PubMed] [Google Scholar]
- 22.Lee MA, Bohm M, Paul M, Bader M, Ganten U, Ganten D. Physiological characterization of the hypertensive transgenic rat TGR(mREN2)27. Am J Physiol. 1996;270:E919–E929. doi: 10.1152/ajpendo.1996.270.6.E919. [DOI] [PubMed] [Google Scholar]
- 23.Tilg H, Diehl AM. Cytokines in alcoholic and nonalcoholic steatohepatitis. N Engl J Med. 2000;343:1467–1476. doi: 10.1056/NEJM200011163432007. [DOI] [PubMed] [Google Scholar]
- 24.Wieckowska A, Zein NN, Yerian LM, Lopez AR, McCullough AJ, Feldstein AE. In vivo assessment of liver cell apoptosis as a novel biomarker of disease severity in nonalcoholic fatty liver disease. Hepatology. 2006;44:27–33. doi: 10.1002/hep.21223. [DOI] [PubMed] [Google Scholar]
- 25.Bataller R, Schwabe RF, Choi YH, Yang L, Paik YH, Lindquist J, et al. NADPH oxidase signal transduces angiotensin II in hepatic stellate cells and is critical in hepatic fibrosis. J Clin Invest. 2003;112:1383–1394. doi: 10.1172/JCI18212. [DOI] [PMC free article] [PubMed] [Google Scholar]
- 26.Garcia-Pagan JC, Bosch J, Rodes J. The role of vasoactive mediators in portal hypertension. Semin Gastrointest Dis. 1995;6:140–147. [PubMed] [Google Scholar]
- 27.Bataller R, Sancho-Bru P, Gines P, Lora JM, Al-Garawi A, Sole M, et al. Activated human hepatic stellate cells express the renin–angiotensin system and synthesize angiotensin II. Gastroenterology. 2003;125:117–125. doi: 10.1016/s0016-5085(03)00695-4. [DOI] [PubMed] [Google Scholar]
- 28.Yoshiji H, Kuriyama S, Yoshii J, Ikenaka Y, Noguchi R, Nakatani T, et al. Angiotensin-II type 1 receptor interaction is a major regulator for liver fibrosis development in rats. Hepatology. 2001;34:745–750. doi: 10.1053/jhep.2001.28231. [DOI] [PubMed] [Google Scholar]
- 29.Bataller R, Brenner DA. Liver fibrosis. J Clin Invest. 2005;115:209–218. doi: 10.1172/JCI24282. [DOI] [PMC free article] [PubMed] [Google Scholar]
- 30.Yang L, Bataller R, Dulyx J, Coffman TM, Gines P, Rippe RA, et al. Attenuated hepatic inflammation and fibrosis in angiotensin type 1a receptor deficient mice. J Hepatol. 2005;43:317–323. doi: 10.1016/j.jhep.2005.02.034. [DOI] [PubMed] [Google Scholar]
- 31.Ferret PJ, Hammoud R, Tulliez M, Tran A, Trebeden H, Jaffray P, et al. Detoxification of reactive oxygen species by a nonpeptidyl mimic of superoxide dismutase cures acetaminophen- induced acute liver failure in the mouse. Hepatology. 2001;33:1173–1180. doi: 10.1053/jhep.2001.24267. [DOI] [PubMed] [Google Scholar]
- 32.Malassagne B, Ferret PJ, Hammoud R, Tulliez M, Bedda S, Trebeden H, et al. The superoxide dismutase mimetic MnTBAP prevents Fas-induced acute liver failure in the mouse. Gastroenterology. 2001;121:1451–1459. doi: 10.1053/gast.2001.29590. [DOI] [PubMed] [Google Scholar]
- 33.Brasier AR, Recinos A, III, Eledrisi MS. Vascular inflammation and the renin–angiotensin system. Arterioscler Thromb Vasc Biol. 2002;22:1257–1266. doi: 10.1161/01.atv.0000021412.56621.a2. [DOI] [PubMed] [Google Scholar]
- 34.Muller DN, Dechend R, Mervaala EM, Park JK, Schmidt F, Fiebeler A, et al. NF-kappaB inhibition ameliorates angiotensin II-induced inflammatory damage in rats. Hypertension. 2000;35:193–201. doi: 10.1161/01.hyp.35.1.193. [DOI] [PubMed] [Google Scholar]
- 35.Guicciardi ME, Gores GJ. Apoptosis: a mechanism of acute and chronic liver injury. Gut. 2005;54:1024–1033. doi: 10.1136/gut.2004.053850. [DOI] [PMC free article] [PubMed] [Google Scholar]
- 36.Bataller R, Gabele E, Schoonhoven R, Morris T, Lehnert M, Yang L, et al. Prolonged infusion of angiotensin II into normal rats induces stellate cell activation and proinflammatory events in liver. Am J Physiol Gastrointest Liver Physiol. 2003;285:G642–G651. doi: 10.1152/ajpgi.00037.2003. [DOI] [PubMed] [Google Scholar]
- 37.Bataller R, Gabele E, Parsons CJ, Morris T, Yang L, Schoonhoven R, et al. Systemic infusion of angiotensin II exacerbates liver fibrosis in bile duct-ligated rats. Hepatology. 2005;41:1046–1055. doi: 10.1002/hep.20665. [DOI] [PubMed] [Google Scholar]
- 38.Zamara E, Novo E, Marra F, Gentilini A, Romanelli RG, Caligiuri A, et al. 4-Hydroxynonenal as a selective pro-fibrogenic stimulus for activated human hepatic stellate cells. J Hepatol. 2004;40:60–68. doi: 10.1016/s0168-8278(03)00480-x. [DOI] [PubMed] [Google Scholar]


