

Abstract
The Hedgehog (Hh) signaling pathway plays critical instructional roles during embryonic development. Mis-regulation of Hh/Gli signaling is a major causative factor in human congenital disorders and in a variety of cancers. The zebrafish is a powerful genetic model for the study of Hh signaling during embryogenesis, as a large number of mutants have been identified affecting different components of the Hh/Gli signaling system. By performing global profiling of gene expression in different Hh/Gli gain- and loss-of-function scenarios we identified several known (e.g. ptc1 and nkx2.2a) as well as a large number of novel Hh regulated genes that are differentially expressed in embryos with altered Hh/Gli signaling function. By uncovering changes in tissue specific gene expression, we revealed new embryological processes that are influenced by Hh signaling. We thus provide a comprehensive survey of Hh/Gli regulated genes during embryogenesis and we identify new Hh-regulated genes that may be targets of mis-regulation during tumorogenesis.
Keywords: hedgehog, detour(dtr), slow muscle omitted(smu), interrenal gland, pronephros, nervous system, microarray, transcriptional profiling
INTRODUCTION
Hedgehog(Hh)/Gli-mediated cell-cell signaling plays diverse roles during embryonic development. Across many species, secreted Hh proteins provide critical instructional cues that induce and pattern a wide range of embryonic tissues. In humans, inappropriate Hh signaling results in diverse developmental defects and is implicated in the induction, maintenance, and/or metastasis of up to 25% of human brain tumors [1, 2].
One key feature of the Hh pathway is the versatility of the signal. In the developing central nervous system (CNS), Sonic Hh (Shh), one of the three Hh proteins so far described in vertebrates, acts as a morphogen to regulate expression of a series of homeobox transcription factors that convey dorsal/ventral neural identity. Besides this role in cell fate decisions, Shh signaling also modulates neural progenitor proliferation and survival in the developing neural tube [3] and regulates stem cell maintenance within the embryonic and adult dorsal brain [4, 5]. Recent studies have also implicated Shh directly in axon guidance, suggesting that localized Hh signaling affects cellular behaviors independent of a transcriptional response [6, 7]. Hh proteins act through the transmembrane proteins Patched (Ptc) and Smoothened (Smo) to trigger an intricate cytoplasmic transduction machinery, ending in the downstream activation of the Gli family of transcription factors. In vertebrates, at least three Gli proteins (Gli1, Gli2 and Gli3) have been described, which are homologous to the single Drosophila Cubitus interruptus (Ci) gene [8]. Extensive research has focused on understanding how Hh signals, transduced by Smo, regulate the activity of the three Gli proteins, and on how this signaling determines the magnitude and quality of the resultant Hh-dependent target gene induction [9, 10]. Gli proteins are zinc finger transcription factors that respond to Hh signals and then regulate the transcription of Hh target genes, either activating expression (Class II Hh responsive genes such as nkx2.2a and ptc1) or repressing expression (Class I Hh responsive genes such as pax7 and dbx2) [11]. Gli1 acts primarily as an activator, while Gli2 and Gli3 act both as an activators and as repressors, like Ci. In mammals Gli2 appears to be the major activator of Hh signaling in the ventral nervous system, while in zebrafish Gli1 is the major activator and Gli2 plays both activator and repressor roles in different regions of the CNS [12]. The current model suggests that a combinatorial “code” of Gli repressor and activator functions guide Hh mediated cell proliferation and differentiation in the vertebrate embryo.
Recent evidence provided by Cayuso and colleagues [3] shows that Shh regulated patterning, proliferation, and survival of progenitors are separable activities in the developing spinal cord, suggesting that each of these cellular properties is an independently regulated response to Shh/Gli signaling. Thus, Shh signaling appears to directly coordinate the growth and patterning of the developing neural tube through Gli-mediated transcriptional regulation of discrete sets of target genes including members of the homeodomain protein (HD) and basic helix-loop-helix (bHLH) families such as nkx2.2a and foxA2 [3]. Since Hh signaling can influence multiple developmental processes, the genes that are activated or repressed in each circumstance vary with cellular context and developmental time, and Hh mediated gene regulation is likely to require cell-type specific cofactors. To date, a handful of genes whose transcription is directly regulated by Hh/Gli signaling have been described in both mammals and teleosts [11, 13] and analyses of their promoter regions have led to the identification of a consensus Gli binding motif within their regulatory sequences [14, 15]. These genes are known to regulate a variety of cellular processes including proliferation, metabolism, and apoptosis [16]. Considering the multitude of developmental processes that are regulated by Shh signaling, we hypothesize that there are far more Hh target genes than have been characterized to date that allow the reiterative deployment of the Shh pathway to elicit such diverse cellular responses. While the task of determining the repertoire of direct targets of transcription factors is still daunting, especially for organisms with complex genomes, microarray profiling of gene expression has emerged as a powerful approach for identifying regulatory networks of genes.
To uncover global changes in gene regulation in the embryo, appropriate gain- and loss- of function scenarios are needed. Fortunately, large-scale genetic screens have identified a number of zebrafish mutations that affect embryonic development by disrupting different components of the Hh signaling cascade [17, 18]. Among these are slow-muscle omitted (smu), which inactivates the Smoothened receptor, and blocks all Hh signaling [19-21] and detour(dtr), which inactivates Gli1, the main Hh effector in zebrafish [12].
We used these mutants to globally characterize transcriptional changes that result from altered Hh/Gli signaling in the vertebrate embryo. Using a microarray approach, we compared the transcriptional profiles of wild-type embryos to smu(smo) and dtr(gli1) mutant embryos and to embryos with hyperactivated Hh signaling following shh mRNA injection. This strategy has allowed us to 1) identify known genes that may be direct or indirect targets of Hh/Gli signaling and 2) uncover novel roles for Hh signaling in known developmental processes.
MATERIALS AND METHODS
Zebrafish lines
Wild-type and mutant zebrafish embryos were maintained at 28°C as described in [59] and staged according to [60]. Mutant lines used were smooth muscle omitted (smuhi1640), a loss of function smoothened allele [19] and detour (dtrts269), a loss of function gli1 allele [12]. Mutants were maintained as heterozygotes and heterozygous adults were crossed to produce homozygous mutant offspring. Homozygous mutant individuals were identified by morphological criteria (curled body axes) and/or defects in nkx2.2a expression (dtr).
mRNA injections
shh mRNA was synthesized with T7 polymerase from the shh/T7TS plasmid [61] linearized with BamHI using the mMessage mMachine kit (Ambion). Wild-type embryos were injected with ∼100 pg of shh mRNA at the 1−2 cell stage. Injected embryos were incubated at 28°C until 24 hours post-fertilization (hpf) and fixed for in situ hybridization.
Embryo samples and RNA extraction
Total RNA was isolated from 100 embryos per experimental condition by placing in 1 ml Trizol reagent (Invitrogen) in an eppendorf tube. Embryos were disrupted by grinding them using pestle tips or by vortexing for 1 minute, with 500mg of glass beads (Sigma) until embryos were clearly disrupted and then allowing the beads to settle before removing the supernatant. RNA was further purified using Qiagen Mini-RNA purification columns by resuspending the RNA in 50ul of DEPC-treated H2O and following the manufacturer's instructions for “RNA cleanup”.
Microarray analysis
The detailed protocol and normalization procedures are as in [62] and are available upon request. In brief, first-strand cDNA probes were generated by incorporation of aminoallyl dUTP and then coupled to the desired fluorochrome (Cy3 or Cy5). The resulting cDNA probes were purified and concentrated. All samples were hybridized to the arrays compared to a “reference” RNA sample (which consisted of embryos pooled from multiple stages of development) and changes of expression level were determined by comparing the signal intensity changes compared to the stable reference signal. Each chip contains 34,647 printed oligo elements (Compugen, Operon and MWG) designed from zebrafish EST assemblies and representing approximately 20,000 genes, representing approximately 60 per cent of the total predicted genes according to the public Ensembl database. After hybridization, the slides were washed, dried, and scanned using an Agilent DNA microarray scanner (Agilent Technologies) at 635 nm (Cy5) and then at 532 nm (Cy3). Fluorescent intensities were quantified using Agilent feature extraction software (Agilent Technologies). To ensure that all data was directly comparable, we did two color hybridizations with one of the colors labeling a “reference” sample that was the same for all slides. This normalized any chip-to-chip variability by allowing us to take the “ratio of the ratios” in any given comparison. Hybridizations were performed twice, switching the fluorescent labeling to eliminate biases caused by the labeling process. Samples were normalized using the Lowess calculations (see supplemental figure for description) and cutoffs for significance were set at a twofold change in either direction. Oligo sequences were mapped to multiple databases including, RefSeq, UniGene, Ensembl, TIGR, and genomic coordinates to maximally determine gene identity and function. Data was deposited into searchable FilemakerPro and Excel databases for analysis.
Whole-mount in situ hybridization
Whole mount in situ hybridization (ISH) at 24 hpf was performed as described [63], using digoxygenin labeled probes (Roche). Embryos were post-fixed in 4% paraformaldehyde overnight, cleared in 75% glycerol, and photographed using DIC optics on a Zeiss axioskop. Available probes included cldnb [46], irx1b [41], fst [26], nrd [47], pax3 [64], and wt1a [65]. In situ probes to novel genes were made using PCR-generated DNA fragments that contained the T7 (antisense primer) or SP6 (sense primer) RNA polymerase binding sites. PCR fragments were amplified from first strand wild-type cDNA primed with oligodT or random hexamer primers (Invitrogen cDNA Kit). Gene specific primer sequences are listed in Table S1.
RESULTS AND DISCUSSION
Microarray Analysis
Changes in the transcriptional profiles were analyzed by microarray using a set of oligonucleotides representing a set of 34,647 transcripts. Table 1 gives an overview of the number of transcripts that showed positive and negative regulation by Hh, while the Supplemental Table contains the complete list of genes on the microarray chips and the observed regulation by Hh signaling. Some of these genes have been previously linked to Hh, while others have no reported Hh regulation (Fig 1A). We also detected many genes of unknown function that respond to Shh, only characterized as ESTs (Fig. 1B). A similar microarray study was recently published that also identified a large number of Hh regulated genes [22]. In this previous study by Xu et al, injection of mRNA encoding a dominant negative form of protein kinase A (dnPKA) was used to mimic Hh activation [22], while loss of Hh signaling was induced by cyclopamine treatments. In contrast, our study used shh mRNA injections to induce Hh signaling, and loss of Hh signaling was examined using known Hh pathway mutants, providing a more direct manipulation of Hh signaling. Of 37 Hh-regulated genes with putative Gli binding sites found by Xu et al [22], 13 showed the similar regulation by Hh in our microarray analysis, 3 showed the opposite regulation, and 21 showed no significant regulation by Hh signaling. Similarly, 14 genes were verified for Hh regulation by Xu et al, and of these, 12 showed similar regulation in our study (see Supplemental Table). This comparison indicates that the two methods effectively identified an overlapping set of Hh regulated genes. While discrepancies in the results may indicate inconsistencies in the microarray analysis, they may also point to real differences in regulation that are due to the different methods of manipulating Hh signaling.
Table 1. Global Data on identification of Hh regulated genes by microarray analysis.
Gene expression was analyzed using microarrays representing a set of 34,647 transcripts. Genes showing a greater than two fold up- or down-regulation were tallied.
| Experiment | Up regulated genes | Down regulated genes | ||
|---|---|---|---|---|
|
Total # |
% novel |
Total # |
% novel |
|
| smu vs. WT | 245 | 81 | 376 | 83 |
| dtr vs. WT | 367 | 84 | 455 | 81 |
| shh injected vs. WT | 203 | 80 | 163 | 72 |
Fig 1. Expression profiles of selected significantly up-regulated or down-regulated genes in embroys with altered Hh signaling.
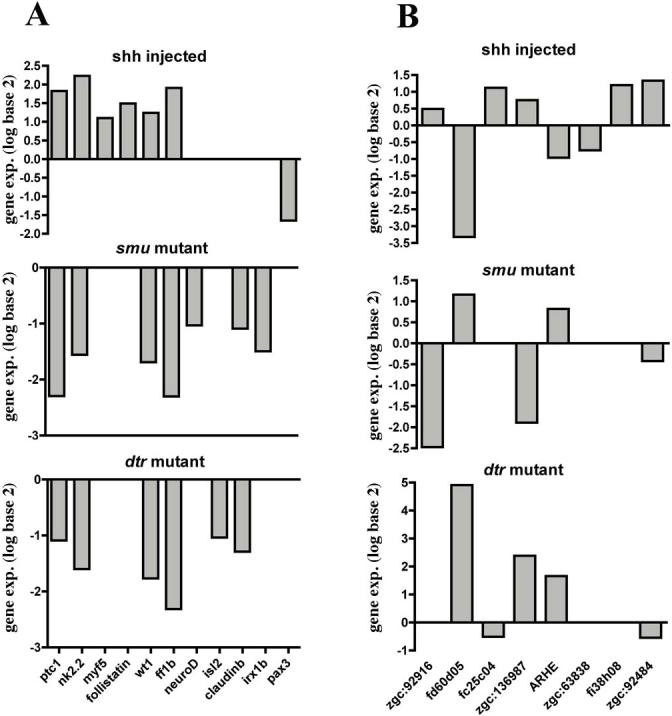
For each treatment, four replicate hybridizations were performed. The pattern of differential expression (median log 2 ratio) is graphically presented. (A) We chose 11 known genes and evaluated their expression profile in the different treatments. Among previously identified Shh-regulated direct targets, both ptc1 and nkx2.2a are included and show the expected modulation. Also, nine novel candidate Shh target genes were chosen based on their implication in cell growth and differentiation. These selected genes were independently confirmed as Shh target genes by whole mount in situ hybridization. (B) We show 8 novel genes that change their expression in the different treatments. Some of those genes/ests were confirmed by in situ hybridization.
We analyzed the expression of a subset of genes from these three categories (known Hh target genes, known genes but unknown as Hh targets, and novel genes) using whole mount in situ hybridization (ISH). Table 2 shows a summary of the genes analyzed in this paper, the data obtained for these in the microarray assay, and whether regulation by Hh was verified by ISH. This microarray analysis could potentially identify direct transcriptional targets of Hh regulation as well as genes that were indirectly up- or down-regulated due to changes in tissue differentiation. To begin to identify which genes might be directly regulated by Hh, we scanned genomic sequences up to five kb upstream of the translational start site and 5 kb downstream of the translational stop for putative Gli transcription factor binding sites (GACCACCCA), as previously done by Xu et al [22]. As shown in Table 2, 15 of 28 genes analyzed had at least 2 Gli binding sites in this region, suggesting they may be direct Shh/Gli transcriptional targets.
Table 2. Summary of genes analyzed.
Values indicate fold change in gene expression seen on the microarray for each Hh manipulation, relative to wild type and uninjected controls. Numbers in parentheses show regulation of the same gene represented by an independent position on the chip. Dark green (increased expression) or red (decreased expression) shading indicates 2 fold changes in expression, while lighter red or green shading indicates regulation slightly below this 2 fold cut-off. ISH; in situ hybridization, n.d.; no data, pGBS; number of putative Gli binding sites, shh-inj.; sonic hedgehog over expression by mRNA injection.
| shh-inj/WT | smu/WT | dtr/WT | pGBS | Verified by ISH | |
|---|---|---|---|---|---|
| Known Hh Regulated Genes |
|
|
|
|
|
| nkx2.2a1 | 4.7 (4.1) | 0.3 (0.7) | 0.3 (0.5) | 1 | + |
| patched1 (ptc1)2 | 3.5 | 0.2 | 0.5 | 12 | + |
| olig23 | 0.9 | 0.4 | 0.4 | 2 | + |
| pax74 | 0.6 | 1.7 | 0.6 | 12 | + |
| Known Genes (Hh reg. not defined) |
|
|
|
|
|
| ff1b (nr5a1a)5 | 3.8 | 0.2 | 0.2 | 0 | + |
| follistatin (fst)6 | 2.8 (2.0) | 1.0 (0.6) | 0.8 (1.0) | 2 | + |
| wilm's tumor (wt1a)7 | 2.4 | 0.3 | 0.3 | n.d. | + |
| claudinb (cldnb)8 | 1.7 (1.3) | 0.7 (0.5) | 0.4 (0.6) | 3 | + |
| irx1b9 | 1.1 | 0.4 | 0.5 | 0 | + |
| neuroD (nrd)10 | 0.9 | 0.5 | 1.0 | 0 | + |
| pax311 | 0.3 (0.6) | 1.4 (1.6) | 1.6 (0.8) | 8 | + |
| Novel Genes/ESTs |
|
|
|
|
|
| fv55h07 (zgc:63595) | 28.4 | 0.0 | 0.5 | 3 | − |
| fi60h10 (zgc:92484) | 2.5 | 0.8 | 0.7 | 3 | − |
| fr84a04 (zgc:85779) | 2.4 | 0.9 | 0.5 | n.d. | n.d. |
| fi38h08 (arhgef10) | 2.3 | 1.6 | 0.6 | 7 | + |
| EST: sim. SNF1-rel. kinase (zgc:73231) | 2.2 | 0.3 | 0.4 | 2 | − |
| fi41a08 (zgc:55473) | 2.2 | 1.0 | 0.9 | 3 | − |
| fd08b06 (fc25c04; follistatin-like 2 (fstl2)) | 2.2 | 0.9 | 0.6 | 1 | + |
| fc21a11.x1 (GB Acc: AI641222) | 2.1 | 0.0 | 0.0 | 1 | n.d. |
| fo94g05 putative prot. of bilateral origin | 1.9 | 0.7 | 0.6 | 1 | − |
| fi31a01 DENN/MADD dom. prot | 1.8 | 1.0 | 1.0 | n.d. | − |
| EST: (zgc:136987) | 1.7 | 0.3 | 5.2 | n.d. | + |
| fu20d03 ZINC FINGER PROTEIN | 1.5 | 0.4 | 10.1 | 1 | − |
| EST: (zgc:92916) | 1.4 | 0.2 | 1.2 | 1 | + |
| EST: (zgc:63838) | 1.3 | 1.7 | 0.8 | 6 | + |
| fq35g11.x1 (GB Acc: BI710394) | 1.2 | 0.0 | 0.0 | 1 | n.d. |
| fm69b04.x1 (GB Acc: BI880051) | 0.6 | 0.6 | 5.5 | 3 | n.d. |
| EST: (arhe; sim. Mm. Rnd3a) | 0.5 | 1.8 | 3.2 | 3 | + |
| fb94e02 zinc finger protein 648 | 0.4 | 1.3 | 0.8 | 3 | − |
| fb66a01 (zgc:153275) | 0.4 | 0.8 | 0.9 | n.d. | n.d. |
| fa08c02.s1 (GB Acc: AA542581) | 0.4 | 1.0 | 10.7 | 1 | n.d. |
| fl63b12 (smarca2) | 0.3 | 0.6 | 0.9 | 14 | + |
| fd60d05 solute carrier 6 | 0.2 | 2.2 | 30.5 | n.d. | + |
Verification of Hh regulation by whole mount in situ hybridization
Changes in Hh signaling could affect overall gene expression levels in the embryo either directly through changes in Gli-mediated transcriptional regulation (e.g. Class I and Class II Hh responsive genes), indirectly through regulation of other transcription factors, or indirectly through global changes in development of embryonic tissues [23]. To assess the relevance of our data we thus decided to verify the gene regulation data obtained from the microarray using whole mount ISH. Besides allowing a relatively rapid verification of gene expression in different Hh-manipulated embryos, this approach provided spatial information and insights about the nature of regulation by Hh signaling. In the process, this approach also revealed new information about the role of Hh signaling in organogenesis. We immediately recognized several known Hh target genes among the genes showing regulated expression on the microarray. The well characterized Hh receptor ptc1, as well as the early transcriptional target nkx2.2a, were appropriately regulated on the chip [24, 25]. These data confirmed that our approach could identify direct Hh transcriptional targets. We next examined known developmental genes that were not previously reported to be regulated by Hh (e.g. Figs. 2, 3 and 4). We also examined expression of previously uncharacterized genes to determine whether gene expression differences seen on the microarray were reflected by differential expression in the embryo. Gene specific primers based on published EST and genomic sequences (Supplemental Table 1) were used to amplify coding regions from first strand cDNA, and antisense RNA probes were made directly from PCR amplified products. 30 novel genes that showed regulation by microarray analysis were chosen for further analysis based on bioinformatic analysis suggesting they might play a role in embryogenesis. Of these, 20 displayed appropriate regulation in whole mount ISH on mutant and/or, shh mRNA injected embryos.
Fig. 2. Confirmation that follistatin(fst) and follistatin-like2 (fstl2; wu: fc25c04) expression is affected by Hh signaling.

(A) In wild-type embryos, fst is regionally expressed in the CNS, with weak dorsal expression in the region of the epiphysis (left arrowhead), tectum (right arrowhead), and hindbrain (thin arrows). fst is also expressed more ventrally in the diencephalon (arrow), midbrain, and hindbrain (white bracket). In the trunk, fst is expressed in ventral and dorsal regions of somites, but expression is undetectable in the dorsal spinal cord. (insets, arrowheads) (B) In shh mRNA injected embryos, dorsal fst expression is expanded in the diencephalon and midbrain (arrowheads), hindbrain (thin arrows), and spinal cord (insets, arrows). Ventral fst expression appears mildly reduced in the diencephalon (large arrow), and is reduced in the ventral midbrain and hindbrain (white bracket). (C) In smu(smo) mutant embryos, fst expression is lost in the dorsal brain (arrowheads) and reduced in the diencephalon (arrow), ventral midbrain, and hindbrain (white bracket) and somites (insets, arrowheads). (D) In dtr(gli1) mutant embryos, fst expression in the brain is similar to that in wild-type embryos, but may be slightly reduced in the somites (inset). Regional loss of nkx2.2a expression (red in D and H) confirms that this embryo is a homozygous dtr(gli1) mutant [12] (E) fstl2 is expressed in the ventral diencephalon (large arrow), ventral midbrain (arrowheads), and in stripes in the hindbrain that may correspond to rhombomere borders (small arrows). In the trunk fstl2 is expressed dorsally and laterally in the somites (insets, arrowheads). (F) In shh mRNA injected embryos, fstl2 expression is regionally expanded in the ventral midbrain (arrowheads) but is mildly reduced in the somites (insets). (G) In smu(smo) mutants fstl2 expression is regionally absent in the forebrain (arrow) and midbrain (arrowheads) but is expanded in the somites (insets). In dtr(gli1) mutants CNS expression is reduced while somite expression appears normal. Main panels show lateral views of 24 hpf zebrafish heads, eyes removed, anterior to the left. The corner insets show lateral views of the trunk, while the medial insets show cross sections through the trunk. In this and subsequent figures, the numbers in each panel indicate fold change in gene expression from microarray analyses. fb; forebrain, mb; midbrain, hb; hindbrain.
Fig. 3. Hh signaling affects ff1b and wilm's tumor 1 (wt1a) expression.
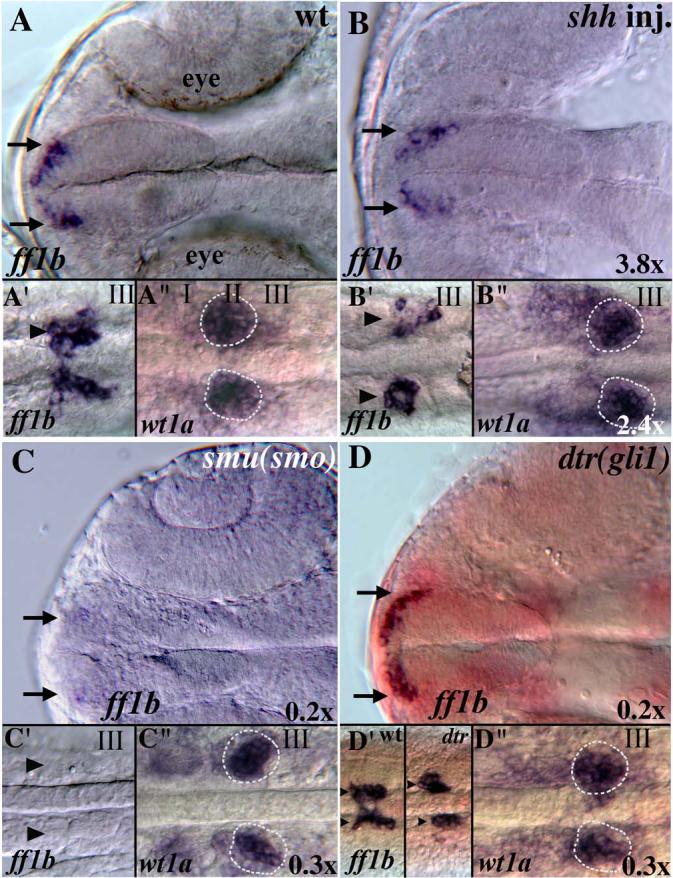
(A-D) Ventral views of the heads of 24 hpf zebrafish embryos showing expression of ff1b in the optic stalk region of the forebrain (arrows). Forebrain ff1b expression is reduced in shh mRNA injected (B) and smu(smo) mutant embryos (C), and appears slightly reduced in dtr(gli1) mutants (D). (A'-D') Ventral views of the trunk between somites I and III showing ff1b expression in the interrenal gland primordia [66]. Additional ff1b-expressing cell clusters are present in shh mRNA injected embryos (B', arrows). Interrenal gland ff1b expression is absent in smu(smo) mutants (C') and is slightly reduced in dtr(gli1) mutants (D'). (A”-D”) Ventral views of the trunk between somites I and III showing bilateral expression of wt1a in the developing pronephros [65]. wt1a expression is expanded in shh mRNA-injected embryos (B” outside circle) and reduced in smu(smo) and dtr(gli1) mutants (C” and D”, within circles). The circles in all panels represent the domain of wild-type wt1a expression.
Fig. 4. irx1b, claudinB and neuroD expression in embryos with altered Hh signaling.
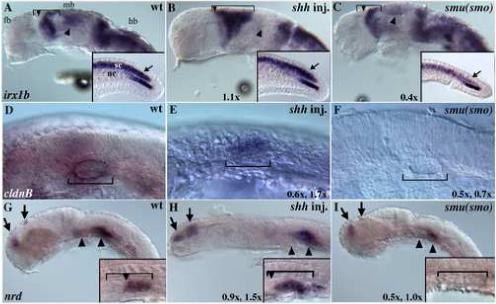
(A-C) Lateral views of 24 hpf embryos, eyes removed. (A) In wild-type embryos irx1b is expressed regionally in the midbrain, hindbrain, spinal cord, and in the caudal region of the notochord (inset) [67]. (B) In shh mRNA injected embryos, irx1b expression is reduced in the tectum (arrowhead), but expression in the mid diencephalon boundary (MDB) is expanded caudally (brackets). irx1b expression is also slightly expanded in the caudal spinal cord (arrow in inset). (C) irx1b expression is reduced in smu(smo) mutants in the midbrain (arrowhead) and in the spinal cord (arrow in inset). (D) In wild-type embryos claudinB is expressed in the otic placode (bracket). (E) In shh mRNA injected embryos this expression is expanded throughout the entire otic placode. (F) In smu(smo) mutants claudinB expression is completely absent. (G) In wild-type embryos, neuroD is expressed in the dorsal telencephalon and diencephalon of the forebrain (arrows), in the ventral hindbrain (arrowheads), and in the posterior half of the developing pancreas (inset). (H) In shh mRNA injected embryos dorsal neuroD expression is expanded, and expression in the developing pancreas expands anteriorly (inset, bracket and arrow). (I) neuroD expression is extremely reduced in smu(smo) mutants, including in the developing pancreas (inset). Two numbers indicate regulation seen for genes represented by more than one oligo on the microarray chip.
Positively regulated known genes
follistatin (fst; GB Accession: AF084948) and follistatin-like2 (fstl2; GB Accession: A159257) regulation by Shh suggests a new regulatory mechanism for BMP signaling
Our microarray results indicated that follistatin (fst) expression was significantly upregulated following shh mRNA injection (2.8x increase). Expression in smu(smo) mutants was reduced, but at a level that just missed the 2 fold cutoff for significance on one of two microarray spots (0.6×). fst expression was relatively unchanged in dtr(gli1) mutant embryos (0..8×) (Table 2) . An uncharacterized EST wu:fc25c04 related to follistatin-like2 also showed positive regulation by Hh (2.2× in shh mRNA injected embryos and 0.3× in smu(smo) mutants). fst is a well known Bone Morphogenic Protein (BMP) antagonist that is expressed in axial and paraxial mesoderm during late gastrula stages in zebrafish as well as later in the somites, brain, and eye [26]. fst was shown previously to inhibit a number of vertebrate BMPs including BMP5, BMP7, BMP2, and BMP4 [27, 28]. Experiments in chick showed that fst can modulate the effects of BMP on Hh signaling, making neural progenitor cells more responsive to Hh signals and enhancing Hh mediated differentiation into ventral cell types [29]. While it is known that a gradient of BMP signaling opposes the Hh signaling gradient in the neural tube, regulation of fst by Hh has not previously been demonstrated.
ISH analysis confirmed that fst and fstl2 expression were dramatically increased in the dorsal spinal cord and brain in shh mRNA injected embryos (Fig. 2). fst expression was reduced in the same dorsal regions in smu(smo) mutants and slightly reduced in dtr(gli1) mutants, consistent with positive regulation by Hh. The microarray analysis failed to uncover differential expression of fst in smu(smo) mutants, most likely for technical reasons. fstl2 was reduced ventrally and in the forebrain of smu(smo) mutants but increased elsewhere in the somites (Fig. 2), which may account for the almost unchanged overall expression detected on the microarray (0.9×). Regulation of fst expression by Hh could be direct, as the promoter region contains a putative Gli binding site (GAACACCCA) that has a one base pair difference compared to the Gli binding site found in the human ptc1 promoter (GACCACCCA) [22]. These results suggest that Hh signaling helps regulate expression of these BMP antagonists, and may point to a new regulatory mechanism by which antagonistic BMP and Shh signaling gradients are balanced to establish proper dorsal/ventral neural patterning.
ftz-f1 (ff1b, nr5a1a; GB Accession: AF198086) and wilms' tumor 1a (wt1a; GB Accession: X85734 ) regulation point to a role for Hh in interrenal gland and pronephros development
Our microarray data suggested that expression of the ftz-f1 nuclear receptor homolog ff1b and wilms' tumor 1a (wt1a) are highly influenced by Hh signaling. Both ff1b and wt1a are down regulated in smu(smo) and dtr(gli1) mutants and upregulated in shh mRNA-injected embryos (ff1b: .20×, .20×, and 3.75×; wt1a: .26×, .29×, and 2.36× respectively). ff1b is the apparent ortholog of mammalian SF1, an orphan nuclear hormone receptor transcription factor required for adrenal gland (interrenal gland in zebrafish, [30]) organogenesis [31]. wt1a is a zinc finger transcription factor required for the proper formation of the vertebrate kidneys (pronephros in zebrafish) and the mammalian gonads [32]. It was previously shown that loss of wt1a function in zebrafish disrupts midline fusion of lateral pronephric cells and also results in a reduction in ff1b expression in the adjacent interrenal cells, suggesting a tight link between interrenal and pronephric development [33]. Therefore, diminished ff1b expression in Shh pathway mutants could be an indirect effect of the loss of wt1a expression. Hh signaling from overlying notochord has also been implicated in pronephros and adrenal gland development [31, 34], but regulation of these genes by Hh has not previously been demonstrated.
ISH analysis verified the changes in ff1b and wt1a expression levels seen by microarray (Fig. 3). In the trunk, interrenal gland expression of ff1b expression was absent in smu(smo) mutants (Figure 3C’) and significantly reduced in dtr(gli1) mutants (Figure 3D’), with apparently fewer cells expressing the gene. ff1b expression may be increased in shh mRNA injected embryos because expression was expanded to as many as four distinct clusters of cells (Figure 3B’). Similarly, wt1a expression in the pronephric primordia was significantly reduced in smu(smo) and dtr(gli1) mutants and was expanded in shh mRNA-injected embryos (Fig. 3B’, C’, D’). ff1b expression was also reduced in the forebrain of smu(smo) and dtr(gli1) mutants. (Figs. 3C, D). Interestingly, shh mRNA injection also reduced forebrain ff1b expression (Fig. 3B). The fact that both excess and reduced Hh signaling reduces expression of ff1b in the forebrain suggests that these ff1b expressing cells may require an optimal, mid-level of Hh signaling to differentiate. In shh injected embryos, increased expression of ff1b in the trunk appears to overshadow this loss of forebrain expression to produce the overall increase in expression seen in the microarray experiments.
Despite the lack of ff1b in smu(smo) mutants (Fig. 3C), the interrenal primordia are able to form, as indicated by expression of the steroidogenic tissue marker cyp11a1 (scc) in these mutants [33]. This suggests ff1b is not required for scc expression, as had been suggested by ff1b knockdown experiments in zebrafish [35]. Our ISH analyses suggest that Hh signaling plays an important role in interrenal and pronephric primordia development. This role for Hh appears to be evolutionarily conserved, as mice expressing a dominant-negative form of the Hh responsive transcription factor Gli3 do not develop adrenal glands [36]. Our data may help direct further investigations into the link between Hh signaling, interrenal ff1b expression, and pronephric wt1a expression during organogenesis of the adrenal gland and kidney.
iroquois 1b (irx1b, Genbank accession AY017308); possible feedback between irx genes and the Hh pathway
Our microarray data showed a down regulation of irx1b expression in both smu (smo) and dtr(gli1) mutants (0.36× and 0.5× respectively). The irx genes are highly conserved homeodomain transcription factors that have been implicated in patterning of diverse tissues during development, such as the dorsal head and notum of Drosophila, and the neural plate and heart in vertebrates (reviewed in Cavodeassi and colleagues [37]). Previously, regulation of irx genes by Hedgehog signaling has been shown in flies, chick and frogs. Patterning of the larval wing disc in Drosophila involves activation of iro-C complex genes by Hh/Ci signaling [38]. The Xenopus Xiro1 gene is strongly activated in the anterior neural plate by over expression of Ci [39]. In the chick as well as in the zebrafish, irx3, together with other homeodomain factors, affects dorsoventral patterning of the neural tube [11]. irx3 is a class I gene, repressed by Shh, and its expression domain defines the region where V2 neurons will form in the ventral neural tube. Conversely, irx1a can regulate Hh itself, as seen in the developing zebrafish [40], suggesting a feedback loop between these genes. Whether the relationship between Hh signaling and the iroquois genes is direct or indirect remains to be determined.
irx1b expression in wild-type embryos is restricted to the CNS at 24 hours post fertilization (hpf), including the dorsal diencephalon and midbrain, hindbrain, cerebellum, lateral floor plate and spinal cord (Fig. 4a, [41]). ISH analysis verified that irx1b is down regulated in smu(smo) mutants, with expression regionally lost in the midbrain, and expression being generally reduced in the tail (Fig. 4C). irx1b expression was similarly reduced in dtr(gli1) mutant embryos (data not shown), consistent with the reduction seen on the microarray. While no overall change due to shh mRNA injection were seen on the microarray or by ISH, subtle regional changes in irxb expression were detected in shh injected embryos (Fig. 4b). Most notably, the expression domain encompassing the posterior diencephalon and anterior midbrain was expanded.
Claudin b (cldnb, Genbank Accession NM_131763) indicates Shh modulation of genes in the otic placode
cldnb was significantly down regulated in smu (smo) and dtr (gli1) mutant embryos (0.47× and 0.41×, respectively), with little change seen in shh injected embryos. Claudins are members of the tetraspanin superfamily of integral membrane proteins specific to vertebrates that participate in cellular adhesion and migration, and form vertebrate tight junction strands [42] in different embryonic and adult structures [43]. In mammals, the family comprises at least 20 members, and genetic lesions in claudins are known to be the cause of defects such as kidney Mg2+ resorption [44], and deafness [45]. In zebrafish, cldnb is expressed in the developing ear and in lateral-line placodes, olfactory placodes and pronephric duct and subsequently in the lateral line primordia, with cldnb being expressed strongly in the migrating primordia and in all neuromast accessory cells [46].
Our ISH analysis confirmed the down regulation of cldnb in smu(smo) mutant embryos at 24 hpf, with expression completely absent (Fig. 4F, data not shown). cldnb expression appeared normal in dtr(gli) mutants. Consistent with the microarray results, cldnb expression levels in shh injected embryos resembled those seen in wild-type embryos, despite the change in otic vesicle morphology (Fig. 4E). Since otic placode morphology appears normal in smu(smo) mutants (Fig. 4F), the loss of cldnb expression in these mutants may represent specific regulation by Hh. This analysis is the first to suggest regulation of cldnb by Hh activity.
neuroD (nrd, Genbank Accession AF036148) a proneural gene regulated by Shh
Our microarray analysis showed a decrease in nrd expression in smu(smo) mutants (.47×) and no significant changes in shh injected embryos (.89×). nrd is a basic helix-loop-helix (bHLH) transcription factor expressed during neurogenesis [47] that is also required for pancreatic morphogenesis in mice [48]. In 24 hpf zebrafish nrd is expressed in the dorsal forebrain, ventral midbrain/hindbrain, as well as in the anterior and posterior lateral line placodes, the facial epibranchial placode and in the octaval/statoacoustic ganglion precursors (Fig. 4G, [49]).
ISH analysis confirmed the microarray results, showing a regional loss in nrd expression in smu(smo) mutants, and regional changes in shh mRNA-injected embryos. In particular, nrd expression was lost in smu(smo) mutants in the anterior/ventral hindbrain, as well as in the posterior lateral line placodes (Fig. 4I. In shh mRNA injected embryos, nrd expression was expanded in the dorsal forebrain, as well as in the otic placode (Fig. 4H). This analysis uncovers Hh-regulation of nrd expression in several regions of the developing nervous system. We were unable to identify a Gli motif in the nrd promoter within 5 kb 5' to the translation start site, possibly indicating that with this regulation by Hh signaling is indirect.
Negatively regulated known genes
pax3 (GB Accession: AF014366), a Class I Hh regulated gene
Microarray analysis revealed that pax3 transcription was significantly down regulated in shh mRNA injected embryos (.554×) and somewhat upregulated in smu(smo) mutants (1.6×), similar to the known class I gene pax7 (Table 2) There was no significant change in pax3 expression in dtr(gli1) mutants (0.82×). pax3 is part of a family of paired-box containing transcription factors that are involved in multiple developmental processes including neural tube closure, muscle differentiation, and neural crest cell differentiation [50]. In zebrafish, pax3 is expressed in the dermomyotome [51], dorsal diencephalon, and spinal cord [13]. Hh has been shown to repress pax3 expression in the chick [52] and zebrafish [53] somite and more recently in the zebrafish neural tube [13].
ISH confirmed the negative regulation of pax3 by Hh signaling seen in the microarray analysis (Fig. 5). In shh mRNA injected embryos, pax3 expression was strongly reduced and was restricted to the very dorsal regions of the neural tube. In the absence of Hh signaling (smu(smo) mutants) pax3 expression was expanded into the ventral neural tube. Consistent with the microarray data, little or no change in pax3 expression was seen in dtr(gli1) mutants. Since neural cells are clearly present but fail to express pax3 in smu(smo) mutants, these data suggest pax3 is transcriptionally regulated by Hh signaling, either directly via Gli transcriptional regulation, or indirectly via other Hh regulated transcription factors. An analysis of the promoter region of pax3 reveals Gli binding sites, suggesting Hh/Gli signaling may directly repress pax3 expression, helping limit expression to the dorsal neural tube. These data help define pax3 as a Class I Hh regulated gene. Since pax3 expression appears normal in dtr(gli1) mutants these data suggest that this Hh regulation of pax3 may occur via Gli2 and/or Gli3 repressor activity.
Fig. 5. pax3 expression and Hh signaling.

(A) In wild-type embryos, pax3 is expressed in the dorsal spinal cord, hindbrain, and midbrain, with anterior expression stopping at the midbrain/forebrain boundary. pax3 is also expressed in somites [64], but this expression is weak relative to CNS expression (inset). (B) In shh mRNA injected embryos, pax3 expression is greatly reduced in the CNS and is restricted to the dorsal-most region, while somite expression remains weak (inset). (C) In smu(smo) mutants, pax3 expression is expanded ventrally in the midbrain (bracket, arrowhead). Somite expression of pax3 is greatly increased in smu(smo) mutants (inset, arrowheads). (D) In dtr(gli1) mutants pax3 expression appears normal in the brain and spinal cord (right inset). Regional loss of nkx2.2a expression (red labeling, bracket, compare to inset) confirms that this embryo is a homozygous dtr(gli1) mutant. Lateral views of 24 hpf embryos, eyes removed.
Unknown genes regulated by Shh
Novel Hh/Gli regulated gene: zgc: 92916
Our microarray analysis identified over 300 putative Hh regulated genes (Table 1). Many of these genes represent ESTs for which no function has been assigned. We chose to further examine several of these ESTs by ISH to determine whether they were indeed regulated by Hh signaling (Table 1), and to determine where in the embryo they are expressed as a first step towards a functional analysis. We present detailed data for one of these genes here.
Our microarray analysis showed that fr71a09.y1 (BI428994), which corresponds to the gene zgc:92916 in zebrafish, was down regulated in smu(smo) mutants (0.18×), possibly upregulated in shh mRNA injected embryos (1.4×), and relatively unchanged in dtr(gli1) mutants (1.2×). zgc: 92916 is 83% identical to mouse RAB3C and 90% identical to human Rab3C, a member of the Ras oncogene family of GTP-binding proteins that are involved in regulated endocytosis. Another member of this large protein family is Rab23, which has specifically been implicated as a negative regulator in the Hh signaling pathway and is involved in trafficking of Smo in endosomes [54].
ISH analysis confirmed the microarray results. In 24 hpf wild-type embryos, zgc:92916 is regionally expressed in the brain and spinal cord (Fig. 6A). In the brain, zgc:92916 is expressed in the telencephalon, as well as in the anterior diencephalon, tegmentum and ventral hindbrain, regions where Hh signaling is known to play an important patterning role. zgc:92916 expression is regionally reduced in smu(smo) mutants, being mostly absent from the anterior diencephalon and tegmentum (Fig. 6C). In shh mRNA injected embryos, zgc: 92916 is expanded dorsally in bands within the hindbrain (Fig. 6B), similar to the Hh responsive gene ptc1. In the spinal cord zgc:92916 is expressed in lateral columns of cells that may include differentiating motoneurons, interneurons, and commissural neurons. This expression is largely absent in smu(smo) (Fig. 6C) despite the fact that most of these neurons are present. Consistently, expression of zgc:92916 in the lateral spinal cord appears increased in shh mRNA injected embryos (Fig. 6B inset).
Fig. 6. Expression of novel gene zgc: 92916 and confirmation of its regulation by Hedgehog signaling.
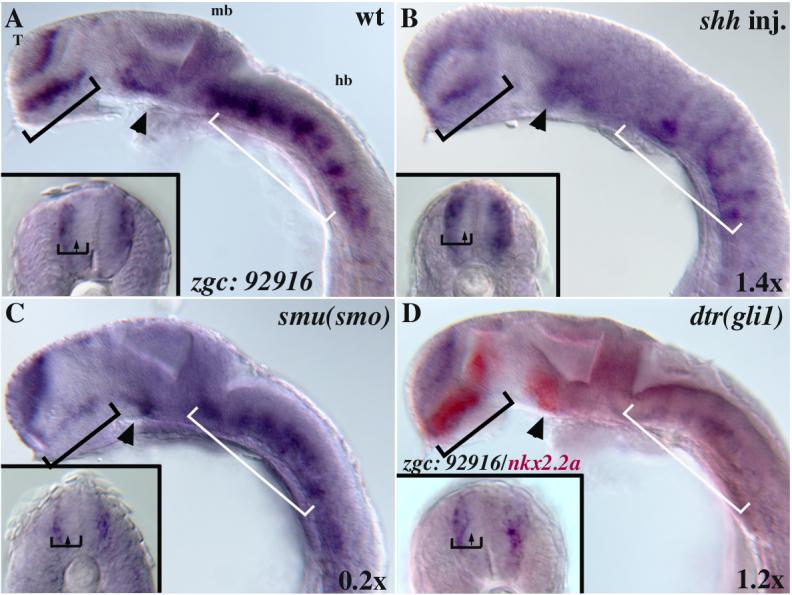
(A) In wild-type embryos, zgc: 92916 is expressed in the telencephalon (T), ventral hindbrain (white bracket), the anterior/dorsal diencephalon (black bracket), the ventral midbrain (arrowhead), and bilaterally along the dorsal-ventral axis of the spinal cord (insets; A-D). (B) In shh mRNA injected embryos this expression is expanded medially in the spinal cord (inset, B), and dorsally in the midbrain and hindbrain. (C) In smu(smo) mutants zgc: 92916 expression is reduced in the anterior/dorsal diencephalon (black bracket), ventral midbrain (arrowhead), and spinal cord (inset). (D) The expression of zgc: 92916 in dtr(gli1) mutants was similar to that seen in wild-type embryos. The embryo in D was double labeled to show nkx2.2a expression (red) allowing unambiguous identification as a homozygous dtr mutant.
Final remarks
Although it is clear that the endpoint in the Hh signaling transduction cascade is the regulation of a diversity of target genes, our present understanding of the number and kinds of genes regulated is limited. Shh can have multiple effects on adjacent cell types and distinct effects on the differentiation of a single cell type at different times. Under either scenario, the identification of transcriptional changes commanded by Hh that ultimately govern cell fate decisions is essential. Using a microarray-based approach, we set out to investigate the molecular mechanisms by which Shh signaling modifies the transcriptional response of the early zebrafish embryo. We chose 24 hpf embryos, when the body plan has been laid out, and when Shh may function in roles other than patterning of the embryonic axes. Moreover, at this stage, gli1 mutants do not display significant tissue loss or necrosis, which could otherwise preclude the identification of bona fide target genes. This work complements a recent publication by Xu et al. (2006), which described microarray based expression profiling after global repression or activation of Shh signaling. Our study goes further since we took advantage of well defined mutant loss-of-function conditions, and our zebrafish microarray contained twice the number of probes (34,647 versus 16, 000). Moreover, we included the analysis of dtr(gli1) mutants in our experiments, aimed at dissecting the specific role of Gli1, the main effector of the pathway in teleosts. Further experiments will be needed to sort out whether regulation by Hh signaling is direct or indirect.
Studies of Shh function in a number of organisms have shown that the same signal can govern cell proliferation, survival and fate, alternatives that must be context-and time- dependent. Given the remarkable network of gene activity regulated by Shh, this growth factor could function to ensure that independent mechanisms act on the correct number of precursors that can then respond to appropriate patterning signals in diverse structures. The classes of genes identified in this study correlate well with the possible outcomes of Shh activity. Genes implicated in cell proliferation, survival and differentiation were activated by enhanced signaling, and they corresponded to a wide variety of cellular processes and molecular functions (Supplemental Figure).
Our findings support a critical role for Shh in building the nervous system, confirming the current view that beyond its classical role in ventral patterning, brain growth is controlled by the mitogenic action of Shh, at later embryonic time points. How the levels and duration of the Hh signal are integrated/modulated by the recipient cells depends also on how Hh signaling interacts with other signaling cascades, and several recent studies have begun to explore such a mechanism at the cellular level [55-57]. A major challenge in the field is to unravel the complex network of signaling interactions and to identify common targets susceptible to regulation by more then one inductive signal, as has been described for the EGFR [57] and beta-catenin [55], key components of the EGF and canonical Wnt signaling pathways, respectively.
It is now clear that embryonic cell-cell signaling systems involved in cellular patterning play critical roles in tissue homeostasis, growth, and cancer [4]. In this sense, tumors can be seen as abnormal organ development processes that, nevertheless, display consistent order, morphogenesis and patterning [58]. Our study contributes to the understanding of the role of the Shh pathway by highlighting some new genes that could be used as targets for drug development for rational anti-cancer therapies.
Acknowledgements
We would like to thank Catalina Lafourcade (U. Chile) and Jeanne Thomas (UMass) for technical assistance, Judy Bennett for UMass fish care, Abdel Elkahloun and the NHGRI Microarray core for technical array assistance, Dr. Pilar Sanchez and members of the Karlstrom lab for comments on the manuscript, and the zebrafish community for sharing in situ probes. This work was supported by Mecesup UCH0306 Scholarship and Development Traveling Fellowship (LAM), NIH NS03994 and HD044929 (ROK), ICM P06-039F (MA and VP), Fondecyt grants 1070867 (MA) and 1070248 (VP) and the Intramural Program of the National Human Genome Research Institute (SMB).
Footnotes
Publisher's Disclaimer: This is a PDF file of an unedited manuscript that has been accepted for publication. As a service to our customers we are providing this early version of the manuscript. The manuscript will undergo copyediting, typesetting, and review of the resulting proof before it is published in its final citable form. Please note that during the production process errors may be discovered which could affect the content, and all legal disclaimers that apply to the journal pertain.
Supplementary Material
(A) Lowess Normalization. Due to the unanticipated sample RNA concentration and cy3 or cy5 dye characteristics, two-color fluorescent hybridization may introduce some intensity-dependent variation in collected data sets. One of the most commonly utilized normalization techniques, the locally weighted scatterplot smoothing (LOWESS) algorithm, applies a nonlinear smoothing adjustment that removes such variation. The adjusted ratio, or normalized ratio, is computed by: [log(R/G) = log(R/G) – c(A)] where c(A) is the Lowess fit to the log(R/G) vs. log(sqrt(R*G)) plot (the red-line in the figure). The degree of smoothing is determined by the window width parameter. A larger window width results in a smoother curve, a smaller window results in more local variation. The MATLAB implementation of Lowess is as follows; x = log2(red) + log2(green), y = log2(red) – log2(green), rSmooth = malowess( x, y ), rNorm = y – rSmooth, where rNorm is the normalized log2-ratio, and red and green are input red- and green-channel intensities, respectively. (B) Pie chart showing the percentage of identified Hh regulated genes in several different functional groups.
Supplementary Table 2. List of all genes on the Compugen, Operon, and MWG microarrays and their regulation by Hh (Microsoft Excel format).
Supplementary Table 1: PCR primers for generating in situ probes
REFERENCES
- 1.Lum L, Beachy PA. The Hedgehog response network: sensors, switches, and routers. Science. 2004;304:1755–9. doi: 10.1126/science.1098020. [DOI] [PubMed] [Google Scholar]
- 2.Knoepfler PS, Kenney AM. Neural precursor cycling at sonic speed: N-Myc pedals, GSK-3 brakes. Cell Cycle. 2006;5:47–52. doi: 10.4161/cc.5.1.2292. [DOI] [PubMed] [Google Scholar]
- 3.Cayuso J, Ulloa F, Cox B, Briscoe J, Marti E. The Sonic hedgehog pathway independently controls the patterning, proliferation and survival of neuroepithelial cells by regulating Gli activity. Development. 2006;133:517–28. doi: 10.1242/dev.02228. [DOI] [PubMed] [Google Scholar]
- 4.Fuccillo M, Joyner AL, Fishell G. Morphogen to mitogen: the multiple roles of hedgehog signalling in vertebrate neural development. Nat Rev Neurosci. 2006;7:772–83. doi: 10.1038/nrn1990. [DOI] [PubMed] [Google Scholar]
- 5.Palma V, Lim DA, Dahmane N, Sanchez P, Brionne TC, Herzberg CD, Gitton Y, Carleton A, Alvarez-Buylla A, Altaba AR. Sonic hedgehog controls stem cell behavior in the postnatal and adult brain. Development. 2005;132:335–44. doi: 10.1242/dev.01567. [DOI] [PMC free article] [PubMed] [Google Scholar]
- 6.Bourikas D, Pekarik V, Baeriswyl T, Grunditz A, Sadhu R, Nardo M, Stoeckli ET. Sonic hedgehog guides commissural axons along the longitudinal axis of the spinal cord. Nat Neurosci. 2005;8:297–304. doi: 10.1038/nn1396. [DOI] [PubMed] [Google Scholar]
- 7.Charron F, Stein E, Jeong J, McMahon AP, Tessier-Lavigne M. The morphogen sonic hedgehog is an axonal chemoattractant that collaborates with netrin-1 in midline axon guidance. Cell. 2003;113:11–23. doi: 10.1016/s0092-8674(03)00199-5. [DOI] [PubMed] [Google Scholar]
- 8.Kasper M, Regl G, Frischauf AM, Aberger F. GLI transcription factors: mediators of oncogenic Hedgehog signalling. Eur J Cancer. 2006;42:437–45. doi: 10.1016/j.ejca.2005.08.039. [DOI] [PubMed] [Google Scholar]
- 9.Osterlund T, Kogerman P. Hedgehog signalling: how to get from Smo to Ci and Gli. Trends Cell Biol. 2006;16:176–80. doi: 10.1016/j.tcb.2006.02.004. [DOI] [PubMed] [Google Scholar]
- 10.Varjosalo M, Li SP, Taipale J. Divergence of hedgehog signal transduction mechanism between Drosophila and mammals. Dev Cell. 2006;10:177–86. doi: 10.1016/j.devcel.2005.12.014. [DOI] [PubMed] [Google Scholar]
- 11.Briscoe J, Pierani A, Jessell TM, Ericson J. A homeodomain protein code specifies progenitor cell identity and neuronal fate in the ventral neural tube. Cell. 2000;101:435–45. doi: 10.1016/s0092-8674(00)80853-3. [DOI] [PubMed] [Google Scholar]
- 12.Karlstrom RO, Tyurina OV, Kawakami A, Nishioka N, Talbot WS, Sasaki H, Schier AF. Genetic analysis of zebrafish gli1 and gli2 reveals divergent requirements for gli genes in vertebrate development. Development. 2003;130:1549–64. doi: 10.1242/dev.00364. [DOI] [PubMed] [Google Scholar]
- 13.Guner B, Karlstrom RO. Cloning of zebrafish nkx6.2 and a comprehensive analysis of the conserved transcriptional response to Hedgehog/Gli signaling in the zebrafish neural tube, MOD. Gene Expr Patterns. 2007;7:596–605. doi: 10.1016/j.modgep.2007.01.002. [DOI] [PMC free article] [PubMed] [Google Scholar]
- 14.Sasaki H, Hui C, Nakafuku M, Kondoh H. A binding site for Gli proteins is essential for HNF-3beta floor plate enhancer activity in transgenics and can respond to Shh in vitro. Development. 1997;124:1313–22. doi: 10.1242/dev.124.7.1313. [DOI] [PubMed] [Google Scholar]
- 15.Kinzler KW, Vogelstein B. The GLI gene encodes a nuclear protein which binds specific sequences in the human genome. Mol Cell Biol. 1990;10:634–42. doi: 10.1128/mcb.10.2.634. [DOI] [PMC free article] [PubMed] [Google Scholar]
- 16.Ingham PW, Placzek M. Orchestrating ontogenesis: variations on a theme by sonic hedgehog. Nat Rev Genet. 2006;7:841–50. doi: 10.1038/nrg1969. [DOI] [PubMed] [Google Scholar]
- 17.Brand M, Heisenberg CP, Warga RM, Pelegri F, Karlstrom RO, Beuchle D, Picker A, Jiang YJ, Furutani-Seiki M, van Eeden FJ, Granato M, Haffter P, Hammerschmidt M, Kane DA, Kelsh RN, Mullins MC, Odenthal J, Nusslein-Volhard C. Mutations affecting development of the midline and general body shape during zebrafish embryogenesis. Development. 1996;123:129–42. doi: 10.1242/dev.123.1.129. [DOI] [PubMed] [Google Scholar]
- 18.Karlstrom RO, Trowe T, Klostermann S, Baier H, Brand M, Crawford AD, Grunewald B, Haffter P, Hoffmann H, Meyer SU, Muller BK, Richter S, van Eeden FJ, Nusslein-Volhard C, Bonhoeffer F. Zebrafish mutations affecting retinotectal axon pathfinding. Development. 1996;123:427–38. doi: 10.1242/dev.123.1.427. [DOI] [PubMed] [Google Scholar]
- 19.Chen W, Burgess S, Hopkins N. Analysis of the zebrafish smoothened mutant reveals conserved and divergent functions of hedgehog activity. Development. 2001;128:2385–2396. doi: 10.1242/dev.128.12.2385. [DOI] [PubMed] [Google Scholar]
- 20.Varga ZM, Amores A, Lewis KE, Yan YL, Postlethwait JH, Eisen JS, Westerfield M. Zebrafish smoothened functions in ventral neural tube specification and axon tract formation. Development. 2001;128:3497–509. doi: 10.1242/dev.128.18.3497. [DOI] [PubMed] [Google Scholar]
- 21.Barresi MJ, Stickney HL, Devoto SH. The zebrafish slow-muscle-omitted gene product is required for Hedgehog signal transduction and the development of slow muscle identity. Development. 2000;127:2189–99. doi: 10.1242/dev.127.10.2189. [DOI] [PubMed] [Google Scholar]
- 22.Xu J, Srinivas BP, Tay SY, Mak A, Yu X, Lee SG, Yang H, Govindarajan KR, Leong B, Bourque G, Mathavan S, Roy S. Genomewide expression profiling in the zebrafish embryo identifies target genes regulated by Hedgehog signaling during vertebrate development. Genetics. 2006;174:735–52. doi: 10.1534/genetics.106.061523. [DOI] [PMC free article] [PubMed] [Google Scholar]
- 23.Ingham PW, McMahon AP. Hedgehog signaling in animal development: paradigms and principles. Genes Dev. 2001;15:3059–87. doi: 10.1101/gad.938601. [DOI] [PubMed] [Google Scholar]
- 24.Briscoe J, Sussel L, Serup P, Hartigan-O'Connor D, Jessell TM, Rubenstein JL, Ericson J. Homeobox gene Nkx2.2 and specification of neuronal identity by graded Sonic hedgehog signalling. Nature. 1999;398:622–7. doi: 10.1038/19315. [DOI] [PubMed] [Google Scholar]
- 25.Concordet JP, Lewis KE, Moore JW, Goodrich LV, Johnson RL, Scott MP, Ingham PW. Spatial regulation of a zebrafish patched homologue reflects the roles of sonic hedgehog and protein kinase A in neural tube and somite patterning. Development. 1996;122:2835–46. doi: 10.1242/dev.122.9.2835. [DOI] [PubMed] [Google Scholar]
- 26.Bauer H, Meier A, Hild M, Stachel S, Economides A, Hazelett D, Harland RM, Hammerschmidt M. Follistatin and noggin are excluded from the zebrafish organizer. Dev Biol. 1998;204:488–507. doi: 10.1006/dbio.1998.9003. [DOI] [PubMed] [Google Scholar]
- 27.Amthor H, Christ B, Rashid-Doubell F, Kemp CF, Lang E, Patel K. Follistatin regulates bone morphogenetic protein-7 (BMP-7) activity to stimulate embryonic muscle growth. Dev Biol. 2002;243:115–27. doi: 10.1006/dbio.2001.0555. [DOI] [PubMed] [Google Scholar]
- 28.Fainsod A, Deissler K, Yelin R, Marom K, Epstein M, Pillemer G, Steinbeisser H, Blum M. The dorsalizing and neural inducing gene follistatin is an antagonist of BMP-4. Mech Dev. 1997;63:39–50. doi: 10.1016/s0925-4773(97)00673-4. [DOI] [PubMed] [Google Scholar]
- 29.Liem KF, Jr., Jessell TM, Briscoe J. Regulation of the neural patterning activity of sonic hedgehog by secreted BMP inhibitors expressed by notochord and somites. Development. 2000;127:4855–66. doi: 10.1242/dev.127.22.4855. [DOI] [PubMed] [Google Scholar]
- 30.Gallo VP, Civinini A. Survey of the adrenal homolog in teleosts. Int Rev Cytol. 2003;230:89–187. doi: 10.1016/s0074-7696(03)30003-8. [DOI] [PubMed] [Google Scholar]
- 31.Else T, Hammer GD. Genetic analysis of adrenal absence: agenesis and aplasia. Trends Endocrinol Metab. 2005;16:458–68. doi: 10.1016/j.tem.2005.10.004. [DOI] [PubMed] [Google Scholar]
- 32.Bollig F, Mehringer R, Perner B, Hartung C, Schafer M, Schartl M, Volff JN, Winkler C, Englert C. Identification and comparative expression analysis of a second wt1 gene in zebrafish. Dev Dyn. 2006;235:554–61. doi: 10.1002/dvdy.20645. [DOI] [PubMed] [Google Scholar]
- 33.Hsu HJ, Lin G, Chung BC. Parallel early development of zebrafish interrenal glands and pronephros: differential control by wt1 and ff1b. Development. 2003;130:2107–16. doi: 10.1242/dev.00427. [DOI] [PubMed] [Google Scholar]
- 34.Urban AE, Zhou X, Ungos JM, Raible DW, Altmann CR, Vize PD. FGF is essential for both condensation and mesenchymal-epithelial transition stages of pronephric kidney tubule development. Dev Biol. 2006;297:103–17. doi: 10.1016/j.ydbio.2006.04.469. [DOI] [PubMed] [Google Scholar]
- 35.Chai C, Liu YW, Chan WK. Ff1b is required for the development of steroidogenic component of the zebrafish interrenal organ. Dev Biol. 2003;260:226–44. doi: 10.1016/s0012-1606(03)00219-7. [DOI] [PubMed] [Google Scholar]
- 36.Bose J, Grotewold L, Ruther U. Pallister-Hall syndrome phenotype in mice mutant for Gli3. Hum Mol Genet. 2002;11:1129–35. doi: 10.1093/hmg/11.9.1129. [DOI] [PubMed] [Google Scholar]
- 37.Cavodeassi F, Diez Del Corral R, Campuzano S, Dominguez M. Compartments and organising boundaries in the Drosophila eye: the role of the homeodomain Iroquois proteins. Development. 1999;126:4933–42. doi: 10.1242/dev.126.22.4933. [DOI] [PubMed] [Google Scholar]
- 38.Gomez-Skarmeta JL, Modolell J. araucan and caupolican provide a link between compartment subdivisions and patterning of sensory organs and veins in the Drosophila wing. Genes Dev. 1996;10:2935–45. doi: 10.1101/gad.10.22.2935. [DOI] [PubMed] [Google Scholar]
- 39.Gomez-Skarmeta JL, Glavic A, de la Calle-Mustienes E, Modolell J, Mayor R. Xiro, a Xenopus homolog of the Drosophila Iroquois complex genes, controls development at the neural plate. Embo J. 1998;17:181–90. doi: 10.1093/emboj/17.1.181. [DOI] [PMC free article] [PubMed] [Google Scholar]
- 40.Cheng CW, Yan CH, Hui CC, Strahle U, Cheng SH. The homeobox gene irx1a is required for the propagation of the neurogenic waves in the zebrafish retina. Mech Dev. 2006;123:252–63. doi: 10.1016/j.mod.2005.12.001. [DOI] [PubMed] [Google Scholar]
- 41.Wang X, Emelyanov A, Sleptsova-Friedrich I, Korzh V, Gong Z. Expression of two novel zebrafish iroquois homologues (ziro1 and ziro5) during early development of axial structures and central nervous system. Mech Dev. 2001;105:191–5. doi: 10.1016/s0925-4773(01)00400-2. [DOI] [PubMed] [Google Scholar]
- 42.Furuse M, Sasaki H, Fujimoto K, Tsukita S. A single gene product, claudin-1 or -2, reconstitutes tight junction strands and recruits occludin in fibroblasts. J Cell Biol. 1998;143:391–401. doi: 10.1083/jcb.143.2.391. [DOI] [PMC free article] [PubMed] [Google Scholar]
- 43.Bronstein JM. Function of tetraspan proteins in the myelin sheath. Curr Opin Neurobiol. 2000;10:552–7. doi: 10.1016/s0959-4388(00)00125-2. [DOI] [PubMed] [Google Scholar]
- 44.Simon DB, Lu Y, Choate KA, Velazquez H, Al-Sabban E, Praga M, Casari G, Bettinelli A, Colussi G, Rodriguez-Soriano J, McCredie D, Milford D, Sanjad S, Lifton RP. Paracellin-1, a renal tight junction protein required for paracellular Mg2+ resorption. Science. 1999;285:103–6. doi: 10.1126/science.285.5424.103. [DOI] [PubMed] [Google Scholar]
- 45.Wilcox ER, Burton QL, Naz S, Riazuddin S, Smith TN, Ploplis B, Belyantseva I, Ben-Yosef T, Liburd NA, Morell RJ, Kachar B, Wu DK, Griffith AJ, Friedman TB. Mutations in the gene encoding tight junction claudin-14 cause autosomal recessive deafness DFNB29. Cell. 2001;104:165–72. doi: 10.1016/s0092-8674(01)00200-8. [DOI] [PubMed] [Google Scholar]
- 46.Kollmar R, Nakamura SK, Kappler JA, Hudspeth AJ. Expression and phylogeny of claudins in vertebrate primordia. Proc Natl Acad Sci U S A. 2001;98:10196–201. doi: 10.1073/pnas.171325898. [DOI] [PMC free article] [PubMed] [Google Scholar]
- 47.Korzh V, Sleptsova I, Liao J, He J, Gong Z. Expression of zebrafish bHLH genes ngn1 and nrd defines distinct stages of neural differentiation. Dev Dyn. 1998;213:92–104. doi: 10.1002/(SICI)1097-0177(199809)213:1<92::AID-AJA9>3.0.CO;2-T. [DOI] [PubMed] [Google Scholar]
- 48.Naya FJ, Huang HP, Qiu Y, Mutoh H, DeMayo FJ, Leiter AB, Tsai MJ. Diabetes, defective pancreatic morphogenesis, and abnormal enteroendocrine differentiation in BETA2/neuroD-deficient mice. Genes Dev. 1997;11:2323–34. doi: 10.1101/gad.11.18.2323. [DOI] [PMC free article] [PubMed] [Google Scholar]
- 49.Andermann P, Ungos J, Raible DW. Neurogenin1 defines zebrafish cranial sensory ganglia precursors. Dev Biol. 2002;251:45–58. doi: 10.1006/dbio.2002.0820. [DOI] [PubMed] [Google Scholar]
- 50.Koblar SA, Murphy M, Barrett GL, Underhill A, Gros P, Bartlett PF. Pax-3 regulates neurogenesis in neural crest-derived precursor cells. J Neurosci Res. 1999;56:518–30. doi: 10.1002/(SICI)1097-4547(19990601)56:5<518::AID-JNR7>3.0.CO;2-8. [DOI] [PubMed] [Google Scholar]
- 51.Devoto SH, Stoiber W, Hammond CL, Steinbacher P, Haslett JR, Barresi MJ, Patterson SE, Adiarte EG, Hughes SM. Generality of vertebrate developmental patterns: evidence for a dermomyotome in fish. Evol Dev. 2006;8:101–10. doi: 10.1111/j.1525-142X.2006.05079.x. [DOI] [PMC free article] [PubMed] [Google Scholar]
- 52.Marcelle C, Ahlgren S, Bronner-Fraser M. In vivo regulation of somite differentiation and proliferation by Sonic Hedgehog. Dev Biol. 1999;214:277–87. doi: 10.1006/dbio.1999.9389. [DOI] [PubMed] [Google Scholar]
- 53.Feng X, Adiarte EG, Devoto SH. Hedgehog acts directly on the zebrafish dermomyotome to promote myogenic differentiation. Dev Biol. 2006;300:736–46. doi: 10.1016/j.ydbio.2006.08.056. [DOI] [PubMed] [Google Scholar]
- 54.Eggenschwiler JT, Espinoza E, Anderson KV. Rab23 is an essential negative regulator of the mouse Sonic hedgehog signalling pathway. Nature. 2001;412:194–8. doi: 10.1038/35084089. [DOI] [PubMed] [Google Scholar]
- 55.Ulloa F, Itasaki N, Briscoe J. Inhibitory Gli3 activity negatively regulates Wnt/beta-catenin signaling. Curr Biol. 2007;17:545–50. doi: 10.1016/j.cub.2007.01.062. [DOI] [PubMed] [Google Scholar]
- 56.Gulacsi A, Lillien L. Sonic hedgehog and bone morphogenetic protein regulate interneuron development from dorsal telencephalic progenitors in vitro. J Neurosci. 2003;23:9862–72. doi: 10.1523/JNEUROSCI.23-30-09862.2003. [DOI] [PMC free article] [PubMed] [Google Scholar]
- 57.Palma V, Ruiz i Altaba A. Hedgehog-GLI signaling regulates the behavior of cells with stem cell properties in the developing neocortex. Development. 2004;131:337–45. doi: 10.1242/dev.00930. [DOI] [PubMed] [Google Scholar]
- 58.Ruiz i Altaba A, Stecca B, Sanchez P. Hedgehog--Gli signaling in brain tumors: stem cells and paradevelopmental programs in cancer. Cancer Lett. 2004;204:145–57. doi: 10.1016/S0304-3835(03)00451-8. [DOI] [PubMed] [Google Scholar]
- 59.Westerfield M. The Zebrafish Book. A guide for the laboratory use of zebrafish (Danio rerio) 4 ed. University of Oregon Press; Eugene, OR: 2000. [Google Scholar]
- 60.Kimmel CB, Ballard WW, Kimmel SR, Ullmann B, Schilling TF. Stages of Embryonic Development of the Zebrafish. 1995;203:253–310. doi: 10.1002/aja.1002030302. [DOI] [PubMed] [Google Scholar]
- 61.Ekker SC, Ungar AR, Greenstein P, von Kessler DP, Porter JA, Moon RT, Beachy PA. Patterning activities of vertebrate hedgehog proteins in the developing eye and brain. Curr Biol. 1995;5:944–55. doi: 10.1016/s0960-9822(95)00185-0. [DOI] [PubMed] [Google Scholar]
- 62.Horak CE, Lee JH, Elkahloun AG, Boissan M, Dumont S, Maga TK, Arnaud-Dabernat S, Palmieri D, Stetler-Stevenson WG, Lacombe ML, Meltzer PS, Steeg PS. Nm23-H1 suppresses tumor cell motility by down-regulating the lysophosphatidic acid receptor EDG2. Cancer Res. 2007;67:7238–46. doi: 10.1158/0008-5472.CAN-07-0962. [DOI] [PubMed] [Google Scholar]
- 63.Karlstrom RO, Talbot WS, Schier AF. Comparative synteny cloning of zebrafish you-too: mutations in the Hedgehog target gli2 affect ventral forebrain patterning. Genes Dev. 1999;13:388–93. doi: 10.1101/gad.13.4.388. [DOI] [PMC free article] [PubMed] [Google Scholar]
- 64.Seo HC, Saetre BO, Havik B, Ellingsen S, Fjose A. The zebrafish Pax3 and Pax7 homologues are highly conserved, encode multiple isoforms and show dynamic segment-like expression in the developing brain. Mech Dev. 1998;70:49–63. doi: 10.1016/s0925-4773(97)00175-5. [DOI] [PubMed] [Google Scholar]
- 65.Serluca FC, Fishman MC. Pre-pattern in the pronephric kidney field of zebrafish. Development. 2001;128:2233–41. doi: 10.1242/dev.128.12.2233. [DOI] [PubMed] [Google Scholar]
- 66.Chai C, Chan WK. Developmental expression of a novel Ftz-F1 homologue, ff1b (NR5A4), in the zebrafish Danio rerio. Mech Dev. 2000;91:421–6. doi: 10.1016/s0925-4773(99)00312-3. [DOI] [PubMed] [Google Scholar]
- 67.Lecaudey V, Anselme I, Dildrop R, Ruther U, Schneider-Maunoury S. Expression of the zebrafish Iroquois genes during early nervous system formation and patterning. J Comp Neurol. 2005;492:289–302. doi: 10.1002/cne.20765. [DOI] [PubMed] [Google Scholar]
Associated Data
This section collects any data citations, data availability statements, or supplementary materials included in this article.
Supplementary Materials
(A) Lowess Normalization. Due to the unanticipated sample RNA concentration and cy3 or cy5 dye characteristics, two-color fluorescent hybridization may introduce some intensity-dependent variation in collected data sets. One of the most commonly utilized normalization techniques, the locally weighted scatterplot smoothing (LOWESS) algorithm, applies a nonlinear smoothing adjustment that removes such variation. The adjusted ratio, or normalized ratio, is computed by: [log(R/G) = log(R/G) – c(A)] where c(A) is the Lowess fit to the log(R/G) vs. log(sqrt(R*G)) plot (the red-line in the figure). The degree of smoothing is determined by the window width parameter. A larger window width results in a smoother curve, a smaller window results in more local variation. The MATLAB implementation of Lowess is as follows; x = log2(red) + log2(green), y = log2(red) – log2(green), rSmooth = malowess( x, y ), rNorm = y – rSmooth, where rNorm is the normalized log2-ratio, and red and green are input red- and green-channel intensities, respectively. (B) Pie chart showing the percentage of identified Hh regulated genes in several different functional groups.
Supplementary Table 2. List of all genes on the Compugen, Operon, and MWG microarrays and their regulation by Hh (Microsoft Excel format).
Supplementary Table 1: PCR primers for generating in situ probes