

Abstract
Manganese-enhanced magnetic resonance imaging (MEMRI) provides a powerful tool to study multisynaptic circuits in vivo and thereby to link information about neural structure and function within individual subjects. Making the best use of MEMRI in monkeys requires minimizing manganese-associated neurotoxicity, maintaining sensitivity to manganese-dependent signal changes and mapping transport throughout the brain without a priori anatomical hypotheses. Here, we performed intracortical injections of isotonic MnCl2, comparisons of preinjection and postinjection scans, and voxelwise statistical mapping. Isotonic MnCl2 did not cause cell death at the injection site, damage to downstream targets of manganese transport, behavioral deficits, or changes in neuronal responsiveness. We detected and mapped manganese transport throughout cortical–subcortical circuits by using voxelwise statistical comparisons of at least 10 preinjection and two postinjection scans. We were able to differentiate between focal and diffuse projection fields and to distinguish between the topography of striatal projections from orbitofrontal and anterior cingulate cortex in a single animal. This MEMRI approach provides a basis for combining circuit-based anatomical analyses with simultaneous single-unit recordings and/or functional magnetic resonance imaging in individual monkeys. Such studies will enhance our interpretations of functional data and our understanding of how neuronal activity is transformed as it propagates through a circuit.
Keywords: orbitofrontal cortex, anterior cingulate cortex, striatum, neuroanatomy, tract tracing, nonhuman primate
Introduction
In vivo tract tracing makes it possible to study the topography, plasticity, and function of different neural circuits in individual subjects (Saleem et al., 2002; Silva et al., 2004). Manganese-enhanced magnetic resonance imaging (MEMRI) provides a promising tool for identifying neuronal circuits in vivo (Pautler et al., 1998; Pautler, 2004). Manganese enters neurons via calcium channels, is transported along microtubules, and crosses synapses. Manganese ions are paramagnetic and can be localized using T1-weighted MRI (Silva et al., 2004). Multisynaptic neuronal circuits have been visualized after intracerebral injections of manganese chloride (MnCl2) in birds, rats, and monkeys (Sloot and Gramsbergen, 1994; Saleem et al., 2002; Van der Linden et al., 2002; Pautler et al., 2003; Watanabe et al., 2004; Murayama et al., 2006).
To make the best use of MEMRI, three technical issues must be addressed: manganese toxicity, manganese detection, and mapping of manganese transport. First, manganese is neurotoxic. Manganese overexposure leads to a parkinsonian-like syndrome in humans (Pal et al., 1999). In monkeys, systemic manganese injections lead to parkinsonian symptoms, basal ganglia pathology, and reductions in dopaminergic enzymes and receptors (Eriksson et al., 1987, 1992; Olanow et al., 1996). Striatal injections of MnCl2 lead to reduced ATP and neurotransmitter levels in rats (Brouillet et al., 1993). Manganese neurotoxicity might interfere with the interpretation of neuroanatomical data (Canals et al., 2008) and might damage regions in which electrophysiological recordings are planned.
One way to decrease manganese neurotoxicity is to decrease the concentration of MnCl2 injected (Canals et al., 2008). However, decreasing the MnCl2 concentration makes detecting manganese-dependent changes in T1 weighting more difficult (Silva et al., 2004). Compensating for a lower MnCl2 concentration presents several technical challenges. For example, high-tesla magnets may not have bore diameters large enough to accommodate monkeys. Longer and/or repeated scans could increase the time of each experiment and the physiological burden on each subject.
To be most useful, MEMRI should make it possible to map the known axonal projections in a particular individual and to detect previously unidentified circuits. However, previous MEMRI studies have relied on region-of-interest analyses, group analysis, and/or normalizations of signal intensities to control brain regions (Watanabe et al., 2001; Saleem et al., 2002; Van der Linden et al., 2002, 2008; Leergaard et al., 2003; Pautler et al., 2003; Van Meir et al., 2004; Bilgen, 2006; Murayama et al., 2006; Canals et al., 2008). Region-of-interest analyses can be limited by a priori anatomical hypotheses. Group averages may obscure individual neuroanatomical differences in monkeys. Because Mn2+ is transported transynaptically, it may be difficult to choose reliably manganese-free control regions for signal normalization.
In this study, we have addressed each of these three challenges. We have identified and used a nontoxic concentration of MnCl2. We have improved our ability to detect manganese transport by comparing postinjection with preinjection scans. We have adapted an analytical technique from functional MRI to provide unbiased maps of manganese transport from two regions of prefrontal cortex.
Materials and Methods
Animals.
Three monkeys were used in these experiments: one male rhesus (monkey P; 5–5.5 kg), one male cynomolgus (monkey S; 5 kg), and one female cynomolgus (monkey T; 4.6–6 kg).
Surgery.
We implanted magnet-compatible recording chambers and head fixation posts (Cilux recording chambers and PEEK head holders from Crist Instruments; ceramic screws from Thomas Recording) using sterile surgical procedures. Surgeries took place under general anesthesia in a veterinary operating facility. Craniotomy and chamber locations were determined from presurgical magnetic resonance images of each animal's brain. All procedures were performed according to National Institutes of Health guidelines and approved by the National Institute of Mental Health Animal Care and Use Committee.
Manganese chloride injections.
We made microinjections of MnCl2·4H2O (Sigma-Aldrich) into orbitofrontal cortex (OFC) and anterior cingulate cortex (ACC). Injections were made with a 0.5 μl Hamilton syringe through recording grids with 1 mm spacing (Crist Instruments). Concentrations of MnCl2 were either 800 or 120 mm in sterile water. Total volumes of MnCl2 ranged between 0.2 and 0.5 μl (Table 1). MnCl2 solutions were not buffered. Injections were made extremely slowly, over 20–30 min (e.g., at a rate of 0.01–0.25 μl/min). During injections, monkeys were sedated with ketamine (10 mg/kg, i.m.) and medetomidine (20 μg/kg, i.m.).
Table 1.
Experimental parameters
| Monkey | Injection location | MnCl2 concentration (mm) | MnCl2 volume (μl) | Number of preinjection scans (no. of sessions) | Postinjection scanning daysa |
|---|---|---|---|---|---|
| P | OFC | 800 | 0.5 | 0 | 0, 4 |
| T | OFC | 120 | 0.2 | 12 (7) | 0, 2, 4 |
| S | OFC | 120 | 0.3 | 10 (7) | 0b, 2, 4 |
| S | ACC | 120 | 0.3 | 10 (7) | 0, 4, 7 |
OFC, Area 13; ACC, area 24c.
aDay 0, Single scan; days 2, 4, or 7, two scans at each time point.
bOFC injection in monkey S made 11 weeks after ACC injection.
MRI data acquisition.
We obtained magnetic resonance images regularly throughout this study to determine initial recording chamber placement and to localize injection and recording sites. Because we required stereotaxic coordinates for these scans and the bore size of the 4.7 T magnet did not accommodate our magnet-compatible stereotaxic head holder, these MRIs were obtained on a 1.5 T GE Signa unit. We used a 5-inch general purpose surface coil and a three-dimensional volume spoiled gradient echo pulse sequence [echo time (TE), 6 ms; repetition time (TR), 25 ms; flip angle, 30°, field of view, 11 cm; slice thickness, 1 mm].
We obtained high-resolution images for MEMRI analyses on a horizontal Bruker 4.7 T MRI system (Bruker Biospin MRI) using a custom-made oval surface coil (10 × 12 cm) for transmit and receive. All images were acquired with a gradient echo pulse sequence and nominal isotropic resolution of 0.5 mm3. One or more MRIs for each animal were obtained to highlight gray–white matter contrast and identify anatomical landmarks (TR, 100 ms; TE, 6.5 ms; apparent flip angle, 10°). To optimize contrast attributable to MnCl2, sequence parameters were as follows: TR, 100 ms; TE, 3.5–4.7; apparent flip angle, 45°.
We obtained a series of preinjection baseline MRIs with the MnCl2 sequence parameters before the 120 mm MnCl2 injections. Postinjection scans were obtained immediately after the injection (day 0), on days 2 and/or 4, and/or day 7 (Table 1). Across scanning sessions, precise measurements and markers were used to ensure consistent placement of the monkey's head in the head holder, the surface coil relative to the monkey's head, and the monkey's head within the magnet. Each scan was aligned to the anterior commissure–posterior commissure line to facilitate subsequent automated volume registration.
During all magnetic resonance sessions, monkeys were sedated with ketamine (initial dose, 10 mg/kg, i.m.; subsequent doses, 5 mg/kg, i.m., every 30–40 min) and medetomidine (20 μg/kg, i.m., every 60–80 min). Heart rate, temperature, and blood oxygenation were monitored, and heart rate was maintained with glycopyrrolate (15 μg/kg, i.m., before first dose of ketamine and every 3 h thereafter as needed).
MRI data analyses.
Signal enhancements resulting from Mn2+ uptake and transport were easily seen by eye after injections of high-concentration MnCl2 (800 mm). Because of the strong contrast in these volumes, we simply applied a reasonable nonquantitative threshold and used a color lookup table available in NIH ImageJ (Abramoff et al., 2004) to highlight the areas of Mn2+ transport.
We could not detect Mn2+ transport after injections of isotonic MnCl2 (120 mm) without additional analyses to increase sensitivity. To do so, we compared signal intensities in postinjection versus preinjection volumes. Such comparisons could have been made simply by taking the difference at every voxel between one postinjection and one preinjection scan. However, such a simple approach would fail to take into account the signal variance arising at each voxel because of differences between individual scans and across scanning sessions. The noise present in magnetic resonance imaging introduces signal changes during each scan that are unrelated to Mn2+ transport. Moreover, because the Mn2+-related signal is weaker with lower concentrations of MnCl2, noise-induced signal changes may become comparable in size with Mn2+-related signal enhancements.
Therefore, we used an approach designed to obtain estimates of the variance in both preinjection and postinjection scans. We first collected a set of preinjection scans (Npre) over a period of days before the MnCl2 injections. On the day of injection, we acquired one scan, merely to verify the site of injection. For each subsequent postinjection day, we obtained two successive scans (Npost) to allow for statistical testing of signal enhancements attributable to Mn2+. All preinjection and postinjection images were obtained using the same scanning setup and parameters.
Table 1 shows the number and chronology of preinjection and postinjection scans for each of the subjects in this study. Note that, although it is obviously best to obtain a large number of preinjection scans and repeated acquisitions of postinjection scans at each time point, the availability of dedicated time on the magnet, the duration and complexity of the scanning procedure itself, and our concerns for the welfare of the monkeys placed practical limitations on the experimental design. The acquisition of each high-resolution image took 1 h 47 min. Taking into consideration animal preparation time, tuning and shimming requirements, and anesthesia limitations, we were able to acquire two full high-resolution volumes during a 4–5 h scanning session. We scheduled scanning sessions twice weekly for ∼3 weeks before the MnCl2 injections. Therefore, for each animal, we obtained 10–12 preinjection scans and two scans at each postinjection time point.
Analysis of Functional NeuroImages (AFNI) was used for image processing and analyses (Cox, 1996; Cox and Hyde, 1997). Pre-processing steps were performed as follows. First, the skull was stripped from each preinjection and postinjection scan using the 3dSkullStrip program of AFNI. All skull-stripped preinjection scans were then registered together using non-rigid 12-parameter affine transforms, and an average preinjection volume was calculated. This average preinjection volume was then used as a reference for registering anew all the original preinjection scans. Postinjection volumes were also registered to the average preinjection volume at this stage. Once registered, image non-uniformity was reduced using AFNI's 3dUniformize, and a spatial smoothing of 1 mm full-width at half-maximum (FWHM) was applied to increase the signal-to-noise ratio. Each volume was then normalized to its own mean voxel intensity to correct for scanner amplifier gain differences between scans. At this stage, we had a set of preinjection scans in register, with image nonhomogeneity reduced and scaled to the same mean intensity. The next step consisted of ascertaining where there was significant signal enhancement in the postinjection scans on a voxelwise basis.
For each postinjection time point, we used a two-sample t test to compare the signal intensity in the two postinjection scans with that in the preinjection scans on a voxelwise basis. Given the small sample size and the potential for artifacts, we also confirmed our results with a nonparametric permutation technique. We took the total number of preinjection and postinjection scans (Ntotal = Npre + Npost) and compared the mean of any two of those scans (k = 2) with the mean of the remaining scans. At each voxel, we calculated the difference between the means for each of the possible C combinations of scans (C = N choose 2 combinations = N!/k!(N − k)!). We then mapped those voxels for which the biggest difference occurred when the scan sets contained the true preinjection and postinjection scans. The difference between the means at each of those voxels served as a measure of the degree of signal enhancement. The probability of finding signal enhancement by chance alone in any particular voxel with this technique depends on the total number of scans and the number of possible combinations. Specifically, p = 1/C voxelwise (for monkey S, p = 0.015; for monkey T, p = 0.011). We found that images obtained using this nonparametric method corroborated our findings using the t test at the same p value. Because the parametric statistics allowed us greater flexibility to localize and compare Mn2+ signal enhancements at different thresholds, we used the t test results in generating all additional Mn2+ transport maps.
After obtaining the voxelwise statistics, we corrected for false positives resulting from multiple comparisons by enforcing spatial constraints on the signal enhancement maps. This family-wise correction method uses spatial smoothness estimates of the noise in the data to determine the likelihood of observing spatial clusters of various sizes. The spatial smoothness of the noise was estimated from preinjection images, after removing anatomical spatial structure by voxelwise low-order trending of the series of preinjection scans. The FWHM of the smoothing filter was then estimated per the method described by Forman et al. (1995) using the 3dFWHMx program of AFNI. With this measure of spatial smoothness, the number of brain voxels in each image, and a given voxelwise probability of false positives, we could use the AlphaSim program of AFNI to perform a Monte Carlo simulation and estimate the probability of obtaining clusters of a particular size by chance alone. We then corrected for multiple comparisons by rejecting spatial clusters smaller than what would be expected by chance. For both monkeys, the minimum cluster size threshold was set such that the corrected p value of the signal intensity maps was p ≤ 0.01 (monkey S, 375 voxels; monkey T, 285 voxels).
This method allows us to measure MEMRI signal intensities across an entire brain volume after a single injection of MnCl2 in an individual animal. After any particular injection, signal intensities can be displayed as projection density maps and compared across transport sites or time. As with any tract tracing technique, variability in uptake and transport inevitably arises from differences in injection placement, from small changes in neuronal density at the injection site, and/or from primarily unpredictable metabolic changes that affect tracer absorption and diffusion. Thus, the patterns in the projection density maps can be compared across animals or injections, but the absolute signal intensity values themselves cannot be compared.
Behavioral and electrophysiological testing.
Behavioral testing and electrophysiological recording began after completion of the MnCl2 injections and postinjection MRI sessions. In monkey S, the 2 weeks of daily sessions began 10 d after the last orbitofrontal injection. In monkey T, behavioral and recording sessions began 23 d after the orbitofrontal injection and lasted 3 weeks.
In all behavioral sessions, monkeys responded to visual stimuli presented on a computer display monitor. Behavioral control and data acquisition were performed using the REX program (Hays et al., 1982). Neurobehavioral Systems Presentation software was used to display visual stimuli. Licking data were obtained through a strain gauge attached to the sipper tube through which liquid was delivered.
The monkeys were exposed to a classical conditioning paradigm in which visual stimuli were presented on a computer monitor in random order. One visual cue (CS+) was followed by a liquid reward; after the other visual stimulus (CS−), there was no reward (Fig. 1A). We measured the proportion of CS+ versus CS− trials with anticipatory licking.
Figure 1.
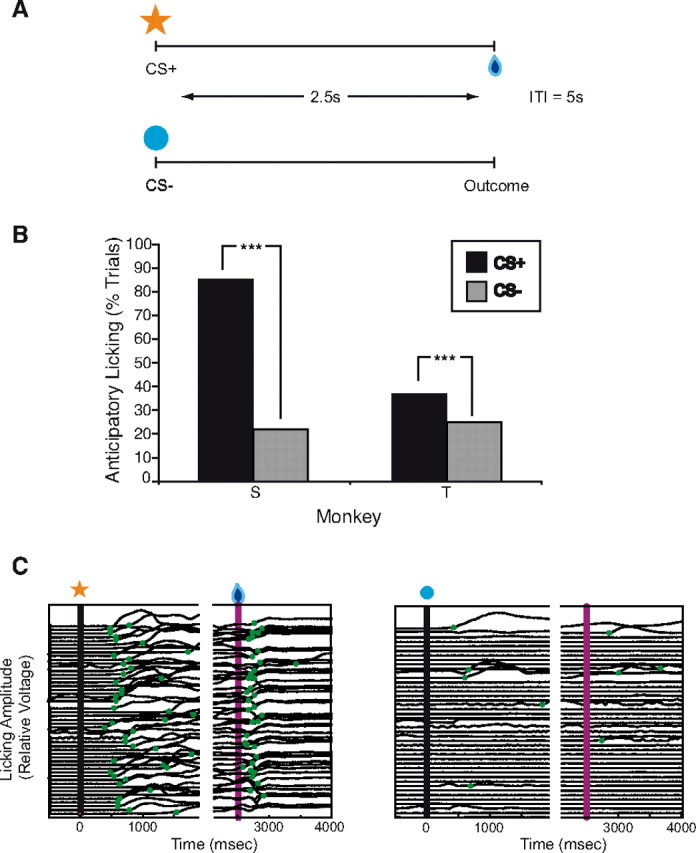
Classical conditioning paradigm and behavioral results after isotonic MnCl2 injections. A, Schematic of the classical conditioning paradigm. Each trial consisted of the presentation of a visual stimulus on a computer screen followed 2.5 s later by the trial outcome. In CS+ trials, the visual stimulus was an orange star, and the outcome was a liquid reward. In CS− trials, the visual stimulus was a blue circle, and the outcome was no reward. Trials were presented in random order. Intertrial intervals (ITI) were 5 s in length. B, Percentages of CS+ (black bars) versus CS− (gray bars) trials with anticipatory licking. Monkeys S and T showed significantly more anticipatory licking in CS+ trials, as expected. C, Licking amplitude (changes in voltage measured by a strain gauge) as a function of time in a single behavioral session for monkey S. The left shows all of the CS+ trials in this session; the right shows all of the CS− trials. The timing of significant increases in amplitude is marked with green circles. Anticipatory licking began >1 s before trial outcome in the CS+ trials but not in most of the CS− trials. Licking also increases after the delivery of the reward in CS+ trials.
Single-unit recordings were obtained from orbitofrontal cortex while the monkeys performed this task. All well-isolated single-unit action potentials were recorded and included in the data analyses. Action potentials were converted to pulses using a time-voltage window discriminator (FHC) and were recorded at 1 ms resolution with REX.
Histology.
At the completion of these experiments, all monkeys were transcardially perfused with 4% paraformaldehyde, and the brains were removed for histological processing. Monkey P's brain was obtained 1 y after the first MnCl2 injection and 1 month after the last injection. Monkey S's brain was obtained 6 months after the first MnCl2 injection and 23 d after the last injection. Monkey T's brain was obtained 4 months after the MnCl2 injection.
Brains were cryoprotected in a solution of 10% glycerol and 2% DMSO in 0.1 m phosphate buffer for 24 h and then a transferred to a 20% glycerol solution for 5 d. Brains were blocked and frozen using isopentane at −80°C. Coronal sections were cut at 40 μm on a freezing microtome. Sections were taken from the frontal pole through to the rostral cerebellum. Separate series of sections were processed for Nissl substance, cytochrome oxidase, and/or tyrosine hydroxylase (TH). Within each series, adjacent sections were within 400 μm.
The cytochrome oxidase incubation solution consisted of 0.5 mg/ml cytochrome c, 100 mg/ml sucrose, 0.25 mg/ml 3,3′-dioaminobenzidine tetrahydrochloride (DAB) tablets, and 0.1 mg/ml catalase in 0.1 m PBS at pH 7.4. All cytochrome oxidase reagents were obtained from Sigma-Aldrich.
For TH immunohistochemistry, we incubated the sections with primary antibody (mouse anti-TH; Millipore Bioscience Research Reagents) overnight at room temperature, with secondary antibody (anti-mouse IgG made in horse, ABC Elite Kit; Vector Laboratories) and BSA (Sigma-Aldrich) for 1 h and with solutions from the Vectastain ABC Elite Kit (Vector Laboratories) for 90 min. Sections were developed with DAB tablets (Sigma-Aldrich).
Results
High-concentration MnCl2 (800 mm)
Manganese transport
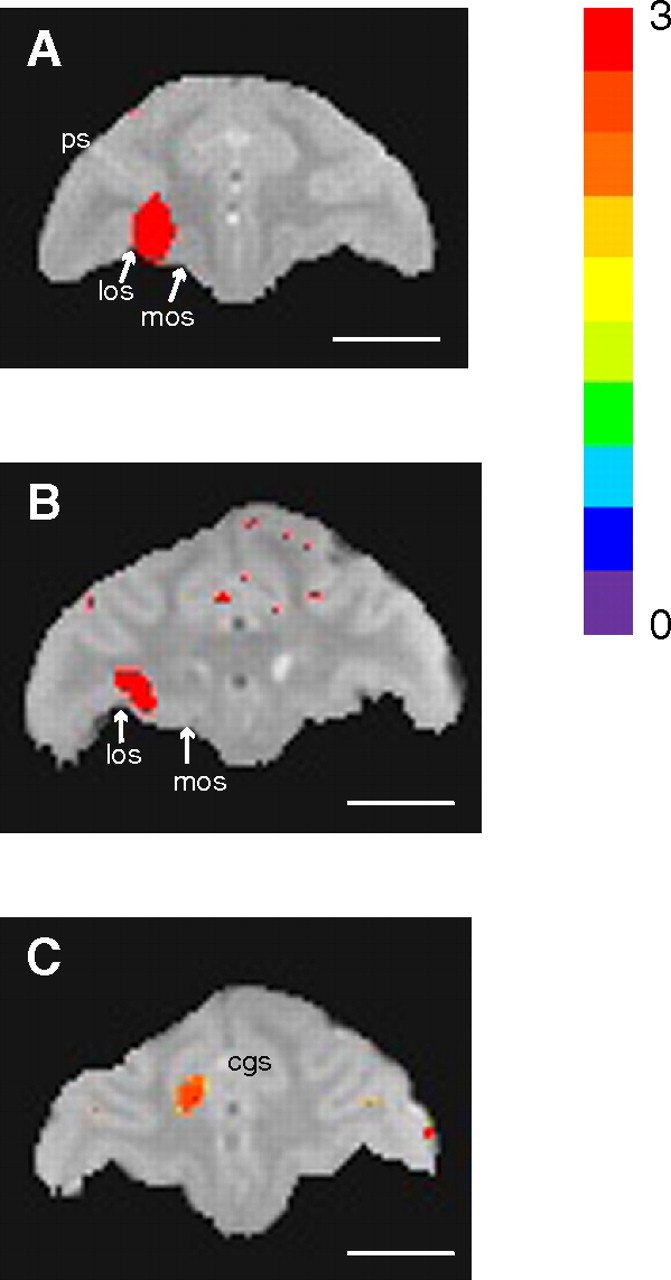
Injections of 800 mm MnCl2 were made into OFC on three separate occasions over a 1 year period in one animal (monkey P) (Table 1). Changes in signal intensity attributable to Mn2+ were visible to the naked eye on the MRIs obtained within 3 h of these injections (day 0). Injections were centered in and covered most of OFC area 13 (Fig. 2A). Increases in signal intensity attributable to Mn2+ transport were also visible by eye on postinjection day 4 (Fig. 2B–D). Mn2+ signal was detected throughout the cortical–striatal–thalamic loop, to areas including ventrolateral caudate and ventromedial putamen, globus pallidus externa and interna, ventral pallidum, substantia nigra, mediodorsal nucleus of the thalamus, and habenula. Mn2+ enhancement was also visible in white matter tracts, most notably in the internal capsule between OFC and the ventral striatal region. These imaging results confirm that specific cortical–subcortical projections can be mapped using intracortical injections of high-concentration MnCl2 in monkeys (Saleem et al., 2002).
Figure 2.

Manganese transport images after injections of high-concentration (800 mm) MnCl2 into OFC of monkey P. All images acquired at 4.7 T with 0.5 mm3 resolution (TR, 100 ms; TE, 3.5 ms; flip angle, 45°). Mn2+-related signal enhancements resulting from shortened T1 were easily seen as bright white voxels. These voxels have been highlighted using the “Fire” color lookup table from NIH ImageJ (Abramoff et al., 2004). A, The injection site within 3 h of the MnCl2 injection, in the coronal plane. The central portion of the injection site appears black because of the very short T2 that occurs in areas of very-high-concentration Mn2+. The injection site covered most of OFC area 13 and extended into the white matter directly above OFC. los, Lateral orbital sulcus; mos, medial orbital sulcus; ps, principal sulcus. B, Postinjection day 4. Mn2+ transport from OFC to ventrolateral caudate (Cd) and ventromedial putamen (Pu) via the internal capsule (ic), in the coronal plane. C, Postinjection day 4. Mn2+ transport from OFC to striatum via the internal capsule, in the horizontal plane. Thin lines indicate rostrocaudal levels of the OFC injection site, Cd/Pu, and globus pallidus (GP). D, Postinjection day 4. Mn2+ transport throughout the orbitofrontal–striatal–thalamic loop, in the sagittal plane. Thin lines indicate rostrocaudal levels of the OFC injection site, caudate–putamen, globus pallidus, substantia nigra (SN), and thalamus (Thal). Scale bars, 10 mm.
Histology
Thionin staining revealed areas of complete cell loss after high-concentration MnCl2 injections. Two separate lesion sites were observed, corresponding in location to the second and third injection sites (Fig. 3A). Because the first and second injection sites overlapped significantly, tissue damage resulting from these two injections was most likely coextensive.
Figure 3.
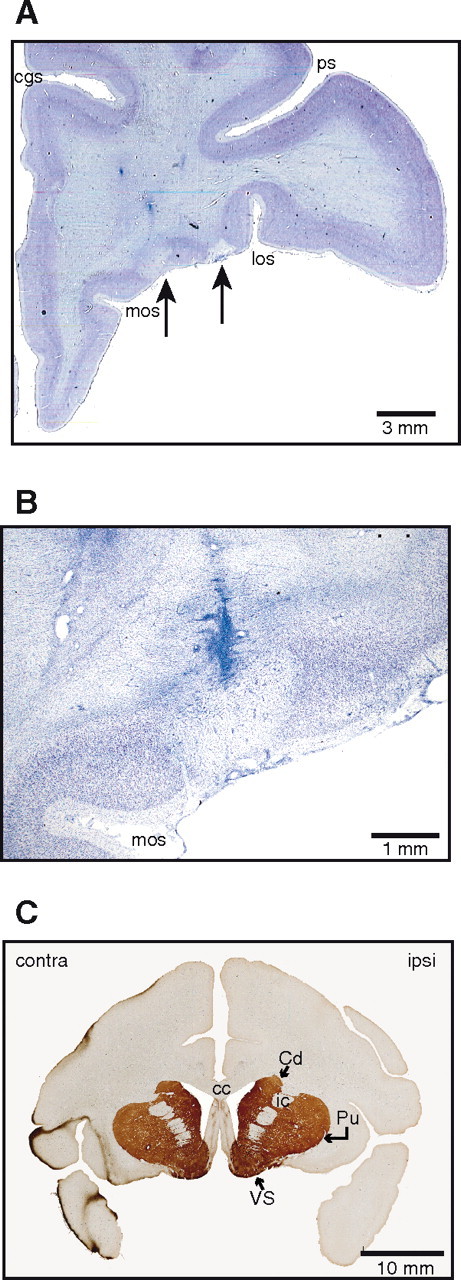
Histological findings after injections of high-concentration (800 mm) MnCl2 in OFC of monkey P. A, Thionin staining revealed two areas of complete cell loss in OFC areas corresponding to injection locations. cgs, Cingulate sulcus; los, lateral orbital sulcus; mos, medial orbital sulcus; ps, principal sulcus. B, Higher-power view of the more medial lesion shown in A. This lesion falls within the injection site shown in Figure 2A. The needle track itself is also visible. C, Immunocytochemistry revealed no differences in tyrosine hydroxylase levels in ipsilateral (ipsi) striatal targets of manganese transport versus the corresponding contralateral (contra) areas. Cd, Caudate; Pu, putamen; VS, ventral striatum; cc, corpus callosum; ic, internal capsule.
The size of each lesion was smaller than the spread of Mn2+ seen at the corresponding injection site on day 0. For example, the MEMRI taken on day 0 showed an injection site measuring ∼7.5 × 3 × 5 mm (Fig. 2A), whereas the corresponding area of cell loss measured 2.3 × 1.2 × 1.6 mm (Fig. 3B). This result suggests that cell death occurred only within the areas of peak Mn2+ concentration near the tip of the Hamilton syringe. Downstream targets of Mn2+ transport appeared histologically intact, with no observable loss of tyrosine hydroxylase activity in striatum (Fig. 3C). These histological results demonstrate that intracortical injections of high-concentration MnCl2 at sub-microliter volumes can cause local neuronal toxicity and cell death.
Isotonic MnCl2 (120 mm)
Manganese transport
Injections of 120 mm MnCl2 were made in two monkeys (monkeys S and T) (Table 1). Monkey S received three separate injections over 4 months, two in OFC and one in ACC. Monkey T received a single injection in OFC. To detect the low levels of Mn2+ transported, voxelwise statistical comparisons of postinjection with preinjection signal intensities were performed. Scans of adequate quality for this analysis were obtained on days 0, 2, and 4 after the OFC injections and on days 0, 4, and 7 after the ACC injection (Table 1). In all cases, Mn2+ transport was observed within cortical–striatal–thalamic loops.
Orbitofrontal injections
MnCl2 injections into OFC were localized to the lateral half of area 13 in both monkeys T and S (Fig. 4A,B). On postinjection day 2 (Fig. 5), enhancements attributable to Mn2+ were found ipsilaterally in more widespread regions of OFC, including most of areas 11 and 13. Subcortical transport of Mn2+ to striatum was detected in the head of the caudate nucleus, in most of the rostral putamen, ventrolaterally in the body of the caudate (in monkey S), and/or ventromedially in the more caudal putamen (in both). Mn2+ transport to globus pallidus externa was also detectable by day 2 (greater in monkey S than monkey T). In both animals, enhancements attributable to Mn2+ were seen in the mediodorsal nucleus of the thalamus by day 2 (again, greater in monkey S than monkey T). In monkey S only, Mn2+ signal also appeared in the ventral anterior nucleus of the thalamus.
Figure 4.
Localization of isotonic (120 mm) MnCl2 within 3 h of injection. A, Orbitofrontal injection site in monkey T. los, Lateral orbital sulcus; mos, medial orbital sulcus; ps, principal sulcus. B, Orbitofrontal injection site in monkey S. Orbitofrontal injections were localized to the lateral half of area 13 in both monkeys, with some extension into the overlying white matter. C, Anterior cingulate injection site in monkey S. The injection site was located ventral to the cingulate sulcus (cgs) in area 24c. All images were acquired at 4.7 T with 0.5 mm3 resolution and the following sequence parameters: TR, 100 ms; TE, 3.5 ms (monkey S) or 4.7 ms (monkey T); apparent flip angle, 45°. Mn2+ signal intensity maps are superimposed on images from separate volumes acquired with sequence parameters designed to highlight gray–white matter contrast and anatomical landmarks (TR, 100 ms; TE, 6.5 ms; apparent flip angle, 10°). Highlighted voxels are those with signal intensities at least 2 SDs from the preinjection mean (color bar from 0 to 3 SDs). Scale bars, 10 mm.
Figure 5.
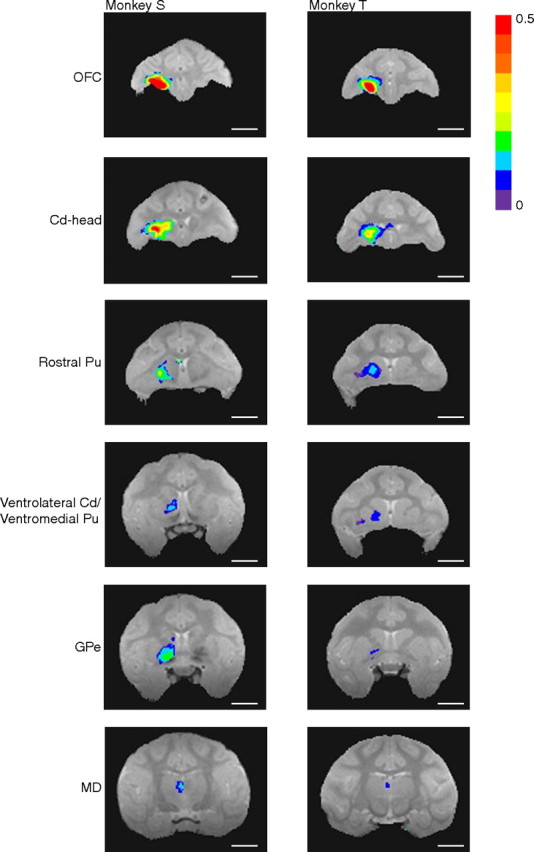
Manganese transport on postinjection day 2, after isotonic MnCl2 injections into OFC of monkeys S and T. Signal intensity maps show enhancements ipsilaterally in OFC, in the head of the caudate nucleus (Cd-head) and rostral putamen (Pu), in ventrolateral caudate, ventromedial putamen, globus pallidus externa (GPe), and mediodorsal nucleus of the thalamus (MD; transport seen in the ventral anterior nucleus of the thalamus in monkey S not pictured). Image acquisition parameters as in Figure 4. Highlighted voxels are those with a statistically significantly greater mean signal intensity in postinjection versus preinjection scans (t test, p ≤ 0.01, all corrected for multiple comparisons except monkey T's GPe and MD images). Colors denote the magnitude of the signal change. Scale bars, 10 mm.
On postinjection day 4 [Fig. 6 and selected larger views in on-line supplemental data (available at www.jneurosci.org as supplemental material)], Mn2+ signal persisted in OFC areas 11 and 13. In monkey S, corticocortical Mn2+ transport was also observed in ipsilateral dorsolateral prefrontal cortex (dlPFC) (area 46), ipsilateral anterior cingulate cortex (areas 24 and 32; data not shown), and bilateral insular cortex (IC). Subcortical signal persisted in the rostral putamen, as well as in regions of ventrolateral caudate and/or ventromedial putamen in both animals. Transport to globus pallidus externa and ventral pallidum was also detected in both animals on day 4, with greater signal intensity in monkey S. Mn2+ signal in thalamus was no longer detectable on day 4 in either monkey. Overall, these results are very similar to those obtained with high-concentration MnCl2, demonstrating that isotonic MnCl2 can be used successfully for in vivo tract tracing in monkeys.
Figure 6.

Manganese transport on postinjection day 4, after isotonic MnCl2 injections into OFC of monkeys S and T. Signal intensity maps show continued signal enhancements in OFC, transport to rostral putamen (Pu), ventrolateral caudate (Cd) and ventromedial putamen, and transport to globus pallidus externa (GPe) and ventral pallidum (VP). Signal intensities in subcortical targets are generally lower on day 4 than on day 2 (Fig. 5). In monkey S, transport to ipsilateral dlPFC and bilateral IC was detected for the first time on day 4. Image acquisition parameters are as in Figure 4. Statistical mapping conventions are as in Figure 5 (all corrected for multiple comparisons except monkey T's GPe/VP image). Scale bars, 10 mm.
We compared the intensity and extent of Mn2+ signal between postinjection days 2 and 4 and found four trends (Figs. 5–7). First, transport of Mn2+ from OFC to direct and transynaptic subcortical targets could be detected by postinjection day 2 (Fig. 5). Second, there was extensive regional overlap of the Mn2+ signal on days 2 and 4; we found no additional subcortical regions with enhanced signal intensity attributable to Mn2+ on day 4 (Fig. 7). Third, the signal intensity at the injection site and in subcortical targets decreased from day 2 to day 4 (compare Figs. 5, 6). In contrast, we observed a wider spread of Mn2+ signal in cortical target regions on day 4 than day 2 in monkey S.
Figure 7.

Manganese transport over time. Topographic distribution of manganese signal on day 2 (red) and day 4 (blue) after injection of isotonic MnCl2 into OFC of monkey S. Purple areas are those in which there was enhanced signal on both postinjection days. Note that subcortical targets of manganese transport overlapped extensively across time. Detection of manganese transport in cortical areas was greater on day 4. These maps do not show the range of signal intensity differences visible in Figures 5 and 6. Thin lines on the horizontal slice indicate rostrocaudal levels of OFC, rostral putamen (Ros Pu), ventrolateral caudate (Cd), ventromedial putamen, globus pallidus (GP), and thalamus (Thal). Scale bars, 10 mm. GPe, Globus pallidus externa.
Anterior cingulate injection
The MnCl2 injection into ACC was located just ventral to the cingulate sulcus in area 24c (Fig. 4C). On day 4 (Fig. 8, left) (selected larger views in supplemental figure, available at www.jneurosci.org as supplemental material), Mn2+ transport was detected through most of ipsilateral areas 24c, as well as being seen in other subregions on the medial wall (areas 24b and 32). Corticocortical projections to ipsilateral dorsolateral prefrontal and orbitofrontal cortex were also observed. Ipsilateral subcortical transport sites included dorsal caudate and putamen. Mn2+ enhancement was also visible in white matter tracts, most notably in the corpus callosum at the level of the rostral striatum and in the internal capsules bilaterally. The Mn2+ signal extended from the ACC across the corpus callosum to the contralateral putamen. Mn2+ signal was observed bilaterally in globus pallidus externa and ventral pallidum, with stronger signal ipsilaterally. Mn2+ transport was also detected in the ipsilateral globus pallidus interna. Finally, Mn2+ signal appeared in the thalamus, in the medial dorsal and ventral anterior nuclei.
Figure 8.
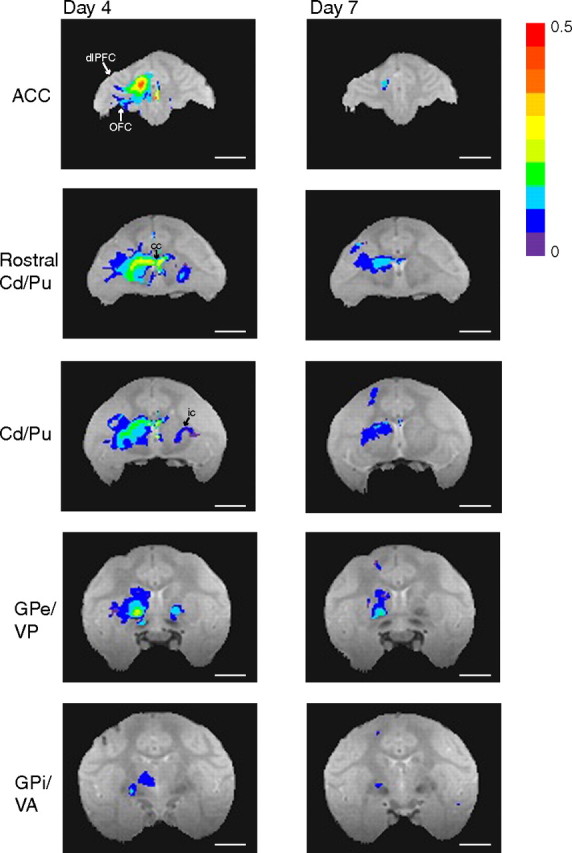
Manganese transport after isotonic MnCl2 injections into ACC of monkey S. On postinjection day 4, manganese was detected ipsilaterally throughout area 24c, in dlPFC (area 46V), OFC (area 13), and regions on the medial wall (areas 24b and 32). Subcortical signal was found ipsilaterally in dorsal caudate (Cd) and putamen (Pu), globus pallidus externa and interna (GPe/GPi), ventral pallidum (VP), and ventral anterior nucleus of the thalamus (VA; transport seen in the medial dorsal nucleus of the thalamus not pictured). There was also manganese signal within the corpus callosum (cc), and manganese accumulation contralateral to the injection site in the internal capsule (ic), rostral putamen, and globus pallidus externa. On postinjection day 7, manganese signal remained around the injection site in dorsal caudate and putamen and in globus pallidus externa and interna. Image acquisition parameters are as in Figure 4. Statistical mapping conventions are as in Figure 5 (t test, p ≤ 0.01, all corrected for multiple comparisons). Scale bars, 10 mm.
On postinjection day 7 (Fig. 8, right), Mn2+ signal had decreased in intensity and spatial extent at the injection site and in subcortical target regions. Signal did persist ipsilaterally in dorsal caudate and putamen and in globus pallidus externa and interna.
These results demonstrate that, as expected, MEMRI can be used to map cortical–subcortical circuits from more than one cortical region in a single animal. A comparison of the anterior cingulate data with those obtained after the orbitofrontal injections reveal differences in the topographic distributions of the cortical–striatal projections on postinjection day 4 (Figs. 6, 8, 9). In general, the Mn2+ signal is detected more rostrally, ventrally, and medially after injections in OFC than after ACC injections. Specifically, area 13 of OFC projects most strongly to the ipsilateral ventrolateral striatum and ventromedial putamen via the internal capsule. Area 24c of ACC projects most strongly to dorsal striatum and putamen. In addition, ACC sends projections through the corpus callosum to the contralateral striatum. Transynaptic projections to globus pallidus and thalamus from OFC and ACC are less differentiable.
Figure 9.

Topographic distribution of manganese signal from ACC (red) and OFC (blue) after injections of isotonic MnCl2 in monkey S. Purple areas are those to which both regions projected. Note that manganese transport after the ACC injection was more widespread than after the OFC injection, and both regions projected to a set of common targets. A, Manganese signal after the OFC injection was located more ventrally than that after the ACC injection, as seen in the sagittal plane. B, Manganese signal after the OFC injection was more medially restricted than after the ACC injection, as seen in the horizontal plane. C, D, In striatum, manganese signal after the OFC injection was located more ventrally than after the ACC injection, as seen in the coronal plane. These maps do not show the range of signal intensity differences visible in Figures 6 and 8. Thin lines on sagittal and horizontal slices indicate rostrocaudal levels of OFC, ACC, caudate (Cd), putamen (Pu), globus pallidus externa (GPe), ventral pallidum (VP), and thalamus (Thal). Scale bars, 10 mm.
Behavior
None of the three monkeys showed any obvious motor or social deficits. They moved well, took and ate treats, and showed normal social reactions to other monkeys and to the experimenters. Monkeys S and T also performed normally in a classical conditioning paradigm with significantly more anticipatory licking in CS+ than CS− trials (Fig. 2B,C) (monkey S: 85.4% CS+ trials vs 21.9% CS− trials, χ2 = 1450.8, df = 1, p < 0.001; monkey T: 37.2% CS+ trials vs 25.1% CS− trials, χ2 = 50.46, df = 1, p < 0.001). Therefore, as expected, small MnCl2 injections in OFC and ACC did not interfere with monkeys' ability to discriminate visual stimuli or to form correct stimulus-reinforcer associations.
Electrophysiological recordings
A total of 100 OFC single neurons were recorded (40 in monkey S; 60 in monkey T) while the two monkeys performed in the classical conditioning paradigm. Neurons were isolated in a series of recording tracks surrounding the MnCl2 injection site in each monkey. In both monkeys, tracks were located 1–2 mm from the injection site. In monkey T, attempts were also made to obtain recordings at the injection site itself: only one OFC neuron was isolated in this track. The most likely explanation for the inability to isolate neurons in this recording track is that the Hamilton syringe needle itself caused local tissue damage and gliosis. In monkey S, no neurons were found in one recording track located 1.4 mm from the injection site in the medial and caudal direction. It is possible that this track fell within an area of physical damage visible histologically (see Fig. 11).
Figure 11.

Histological findings after injections of isotonic (120 mm) MnCl2 in monkeys T and S. Panels on the left show thionin staining. Panels on the right show cytochrome oxidase activity. A, Monkey T. Thionin staining revealed no areas of cell loss or damage after the orbitofrontal MnCl2 injection. The needle track could be visualized, but the cortical tissue at the injection site could not be distinguished from the surrounding tissue. Cytochrome oxidase activity levels at the injection site also appeared unaffected. los, Lateral orbital sulcus; mos, medial orbital sulcus. B, Monkey S. Thionin staining revealed no areas of cell loss after the orbitofrontal MnCl2 injections. The needle itself did cause some tissue damage within OFC. Cytochrome oxidase activity levels appeared decreased in small regions near the injection sites. The tear from the needle itself can also be seen in this cytochrome oxidase section. C, Monkey S. Thionin staining revealed a small area of cell loss after the anterior cingulate MnCl2 injection. Cytochrome oxidase activity levels also appeared decreased in a small region near the injection site. cgs, Cingulate sulcus. Scale bars, 1 mm.
In all other recording tracks, healthy neurons were easily isolated and held. The neuronal density (monkey T, 4.9 ± 0.1 neurons/mm in 9 tracks; monkey S, 4.7 ± 0.4 neurons/mm in 6 tracks) was consistent with that obtained previously from OFC in two monkeys without MnCl2 injections (M1, 4.6 neurons/mm; M2, 6.3 neurons/mm) (J. M. Simmons and B. J. Richmond, unpublished data). OFC neurons surrounding the MnCl2 injection site were also responsive to events in the classical conditioning paradigm (Fig. 10). Seventy-three of 100 neurons showed a significant change in firing rate after one or more of the task events (pre-event vs post-event firing rates; two-tailed paired t tests, p < 0.05); 45 of 100 showed significant differences in firing rate between the CS+ and CS− trials (two-way ANOVA, main effect of condition, p < 0.05). These results demonstrate that OFC neurons located near isotonic MnCl2 injection sites retain one of their primary response characteristics: selectivity to outcome contingencies (Thorpe et al., 1983; Tremblay and Schultz, 2000; Simmons and Richmond, 2008)
Figure 10.

Neuronal activity in orbitofrontal cortex after injections of isotonic MnCl2. Single-unit activity was recorded while monkeys performed in the classical conditioning paradigm schematized in Figure 1. In this example from monkey T, a neuron within 1.4 mm of the injection site showed differential responses to both cues and outcomes in the CS+ (top) versus CS− (bottoms) trials. Rasters show firing rate (in hertz = spikes per second) as a function of time (in milliseconds). Dots represent individual spikes, and each row corresponds to a different trial. Spike density function curves (Gaussian kernel, SD of 25 ms) are superimposed on each raster. Data are aligned at the time of the cue appearance (0 ms; leftmost vertical line); the trial outcome occurred at 2500 ms (rightmost vertical line).
Histology
Thionin staining revealed no evidence of structural cell loss at any of the orbitofrontal injection sites in monkey S or T (Fig. 11A,B). At the ACC injection site in monkey S, thionin staining showed a small area of cell loss (Fig. 11C). Cellular metabolism at the OFC injection site in monkey T appeared unimpaired on cytochrome oxidase-labeled sections (Fig. 11A). In monkey S, cytochrome oxidase levels appeared decreased in small regions near the injection sites (Fig. 11B,C). In all cases, injections of isotonic MnCl2 caused much less damage at the injection sites than that seen with high-concentration injections. Because downstream targets of Mn2+ transport remained histologically intact after injections of high-concentration MnCl2, we have assumed that the transport of lower concentrations of MnCl2 would be equally nontoxic, if not less toxic.
Discussion
This study confirms that MEMRI can be used to map multisynaptic neuronal circuits in vivo in nonhuman primates (Saleem et al., 2002; Murayama et al., 2006). Intracortical injections of high-concentration MnCl2 result in excellent transport with high signal intensities throughout the entire cortical–subcortical–thalamic loop. Therefore, as a first-pass technique to look for circuit connections in vivo, tract tracing with high-concentration MnCl2 could be useful.
We investigated the histological effects of high-concentration MnCl2 injections and found local cell death and discrete lesions at the injection sites. These findings are consistent with the known neurotoxicity of MnCl2 (Eriksson et al., 1987, 1992; Olanow et al., 1996) and highlight the limitations of experiments using high-concentration MEMRI. Specifically, the lesions caused by high-concentration MnCl2 are incompatible with the use of MEMRI for longitudinal studies and within-subject experimental designs.
We have developed an MEMRI protocol using intracortical injections of isotonic MnCl2. This protocol avoids manganese-associated neurotoxicity, retains sensitivity to the T1-weighted signal changes, and allows unbiased mapping of manganese transport. We found that isotonic MnCl2 did not appear to cause cell death at the injection sites. Decreases in cellular metabolism at the injection sites, as assessed by cytochrome oxidase staining, were either small or not detectable. Single-unit recordings demonstrated that OFC neurons around the injection sites were appropriately responsive to differences in outcome contingencies.
Using isotonic MnCl2 minimizes neurotoxicity but also reduces the detectability of manganese transport. We solved this problem by building on a standard technique from the functional imaging field: we performed a set of voxelwise comparisons between postinjection and preinjection scans. We found that the use of preinjection scans and statistical comparisons significantly improved our ability to detect manganese signal after injections of isotonic MnCl2. We acquired magnetic resonance data in a 4.7 T magnet and included at least 10 preinjection scans and two postinjection scans from each time point in our analyses. In lower magnetic fields, such as the 3 T magnets more commonly available, more preinjection images might be needed to obtain adequate signal-to-noise. Acquiring the needed number of preinjection scans is well worth the time and effort expended. Having these scans made it possible here to visualize manganese transport at half-millimeter resolution with individual scan times of <2 h. The resulting transport maps of the orbitofrontal–subcortical circuit corresponded nicely to those obtained with high-concentration MnCl2.
The whole-brain statistical thresholding method used in this study not only allowed us to visualize cortical–subcortical circuits in individual animals with isotonic MnCl2 injections but also provided a measure of the relative density of projections within each region. Therefore, within a structure, we can differentiate between focal and diffuse projection fields (Haber et al., 2006). For example, although the projection fields from orbitofrontal cortex to striatum overlapped with those from anterior cingulate cortex in this study, the projection from orbitofrontal cortex was most intense ventrally, whereas the projection from anterior cingulate cortex was most intense dorsally (Kunishio and Haber, 1994; Ferry et al., 2000). The creation and comparison of such projection density maps would not be possible using a region-of-interest approach without precise a priori information.
The time course with which Mn2+ signal could be detected in subcortical regions after cortical injections of isotonic MnCl2 was generally consistent with that seen with high-concentration MnCl2 injections (Saleem et al., 2002). That is, we could detect Mn2+ transport to direct striatal target regions and to transynaptic regions such as globus pallidus between postinjection days 2 and 7. In our hands, however, the peak subcortical signal intensities were observed on day 2 rather than day 4, and signal intensities decreased with time in these regions. The seemingly surprising result that Mn2+ transport could be detected earlier with lower-concentration injections may result from toxicity-related cell death and transport blockade caused by high-concentration MnCl2 (Canals et al., 2008). It could also be attributable to the improved sensitivity of our imaging analyses. The decreases in signal intensity with time may result from limitations to signal detection at lower concentrations of MnCl2.
Obtaining multiple scans and comparing T1-weighted signal intensities between postinjection and preinjection scans was key to detecting low concentrations of Mn2+ at remote sites in the present work with monkeys. Recently, it has been demonstrated that very low concentrations of Mn2+ could be detected along the olfactory pathway of individual rats using a fast, quantitative T1 mapping technique that does not require repeated scans or statistical comparisons (Chuang and Koretsky, 2006). This work had the advantages of being performed at a higher field and on the smaller rodent brain. Currently, the time needed to acquire a full brain volume may be too long to allow such an approach with monkeys, but this alternative bodes well for the future.
As with any new methodology, additional technical improvements can and will be made. Advances in image acquisition techniques, such as the use of parallel MRI with multi-coil arrays, already offer the likelihood that higher-resolution images can be obtained more quickly (de Zwart et al., 2004). Faster scan times would allow the acquisition of more data per scanning session. With the analytical methods used in the present study, signal detection could be improved by using parallel MRI to acquire more preinjection and postinjection scans for comparison. Alternatively, parallel MRI could be used to obtain fast quantitative T1 maps of the entire monkey brain in a reasonable amount of time.
Faster scan times should make it feasible to obtain temporally more precise measurements of postinjection manganese transport and to answer critical questions regarding direct versus transynaptic transport and the precise connectivity of different circuits. In the present study, for example, we have seen early transport to thalamic nuclei that may reflect direct cortico-thalamic rather than cortico-striato-thalamic projections. Conversely, manganese signal in cortical regions distal to the injection site appeared later in time. It may take longer for manganese to reach detectable levels in cortex because cortical afferents are more diffusely distributed or because the path is transynaptic, perhaps even via subcortical structures.
The ability to study neuronal circuits in vivo provides a huge advantage in nonhuman primate research, in which each subject is particularly valuable. Neuroanatomical studies with conventional tract tracers can require 10–20 monkeys to map several different circuits or to follow a single transynaptic pathway (Selemon and Goldman-Rakic, 1985; Eblen and Graybiel, 1995; Haber et al., 1995, 2006; Ferry et al., 2000). Using viral tract tracers that are transported transneuronally can reduce the number of monkeys needed to visualize a multisynaptic circuit, but this technique still requires that the monkeys be killed (Strick and Card, 1992; Hoover and Strick, 1993; Kelly and Strick, 2000). With MEMRI, we can outline an entire cortical–subcortical circuit at a single point in time, in an individual living monkey.
Our results show that MEMRI can be used to map and compare the distributions of multiple neuronal circuits sequentially in a single animal. Although the spatial resolution provided by MEMRI is regional rather than cellular, we have shown that this technique can distinguish between striatal projections from orbitofrontal cortex and anterior cingulate cortex. Because manganese is visible in axonal fibers as well as at synaptic terminals, the precise anatomical interpretation of MEMRI signal in a particular area may require independent confirmation with a technique that can differentiate synaptic terminals from fibers of passage. However, the projection patterns and putative synaptic sites we have seen after MnCl2 injections in orbitofrontal and anterior cingulate cortex are consistent with those obtained with conventional tract tracers (Kunishio and Haber, 1994; Ferry et al., 2000).
MEMRI opens up the possibility of using neuroanatomical maps obtained from an individual animal under study to guide or interpret physiological experiments. For example, combining MEMRI with functional MRI should make it possible to superimpose maps of anatomical connectivity on maps of correlated activity patterns from the same animal.
MEMRI can also be combined with single-unit electrophysiological recordings. In this experiment, we injected isotonic MnCl2 into orbitofrontal cortex and later recorded from neurons around the injection site. Similarly, MEMRI could be used to guide electrode placements in projection target zones, such as the basal ganglia nuclei, receiving projections from OFC. Moreover, our quantitative analysis allows us to identify and target the subregions receiving the densest projection from any particular injection site in any given animal. The signal correlations obtained from simultaneous recordings in two or more densely connected regions will provide valuable constraints for theoretical and computational models that seek to explain how neuronal activity is transformed as it propagates forward through a circuit.
Footnotes
This work was supported by the Intramural Research Programs of National Institute of Mental Health and National Institute of Neurological Disorders and Stroke, and a National Alliance for Research on Schizophrenia and Depression Young Investigator Award (J.M.S.). For technical support, we thank Gang Chen, Bob Cox, David Ide, Megan Malloy, Hellmut Merkle, David Yu, and Charles Zhu.
References
- Abramoff et al., 2004.Abramoff MD, Magelhaes PJ, Ram SJ. Image processing with ImageJ. Biophoton Int. 2004;11:36–42. [Google Scholar]
- Bilgen, 2006.Bilgen M. Imaging corticospinal tract connectivity in injured rat spinal cord using manganese-enhanced MRI. BMC Med Imaging. 2006;6:15. doi: 10.1186/1471-2342-6-15. [DOI] [PMC free article] [PubMed] [Google Scholar]
- Brouillet et al., 1993.Brouillet EP, Shinobu L, McGarvey U, Hochberg F, Beal MF. Manganese injection into the rat striatum produces excitotoxic lesions by impairing energy metabolism. Exp Neurol. 1993;120:89–94. doi: 10.1006/exnr.1993.1042. [DOI] [PubMed] [Google Scholar]
- Canals et al., 2008.Canals S, Beyerlein M, Keller AL, Murayama Y, Logothetis NK. Magnetic resonance imaging of cortical connectivity in vivo. Neuroimage. 2008;40:458–472. doi: 10.1016/j.neuroimage.2007.12.007. [DOI] [PubMed] [Google Scholar]
- Chuang and Koretsky, 2006.Chuang KH, Koretsky A. Improved neuronal taract tracing using manganese enhanced magnetic resonance imaging with fast T1 mapping. Magn Reson Med. 2006;55:604–611. doi: 10.1002/mrm.20797. [DOI] [PubMed] [Google Scholar]
- Cox, 1996.Cox RW. AFNI: software for analysis and visualization of functional magnetic resonance neuroimages. Comput Biomed Res. 1996;29:162–173. doi: 10.1006/cbmr.1996.0014. [DOI] [PubMed] [Google Scholar]
- Cox and Hyde, 1997.Cox RW, Hyde JS. Software tools for analysis and visualization of fMRI data. NMR Biomed. 1997;10:171–178. doi: 10.1002/(sici)1099-1492(199706/08)10:4/5<171::aid-nbm453>3.0.co;2-l. [DOI] [PubMed] [Google Scholar]
- de Zwart et al., 2004.de Zwart JA, Ledden PJ, van Gelderen P, Bodurka J, Chu R, Duyn JH. Signal-to-noise ratio and parallel imaging performance of a 16-channel receive-only brain coil array at 3.0 Tesla. Magn Reson Med. 2004;51:22–26. doi: 10.1002/mrm.10678. [DOI] [PubMed] [Google Scholar]
- Eblen and Graybiel, 1995.Eblen F, Graybiel AM. Highly restricted origin of prefrontal cortical inputs to striosomes in the macaque monkey. J Neurosci. 1995;15:5999–6013. doi: 10.1523/JNEUROSCI.15-09-05999.1995. [DOI] [PMC free article] [PubMed] [Google Scholar]
- Eriksson et al., 1987.Eriksson H, Mägiste K, Plantin LO, Fonnum F, Hedström KG, Theodorsson-Norheim E, Kristensson K, Stålberg E, Heilbronn E. Effects of manganese oxide on monkeys as revealed by a combined neurochemical, histological and neurophysiological evaluation. Arch Toxicol. 1987;61:46–52. doi: 10.1007/BF00324547. [DOI] [PubMed] [Google Scholar]
- Eriksson et al., 1992.Eriksson H, Gillberg PG, Aquilonius SM, Hedström KG, Heilbronn E. Receptor alterations in manganese intoxicated monkeys. Arch Toxicol. 1992;66:359–364. doi: 10.1007/BF01973632. [DOI] [PubMed] [Google Scholar]
- Ferry et al., 2000.Ferry AT, Ongür D, An X, Price JL. Prefrontal cortical projections to the striatum in macaque monkeys: evidence for an organization related to prefrontal networks. J Comp Neurol. 2000;425:447–470. doi: 10.1002/1096-9861(20000925)425:3<447::aid-cne9>3.0.co;2-v. [DOI] [PubMed] [Google Scholar]
- Forman et al., 1995.Forman SD, Cohen JD, Fitzgerald M, Eddy WF, Mintun MA, Noll DC. Improved assessment of significant activation in functional magnetic resonance imaging (fMRI): use of a cluster-size threshold. Magn Reson Med. 1995;33:636–647. doi: 10.1002/mrm.1910330508. [DOI] [PubMed] [Google Scholar]
- Haber et al., 1995.Haber SN, Kunishio K, Mizobuchi M, Lynd-Balta E. The orbital and medial prefrontal circuit through the primate basal ganglia. J Neurosci. 1995;15:4851–4867. doi: 10.1523/JNEUROSCI.15-07-04851.1995. [DOI] [PMC free article] [PubMed] [Google Scholar]
- Haber et al., 2006.Haber SN, Kim KS, Mailly P, Calzavara R. Reward-related cortical inputs define a large striatal region in primates that interface with associative cortical connections, providing a substrate for incentive-based learning. J Neurosci. 2006;26:8368–8376. doi: 10.1523/JNEUROSCI.0271-06.2006. [DOI] [PMC free article] [PubMed] [Google Scholar]
- Hays et al., 1982.Hays AV, Richmond BJ, Optican LMA. Unix-based multiple process system for real-time data acquisition and control. WESCON. 1982;2:1–10. [Google Scholar]
- Hoover and Strick, 1993.Hoover JE, Strick PL. Multiple output channels in the basal ganglia. Science. 1993;259:819–821. doi: 10.1126/science.7679223. [DOI] [PubMed] [Google Scholar]
- Kelly and Strick, 2000.Kelly RM, Strick PL. Rabies as a transneuronal tracer of circuits in the central nervous system. J Neurosci Methods. 2000;103:63–71. doi: 10.1016/s0165-0270(00)00296-x. [DOI] [PubMed] [Google Scholar]
- Kunishio and Haber, 1994.Kunishio K, Haber SN. Primate cingulostriatal projection: limbic striatal versus sensorimotor striatal input. J Comp Neurol. 1994;350:337–356. doi: 10.1002/cne.903500302. [DOI] [PubMed] [Google Scholar]
- Leergaard et al., 2003.Leergaard TB, Bjaalie JG, Devor A, Wald LL, Dale AM. In vivo tracing of major rat brain pathways using manganese-enhanced magnetic resonance imaging and three-dimensional digital atlasing. Neuroimage. 2003;20:1591–1600. doi: 10.1016/j.neuroimage.2003.07.009. [DOI] [PubMed] [Google Scholar]
- Murayama et al., 2006.Murayama Y, Weber B, Saleem KS, Augath M, Logothetis NK. Tracing neural circuits in vivo with Mn-enhanced MRI. Magn Reson Imaging. 2006;24:349–358. doi: 10.1016/j.mri.2005.12.031. [DOI] [PubMed] [Google Scholar]
- Olanow et al., 1996.Olanow CW, Good PF, Shinotoh H, Hewitt KA, Vingerhoets F, Snow BJ, Beal MF, Calne DB, Perl DP. Manganese intoxication in the rhesus monkey: a clinical, imaging, pathologic, and biochemical study. Neurology. 1996;46:492–498. doi: 10.1212/wnl.46.2.492. [DOI] [PubMed] [Google Scholar]
- Pal et al., 1999.Pal PK, Samii A, Calne DB. Manganese neurotoxicity: a review of clinical features, imaging and pathology. Neurotoxicology. 1999;20:227–238. [PubMed] [Google Scholar]
- Pautler, 2004.Pautler RG. In vivo, trans-synaptic tract-tracing utilizing manganese-enhanced magnetic resonance imaging (MEMRI) NMR Biomed. 2004;17:595–601. doi: 10.1002/nbm.942. [DOI] [PubMed] [Google Scholar]
- Pautler et al., 1998.Pautler RG, Silva AC, Koretsky AP. In vivo neuronal tract tracing using manganese-enhanced magnetic resonance imaging. Magn Reson Med. 1998;40:740–748. doi: 10.1002/mrm.1910400515. [DOI] [PubMed] [Google Scholar]
- Pautler et al., 2003.Pautler RG, Mongeau R, Jacobs RE. In vivo trans-synaptic tract tracing from the murine striatum and amygdala utilizing manganese enhanced MRI (MEMRI) Magn Reson Med. 2003;50:33–39. doi: 10.1002/mrm.10498. [DOI] [PubMed] [Google Scholar]
- Saleem et al., 2002.Saleem KS, Pauls JM, Augath M, Trinath T, Prause BA, Hashikawa T, Logothetis NK. Magnetic resonance imaging of neuronal connections in the macaque monkey. Neuron. 2002;34:685–700. doi: 10.1016/s0896-6273(02)00718-3. [DOI] [PubMed] [Google Scholar]
- Selemon and Goldman-Rakic, 1985.Selemon LD, Goldman-Rakic PS. Longitudinal topography and interdigitation of corticostriatal projections in the rhesus monkey. J Neurosci. 1985;5:776–794. doi: 10.1523/JNEUROSCI.05-03-00776.1985. [DOI] [PMC free article] [PubMed] [Google Scholar]
- Silva et al., 2004.Silva AC, Lee JH, Aoki I, Koretsky AP. Manganese-enhanced magnetic resonance imaging (MEMRI): methodological and practical considerations. NMR Biomed. 2004;17:532–543. doi: 10.1002/nbm.945. [DOI] [PubMed] [Google Scholar]
- Simmons and Richmond, 2008.Simmons JM, Richmond BJ. Dynamic changes in representations of preceding and upcoming reward in monkey orbitofrontal cortex. Cereb Cortex. 2008;18:93–103. doi: 10.1093/cercor/bhm034. [DOI] [PubMed] [Google Scholar]
- Sloot and Gramsbergen, 1994.Sloot WN, Gramsbergen JB. Axonal transport of manganese and its relevance to selective neurotoxicity in the rat basal ganglia. Brain Res. 1994;657:124–132. doi: 10.1016/0006-8993(94)90959-8. [DOI] [PubMed] [Google Scholar]
- Strick and Card, 1992.Strick PL, Card JP. Transneuronal mapping of neural circuits with alpha herpes viruses. In: Bolam JP, editor. Experimental neuroanatomy: a practical approach. Oxford: Oxford UP; 1992. pp. 81–101. [Google Scholar]
- Thorpe et al., 1983.Thorpe SJ, Rolls ET, Maddison S. The orbitofrontal cortex: neuronal activity in the behaving monkey. Exp Brain Res. 1983;49:93–115. doi: 10.1007/BF00235545. [DOI] [PubMed] [Google Scholar]
- Tremblay and Schultz, 2000.Tremblay L, Schultz W. Reward-related neuronal activity during go-nogo task performance in primate orbitofrontal cortex. J Neurophysiol. 2000;83:1864–1876. doi: 10.1152/jn.2000.83.4.1864. [DOI] [PubMed] [Google Scholar]
- Van der Linden et al., 2002.Van der Linden A, Verhoye M, Van Meir V, Tindemans I, Eens M, Absil P, Balthazart J. In vivo manganese-enhanced magnetic resonance imaging reveals connections and functional properties of the songbird vocal control system. Neuroscience. 2002;112:467–474. doi: 10.1016/s0306-4522(02)00070-2. [DOI] [PubMed] [Google Scholar]
- Van der Zijden et al., 2008.Van der Zijden JP, Bouts MJ, Wu O, Roeling TA, Bleys RL, van der Toorn A, Dijkhuizen RM. Manganese-enhanced MRI of brain plasticity in relation to functional recovery after experimental stroke. J Cereb Blood Flow Metab. 2008;28:832–840. doi: 10.1038/sj.jcbfm.9600576. [DOI] [PubMed] [Google Scholar]
- Van Meir et al., 2004.Van Meir V, Verhoye M, Absil P, Eens M, Balthazart J, Van der Linden A. Differential effects of testosterone on neuronal populations and their connections in a sensorimotor brain nucleus controlling song production in songbirds: a manganese enhanced-magnetic resonance imaging study. Neuroimage. 2004;21:914–923. doi: 10.1016/j.neuroimage.2003.10.007. [DOI] [PubMed] [Google Scholar]
- Watanabe et al., 2001.Watanabe T, Michaelis T, Frahm J. Mapping of retinal projections in the living rat using high-resolution 3D gradient-echo MRI with Mn2+-induced contrast. Magn Reson Med. 2001;46:424–429. doi: 10.1002/mrm.1209. [DOI] [PubMed] [Google Scholar]
- Watanabe et al., 2004.Watanabe T, Frahm J, Michaelis T. Functional mapping of neural pathways in rodent brain in vivo using manganese-enhanced three-dimensional magnetic resonance imaging. NMR Biomed. 2004;17:554–568. doi: 10.1002/nbm.937. [DOI] [PubMed] [Google Scholar]