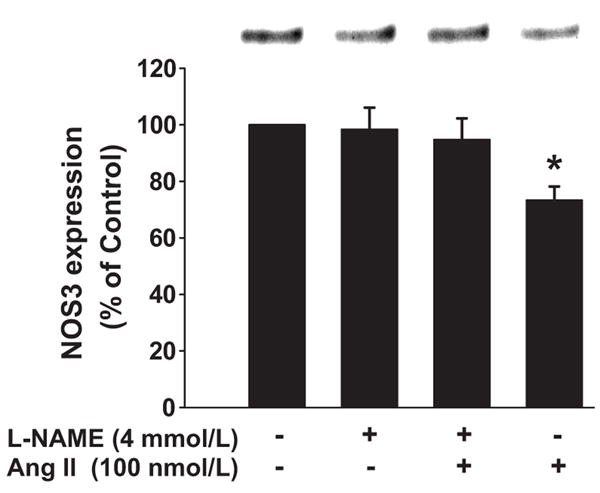
Figure 2. Effect of NOS inhibition on Ang II-induced decrease in NOS3 expression in mTHALs.

Top: Representative Western blot. Bottom: Cumulative data from 5 independent measurements; *=p<0.007 vs L-NAME+ Ang II.

Top: Representative Western blot. Bottom: Cumulative data from 5 independent measurements; *=p<0.007 vs L-NAME+ Ang II.