

Abstract
Among the early events associated with atherosclerotic lesion development are increased macromolecular permeability of the endothelium and expression of genes that affect inflammation and oxidative state. The purpose of this study was to measure the expression of several atherosclerosis-related genes in endothelial cells scraped from arch and thoracic regions of the porcine aorta exhibiting elevated permeability. Aortae were collected from six swine that were exposed to circulating Evans blue dye (EBD), a marker of transendothelial albumin permeability. Endothelial cells were scraped from (1) white regions in the thoracic aorta, (2) light blue streaks and blue regions near ostia in the thoracic aorta, and (3) dark blue regions in the aortic arch. Expression levels of several genes were analyzed by real-time quantitative PCR. There were modest differences between the expression levels of several genes in cells from the light blue regions relative to those from white regions. In the dark blue regions, eNOS was drastically downregulated and MCP-1 was upregulated relative to their expression in both the white and light blue regions. The distinct levels of permeability and differences in gene expression profiles exhibited by cells from these different regions of the aorta may reflect corresponding differences in their hemodynamic environments.
Keywords: atherosclerosis, aorta, porcine, permeability, gene expression, endothelium, nitric oxide synthase
Introduction
A considerable body of evidence exists to support the notion that early development of atherosclerotic lesions is linked to hemodynamics via processes that are mediated by the shear-sensitive endothelium. Among the endothelial responses that are thought to be critical in lesion initiation are increased transendothelial permeability to macromolecules, such as LDL, expression of pro-inflammatory molecules, and decreased production and release of nitric oxide 1–4. It is generally agreed that lesions are predisposed to form in regions of the vasculature experiencing complex flow fields 5; however, the precise dependence of each of the aforementioned manifestations of endothelial dysfunction on hemodynamics in vivo is not well defined.
For several decades, Evans blue dye (EBD) has been used to assess transendothelial permeability to albumin in various species 6–11. When introduced into the bloodstream, this molecule binds to serum albumin, with which it crosses the endothelial barrier. As a result of its high affinity to components of the subendothelial matrix and internal elastic lamina 12, EBD remains in the subendothelial space as albumin transport continues through the arterial wall. Following harvest, these arteries can be viewed en face to assess regional variations in albumin permeability 9,13. Certain EBD patterns have been consistently reported in both canine and porcine arteries. These include darkened arrow-like features along the lateral and distal edges of major ostia; blue streaks in the entrance regions of major branches, such as the iliac arteries; nonuniform staining throughout the thoracic aorta; and very dark staining in the aortic arch 6,7,13,14. In the regions exhibiting ostial patterns and streaks, EBD optical density (OD) varies continuously over a range from faint to dark, a characteristic which we have exploited to correlate local albumin permeability against shear stress parameters in the porcine iliac artery 11. In contrast, EBD patterns in the arch region of the aorta are much darker and of more uniform intensity. The topography of EBD uptake in the porcine aorta is nearly identical to the trends of increased permeability to horseradish peroxidase (HRP) in the rabbit aorta, with the highest incidence occurring in the arch 15.
Caplan and Schwartz demonstrated an increased rate of turnover in endothelial cells overlying blue stained regions of the porcine aortic arch compared to white areas of either the arch or abdominal aorta 6. In addition, these cells were rounder and less polarized than those exhibiting normal permeability. It has been confirmed in numerous studies (as reviewed by Weinbaum and Chien 16) that mitotic endothelial cells are leaky to EBD-albumin and horseradish peroxidase (HRP) in rabbit and rat aortae, providing conclusive evidence for one mechanism of hyperpermeability. However, mitotic cells only accounted for 20% of HRP-permeable sites 17 and one third of EBD-albumin leaky sites in the rat thoracic aorta 18 and 8% of LDL-permeable sites in the rabbit thoracic and abdominal aorta 19. While the methods used may not have detected all turnover events, these data suggest that a second mechanism of hyperpermeability, such as leakage through attenuated intercellular junctions, is likely 20.
We hypothesize that endothelial cells (EC) exhibiting the considerably different levels of permeability seen in the thoracic aorta and aortic arch also differ in their gene expression profiles. In this study, EC were collected from dark blue regions of the aortic arch, blue streaks and periostial blue features of the thoracic aorta, and white areas of the thoracic aorta of swine. Real-time quantitative PCR was used to measure the relative expression levels of several genes of interest in each of the blue areas, relative to the white areas. While the transcript levels of some genes were similar in the two hyperpermeable regions, other genes showed very different expression levels. These results suggest that different mechanisms of elevated permeability may be operating in these regions, possibly evoked by their very different hemodynamic characteristics.
Methods
Animal Experiments and Sample Acquisition
All animal experiments were performed in accordance with a protocol approved by the Duke University Institutional Animal Care and Use Committee. Six juvenile female swine (60–70 kg) were pre-anesthetized, intubated via tracheotomy, and placed on a respirator through which isofluorane gas was administered. One carotid artery was cannulated for monitoring of intra-arterial blood pressure, and the contralateral jugular vein was cannulated for intravenous administration of fluids. For a simultaneous study involving the measurement of flow rates through the femoral arteries, these arteries were exposed, and perivascular flow probes (Transonic Systems, Ithaca, NY) were placed around them.
Evans blue dye solution was prepared by dissolving 25.4 mg EBD (Serva, Heidelberg, Germany) per kg swine in 60 ml of phosphate-buffered saline (PBS, Fisher). The solution was filtered through a 0.45 μm filter and mixed with 75.8 mg/(kg swine) bovine serum albumin (BSA, fraction V, heat shock treated, FisherBiotech). The molar ratio of filtered EBD to BSA in the injectate was approximately 20:1, and that of injected EBD to serum albumin was approximately 1:1. The amount of BSA in the injectate was sufficient to bind all EBD molecules, as determined by spectrophotometric analysis following protein precipitation using trichloroacetic acid, and negligible unbound EBD was present in the serum following injection 11. EBD was administered via the jugular cannula and allowed to circulate in the bloodstream for three hours, after which animals were sacrificed by intravenous Euthasol (Virbac AH, Inc, Fort Worth, TX). The arterial system was briefly flushed clear of blood using Dulbecco’s Modified Eagle’s Medium (Sigma-Aldrich, St. Louis, MO). The aorta was immediately removed and placed in ice-cold phosphate buffered saline containing Ca+2 and Mg+2 supplemented with RNase inhibitor (ProtectRNA™, Sigma-Aldrich).
Each aorta, extending from just distal to the coronary ostia to well into the thoracic region, was cut along its ventral aspect and pinned out on silicone blocks. A metal spatula was used to scrape endothelial cells from the opened tissue based on their level of blueness. Dark blue regions were selected in the aortic arch. These were mostly found along the lateral walls and inner curvature of the arch, although dark regions occasionally found along the outer curvature were also included. Light blue regions were selected in the thoracic aorta. These included streaks, as well as rings surrounding the intercostal ostia. In most cases, two or three intercostal ostia were scraped, representing approximately 10–20% of the light blue area selected for harvesting. Regions in the thoracic aorta distant from ostia and demonstrating no visible blueness (“white” regions) were also scraped. As discussed below (and is evident in Fig. 1), the total area of the dark blue region varied among animals. This area ranged from about 1 to 10 cm2. The area covered by regions defined as light blue was more consistent and was 2–5 cm2. For each artery, the area selected for the white sample was approximately equal to that of the light blue sample.
Figure 1.
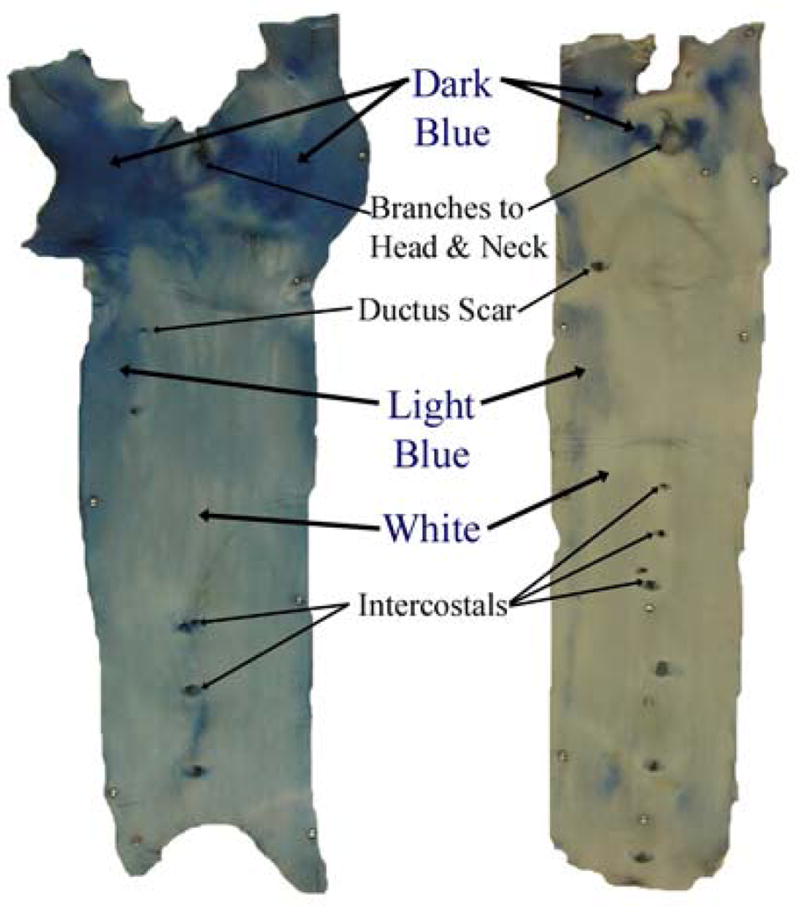
Photographs of aortae from two of the six swine. Anatomical branches are indicated. Example dark blue regions are identified in the aortic arches, and example light blue and white regions are identified in the thoracic aortae.
The cells were transferred from the spatula to centrifuge tubes containing a cell lysis solution (Ambion Inc., Austin, TX). Total RNA was then isolated from the cell extracts using the PARIS™ Kit (Ambion). RNA concentration was spectrophotometrically measured. For each artery, a consistent mass of total RNA from each region (between 200 and 500 ng, depending on the lowest yield among the three samples) was reverse transcribed using the iScript cDNA Synthesis Kit (Bio-Rad Laboratories Inc., Hercules, CA).
Quantitative Real Time PCR
RNA was collected from 6 aortae. A two-step real-time quantitative PCR (qPCR) reaction was conducted using the MyiQ Single-Color Real-Time PCR Detection System with iQ™ SYBR® Green (Bio-Rad) detection of double-stranded DNA. Using the cDNA templates, the expression of eight select genes relative to a housekeeping gene, GAPDH, was assessed for each sample. For each gene, primers were designed based on published cDNA sequences; the primer sequences are presented in Table 1. All primers were synthesized by Integrated DNA Technologies (Coralville, IA). Tests using dilutions of cDNA derived from cultured cells confirmed that the PCR efficiency of each gene product was near 100%; therefore gene expression levels defined relative to GAPDH are insensitive to the amount of total cDNA used in the PCR reaction. The 2−Δ ΔCT method 21, which normalizes each sample to the internal control gene (GAPDH), was used to quantify the fold difference in expression levels between samples for each of the eight target genes. Three replicate amplifications were performed for each sample. For each PCR amplification, a melt curve was performed on the double stranded DNA product to confirm its quality. If a sample yielded poor product for any particular gene, that gene was discarded from the analysis for that aorta. This was the case for eNOS in one aorta and MCP-1 in another.
Table 1.
Sequences of forward and reverse primers used for PCR amplification of each of the genes of interest and the housekeeping gene GAPDH.
| Gene | Primer Sequence (5′ → 3′) |
|---|---|
| GAPDH | GGGCATGAACCATGAGAAGT GTCTTCTGGGTGGCAGTGAT |
| VEGF | ACGACGAAGGTCTGGAGTGT AAGCTCATCTCTCCTATGTGCTG |
| β-catenin | GCAGGGATTTTCTCAGTCCTT GGATGAGCAGCGTCAAACT |
| eNOS | GGCTGGTACATGAGCACAGA AGCACAGCCAGGTTGATTTC |
| c-jun | GATGGAAACGACCTTCTACGAC TTCAGGGTCATGCTCTGCTT |
| c-fos | CTTCTCCAGCATGGGCTCT GCTGGTCGAGATAGCAGTCA |
| ICAM-1 | TCAATGGAACCGAGAAGGAG GGAGGTGGGAAGCTGTAGAA |
| VCAM-1 | CAAGGAAAACGAAGAGTTTGGA TGTTGTCTTTACTGAGGGCTGAC |
| MCP-1 | TCTCCAGTCACCTGCTGCTA TCCAGGTGGCTTATCGAGTC |
For each aorta, the fold-difference in expression level of each gene was determined between (1) cells scraped from the dark blue regions of the arch and those from the white region of the thoracic aorta, and (2) cells scraped from the blue and white areas of the thoracic aorta. Differences from zero, indicating up- or down-regulation of the gene relative to its expression in the white areas, were detected using two-tailed t-tests. The criterion for significance was p<0.10.
Sample Purity
To ensure that only endothelial cells were being scraped from the artery wall using the technique described above, additional experiments were performed to assess cell population purity. Cells scraped from the thoracic aorta of a swine were lysed, after which total RNA was isolated and cDNA was synthesized, as described above. qPCR was used to quantify the 18s-normalized amount of a smooth muscle cell specific gene, calponin, compared to expression levels in a SMC culture (as assessed on the basis of morphological characteristics). The qPCR protocol was the same as that described above. The primer sequences were (5′→3′): CGCGGTTCTATTTTGTTGGT and CTGATCGTCTTCGAACCTCC for 18s, and AGGCTCCGTGAAGAAGATCA and CCACGTTCACCTTGTTTCCT for calponin. The aortic scrapings expressed 0.11% of the calponin expressed by pure SMC. To further confirm the purity of scraped endothelium, cells scraped from the thoracic aorta of a second swine were analyzed by flow cytometry. Scraped cells were suspended in 0.1% BSA in PBS. Suspensions were exposed to either mouse anti-porcine CD31 (PECAM-1, Antigenix America Inc., Huntington Sta., NY) or mouse IgG1 negative control (Serotec Inc., Raleigh, NC), both pre-labeled using the Zenon® Alexa Fluor® 488 Mouse IgG1 Labeling Kit (Molecular Probes Inc., Eugene, OR). Following the incubation, cells were diluted, pelletted, and resuspended in 2% paraformaldehyde. The labeled cells were analyzed by flow cytometry (BD FACSCalibur, BD Biosciences). When the fluorescence threshold was set such that 1% of the negative control cells exceeded this level, 99.0% of the cells stained for anti-PECAM-1 were super-threshold. Together, these results indicate that the vast majority of cells scraped using this method display characteristics of endothelial cells and not of smooth muscle cells.
Results
The staining of the six aortae exhibited certain common features, although exact patterns and global staining levels varied. Patterns resembled those reported earlier throughout the arch and thoracic segments of the aorta in Yorkshire pigs 6,7,13. Figure 1 shows photographs of the most heavily and lightly stained aortae. In both aortae, staining is much heavier in the arch (above the ductus scar) than in the thoracic aorta. Of note is the absence of dark blue staining in the thoracic aorta and the absence of light blue staining in the arch. The distribution of dark blue staining in the two arteries differs somewhat. In the left artery, staining covers nearly the entire circumference of the arch at the level of the head and neck branches, while in the aorta on the right, staining is confined to smaller spots primarily lateral to the major branches. The patterns in the thoracic aorta are more similar. A large streak is observed along the lateral wall of the proximal thoracic aorta just distal to the ductus scar. Smaller streaks are scattered throughout the thoracic aorta, and characteristic arrow-like patterns are observed around some of the intercostal ostia. Scrapings were taken from each of these regions.
Results from the gene expression analysis are tabulated in Table 2, and expression levels are shown graphically in Fig. 2. Relative to the white regions that showed no visible staining, the genes for VEGF, β-catenin, c-jun, c-fos, and VCAM-1 were significantly downregulated in the light blue region (p<0.10). In the dark blue region, the variability among the samples was larger than it was among the samples from the white or light blue regions. However, despite this large variation, eNOS was found to be significantly downregulated (2.6-fold, p=0.025) and MCP-1 was upregulated (3.1-fold, p=0.025) relative to the white region, while any effect on other genes did not reach significance. These same two genes were also the only ones for which there was a statistical difference in expression levels between the light blue and dark blue regions (for eNOS, p=0.011; for MCP-1, p=0.005).
Table 2.
Average gene expression ratios for light blue regions relative to white regions and for dark blue regions relative to white regions, as determined by real-time qPCR. n = 6 for all tests, except for eNOS light blue and dark blue and MCP-1 light blue, for which n =5.
| Gene | Sample | Average ln(ratio), (untransformed ratio) | St. Dev. | p-value (vs. white) | p-value (light vs. dark blue) |
|---|---|---|---|---|---|
| VEGF | Light Blue | −0.49 (0.61) | 0.36 | 0.022 | 0.585 |
| Dark Blue | −0.72 (0.49) | 0.94 | 0.121 | ||
| β-catenin | Light Blue | −0.24 (0.78) | 0.29 | 0.097 | 0.643 |
| Dark Blue | 0.01 (1.01) | 1.26 | 0.987 | ||
| eNOS | Light Blue | −0.03 (0.97) | 0.14 | 0.644 | 0.011 |
| Dark Blue | −0.98 (0.38) | 0.62 | 0.025 | ||
| c-jun | Light Blue | −0.24 (0.78) | 0.23 | 0.046 | 0.434 |
| Dark Blue | 0.15 (1.16) | 1.16 | 0.764 | ||
| c-fos | Light Blue | −0.27 (0.76) | 0.30 | 0.075 | 0.716 |
| Dark Blue | −0.15 (0.86) | 0.74 | 0.635 | ||
| ICAM-1 | Light Blue | −0.18 (0.84) | 0.23 | 0.123 | 0.999 |
| Dark Blue | −0.18 (0.84) | 0.44 | 0.368 | ||
| VCAM-1 | Light Blue | −0.33 (0.72) | 0.22 | 0.014 | 0.784 |
| Dark Blue | −0.45 (0.64) | 0.99 | 0.317 | ||
| MCP-1 | Light Blue | 0.04 (1.04) | 0.14 | 0.508 | 0.005 |
| Dark Blue | 1.12 (3.07) | 0.72 | 0.025 |
Figure 2.
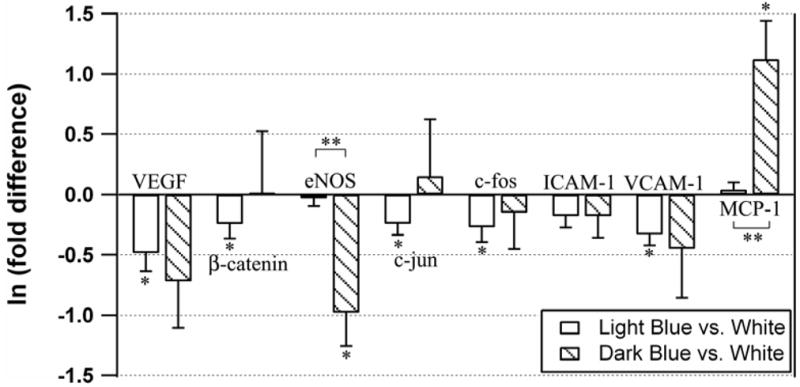
Expression ratios in cells scraped from light blue and dark blue regions relative to white regions for the eight genes of interest. Data have been logarithmically transformed. Means are presented among five or six samples, and error bars are S.E.M. * p < 0.10 vs. white. ** p < 0.05 for light blue vs. dark blue.
Discussion
These results suggest that gene expression profiles are different in porcine aortic endothelial cells having different levels of permeability, as assessed by uptake of EBD. In the aortic arch, hyperpermeable regions exhibit markedly greater EBD uptake than the most permeable regions of the thoracic aorta. Of the genes tested, five were downregulated in the light blue region relative to the white region. However, the differences were modest, with none greater than 2-fold. For these five genes, no difference could be demonstrated between their expression in the dark blue and white regions, nor between the dark blue and light blue regions.
However, the results for eNOS and MCP-1 were dramatically different. The expression of these genes in the light blue and white regions was virtually identical, with very low variability. By contrast, the expression levels of these two genes in the dark blue region of the arch showed the greatest fold difference of any gene relative to either the white or light blue regions of the thoracic aorta: relative to the white region, eNOS was downregulated 2.6-fold, and MCP-1 was upregulated 3.1-fold.
The differences between the expression of these genes (which code for proteins that play major roles in atherogenesis) in the aortic arch and anywhere in the thoracic aorta, suggest that a qualitatively different stimulus for expression is present in the arch. Many studies have correlated transendothelial permeability to hemodynamic variables in porcine and rabbit arteries 11,22, and fluid mechanics has been shown to affect the permeability of endothelial cells in vitro 23,24; thus the possible presence of unique flow environments in the aortic arch merits consideration. One flow phenomenon historically associated with aortic arch hemodynamics is turbulence 25. However, it is not clear whether true turbulence occurs in the healthy human aorta 5; flow studies using MRI both confirm 26 and deny 27 the existence of turbulence in patients.
Given the conflicting evidence for turbulence in the human aortic arch and a lack of data regarding the flow field in the juvenile porcine aorta, we do not know whether turbulence existed in the arches scraped for this study. The phenotype of the dark blue region is consistent with the response of endothelial cells to turbulent flow in vitro. In experiments in which human umbilical vein endothelial cells (HUVEC) were exposed to flow for 6 hours, Noris et al. [28] found higher levels of eNOS transcript were induced by laminar flow at a shear stress of 8 dyn/cm2 relative to static cells, while turbulent flow with the same mean shear stress caused no change in eNOS mRNA levels. A similar result was reported by Topper et al. 28 in the same cell type after exposure to shear levels of 10 dyn/cm2 for 24 hours.
Other phenotypic differences have been found between cells exposed to laminar and turbulent flows. Bovine aortic endothelial cells exposed to turbulent flow showed increased cell turnover and decreased alignment, compared to those exposed to laminar flows, at shear levels of 1.5 dyn/cm2 and 15 dyn/cm2 29. Garcia-Cardena et. al 30 noted differences in cell cycle regulation in HUVEC exposed to turbulent and laminar shear fields as well as a set of 100 genes that were differentially regulated between the two flow environments, as determined by microarray analysis.
The shear-regulated expression of MCP-1 has been linked to nitric oxide (NO). In HUVEC, step increases in shear upregulate MCP-1 mRNA levels, whose subsequent decay depends on concomitant shear-induced increases in NO 31. The ability of NO to repress the shear-stimulated transient upregulation of MCP-1 mRNA has been shown to involve the decreased activation of PKC-ε and the ERK1/2 pathway 32. If some aspect of the environment in the arch is inhibiting expression of eNOS in the dark blue regions, it is possible that the resulting low levels of NO release could prevent downregulation of MCP-1 in that region; the situation would be exacerbated if, at the same time, the environment were stimulating MCP-1 expression.
This study bears some similarity to one conducted by Passerini et al.33, who used microarray techniques to compare the expression profiles of endothelial cells harvested from the inner curve and lateral wall of the aortic arch to those in the descending aorta in swine. Results were consistent with those reported here. In the arch region, MCP-1 was upregulated, eNOS was downregulated, and ICAM-1 and VCAM-1 were not differentially expressed, compared to the thoracic aorta. The authors referred to the flow in the aortic arch as “disturbed flow” and that in the descending aorta as “undisturbed laminar flow.” Whereas the criterion for selection of cells in the Passerini study was geometric location, the cells in the present work were selected on the basis of their underlying accumulation of EBD, reflecting their macromolecular permeability. As discussed above, this included mainly cells from the inner curvature and lateral walls, but also from dark spots along the outer curvature. Our results are not intended to characterize either the inner or outer curvatures of the arch, nor the response to their putative hemodynamic environments, but rather to differentiate among regions exhibiting differing degrees of macromolecular permeability.
There is evidence that NO plays a role in regulating local transendothelial permeability. Weinberg noted that the regions of lipid staining and elevated permeability near the ostia of the intercostal arteries of young rabbits are predominantly downstream, where shear stresses are presumably relatively high, while they are primarily upstream of the ostia in older rabbits. The mature pattern more closely parallels the distribution of adult human lesions. Furthermore, the mature pattern reverts to the immature pattern when NO synthesis is blocked with Nω-monomethyl-L-arginine (L-NMMA) 34. Thus, the high shear region of the mature artery appears to be inhibited from developing hyperpermeability by some process that depends on NO synthesis. The porcine aortic arch exhibits high levels of permeability despite the expectation of high shear stresses throughout much of this vessel. The reduced expression of eNOS, which should hinder NO synthesis, could be responsible to some extent for this elevated permeability.
Forster and Weinberg showed that NO-mediated vasorelaxation of excised rabbit aortic rings is abrogated in the presence of free EBD 35, and we have considered whether the dye may have confounded the results of the present study, particularly with respect to eNOS expression. We have noted no changes in arterial caliber upon EBD injection in our studies. Furthermore, EBD was conjugated with albumin prior to injection, and we have confirmed that all of the dye remains bound to albumin while in the circulation. Finally, we have found that exposure of static porcine aortic endothelial cells to EBD-albumin, over a wide range of concentrations and incubation times, does not affect the expression levels of eNOS mRNA (unpublished result). Caplan and Schwartz found no effect of EBD on the turnover of porcine aortic arch endothelial cells 6. Thus, we do not believe that the results reported here were affected significantly by the presence of EBD-albumin complex in the blood.
Our data are consistent with the hypothesis that the underlying mechanisms of permeability are different in the porcine aortic arch than in other hyperpermeable regions. Complementing the differences in phenotype found here, it has been observed that porcine arch cells exhibit high levels of turnover 6. The majority of the more permeable sites in non-arch segments of the aorta do not appear to be due to enhanced turnover, and the prevailing view is that the enhanced permeability of these sites is due to transiently weakened intercellular junctions 20. In contrast, it appears plausible that turnover of the endothelium may be the primary mechanism of hyperpermeability in the porcine aortic arch.
While we have not demonstrated the presence of turbulence in the porcine aortic arch, the behavior of endothelial cells harvested from this region is consistent with published responses of these cells to turbulent flow in vitro. It is likely that the cells in the arch experience a flow field that is fluid dynamically distinct from “disturbed” flow fields elsewhere in the aorta – indeed elsewhere in the arterial system - as evidenced by the significant differences in permeability and gene expression seen here. Atherosclerosis associated with the aortic arch is observed predominantly in its major branches, and lesions are common near the ostia of other aortic branches 36. Therefore, it would seem that the endothelial responses in the blue regions of the thoracic aorta and elsewhere 11 may have more pathological relevance than those associated with the aortic arch, despite its greater permeability. While it promotes increased permeability, the flow field in this region could fail to promote other events key to lesion development, such as inflammation, while exhibiting still other anti-atherogenic responses, such as upregulation of antioxidant genes 33.
Finally, we note that it is not necessary that both endothelial permeability and gene expression be mediated by local hemodynamics. For example, the flow field could promote increased permeability, resulting in the accumulation and oxidation of subendothelial LDL, which in turn might invoke signaling pathways affecting transcription that do not require mechanotransduction. Further exploration of active signaling pathways and other aspects of endothelial behavior in various regions of the aorta could lend valuable insights into the initiation and progression of arterial disease.
Acknowledgments
The authors would like to thank Ellen Dixon-Tulloch and Pamela Gasdaska for technical assistance. This work was funded by NIH Grant HL-050442.
Footnotes
Publisher's Disclaimer: This is a PDF file of an unedited manuscript that has been accepted for publication. As a service to our customers we are providing this early version of the manuscript. The manuscript will undergo copyediting, typesetting, and review of the resulting proof before it is published in its final citable form. Please note that during the production process errors may be discovered which could affect the content, and all legal disclaimers that apply to the journal pertain.
References
- 1.Ruschitzka FT, Noll G, Luscher TF. The endothelium in coronary artery disease. Cardiology. 1997;88 (Suppl 3):3–19. doi: 10.1159/000177500. [DOI] [PubMed] [Google Scholar]
- 2.Dzau VJ. Pathobiology of atherosclerosis and plaque complications. Am Heart J. 1994 Dec;128(6 Pt 2):1300–1304. doi: 10.1016/0002-8703(94)90251-8. [DOI] [PubMed] [Google Scholar]
- 3.Ross R. Rous-Whipple Award Lecture. Atherosclerosis: a defense mechanism gone awry. Am J Pathol. 1993 Oct;143(4):987–1002. [PMC free article] [PubMed] [Google Scholar]
- 4.Stocker R, Keaney JF., Jr Role of oxidative modifications in atherosclerosis. Physiol Rev. 2004 Oct;84(4):1381–1478. doi: 10.1152/physrev.00047.2003. [DOI] [PubMed] [Google Scholar]
- 5.Glagov S, Zarins C, Giddens DP, Ku DN. Hemodynamics and atherosclerosis. Insights and perspectives gained from studies of human arteries. Arch Pathol Lab Med. 1988 Oct;112(10):1018–1031. [PubMed] [Google Scholar]
- 6.Caplan BA, Schwartz CJ. Increased endothelial cell turnover in areas of in vivo Evans Blue uptake in the pig aorta. Atherosclerosis. 1973 May-Jun;17(3):401–417. doi: 10.1016/0021-9150(73)90031-2. [DOI] [PubMed] [Google Scholar]
- 7.Gerrity RG, Richardson M, Somer JB, Bell FP, Schwartz CJ. Endothelial cell morphology in areas of in vivo Evans blue uptake in the aorta of young pigs. II. Ultrastructure of the intima in areas of differing permeability to proteins. Am J Pathol. 1977 Nov;89(2):313–334. [PMC free article] [PubMed] [Google Scholar]
- 8.Fry DL, Mahley RW, Weisgraber KH, Oh SY. Simultaneous accumulation of Evans blue dye and albumin in the canine aortic wall. Am J Physiol. 1977 Jul;233(1):H66–79. doi: 10.1152/ajpheart.1977.233.1.H66. [DOI] [PubMed] [Google Scholar]
- 9.Fry DL, Herderick EE, Johnson DK. Local intimal-medial uptakes of 125I-albumin, 125I-LDL, and parenteral Evans blue dye protein complex along the aortas of normocholesterolemic minipigs as predictors of subsequent hypercholesterolemic atherogenesis. Arterioscler Thromb. 1993 Aug;13(8):1193–1204. doi: 10.1161/01.atv.13.8.1193. [DOI] [PubMed] [Google Scholar]
- 10.Friedman MH, Henderson JM, Aukerman JA, Clingan PA. Effect of periodic alterations in shear on vascular macromolecular uptake. Biorheology. 2000;37(4):265–277. [PubMed] [Google Scholar]
- 11.LaMack JA, Himburg HA, Li XM, Friedman MH. Interaction of wall shear stress magnitude and gradient in the prediction of arterial macromolecular permeability. Ann Biomed Eng. 2005 Apr;33(4):457–464. doi: 10.1007/s10439-005-2500-9. [DOI] [PubMed] [Google Scholar]
- 12.Adams CW, Bayliss OB. Permeability of inner and outer layers of rat and rabbit aortic wall. Two new microscopic test with trypan blue. Atherosclerosis. 1977 Apr;26(4):419–426. doi: 10.1016/0021-9150(77)90112-5. [DOI] [PubMed] [Google Scholar]
- 13.Fry DL. Aortic Evans blue dye accumulation: its measurement and interpretation. Am J Physiol. 1977 Feb;232(2):H204–222. doi: 10.1152/ajpheart.1977.232.2.H204. [DOI] [PubMed] [Google Scholar]
- 14.LaMack JA, Himburg HA, Friedman MH. Effect of hypercholesterolemia on transendothelial EBD-albumin permeability and lipid accumulation in porcine iliac arteries. Atherosclerosis. 2006 Feb;184(2):255–263. doi: 10.1016/j.atherosclerosis.2005.04.020. [DOI] [PubMed] [Google Scholar]
- 15.Barakat AI, Uhthoff PA, Colton CK. Topographical mapping of sites of enhanced HRP permeability in the normal rabbit aorta. J Biomech Eng. 1992 Aug;114(3):283–292. doi: 10.1115/1.2891385. [DOI] [PubMed] [Google Scholar]
- 16.Weinbaum S, Chien S. Lipid transport aspects of atherogenesis. J Biomech Eng. 1993 Nov;115(4B):602–610. doi: 10.1115/1.2895547. [DOI] [PubMed] [Google Scholar]
- 17.Chen YL, Jan KM, Lin HS, Chien S. Ultrastructural studies on macromolecular permeability in relation to endothelial cell turnover. Atherosclerosis. 1995 Nov;118(1):89–104. doi: 10.1016/0021-9150(95)05596-o. [DOI] [PubMed] [Google Scholar]
- 18.Lin SJ, Jan KM, Schuessler G, Weinbaum S, Chien S. Enhanced macromolecular permeability of aortic endothelial cells in association with mitosis. Atherosclerosis. 1988 Oct;73(2–3):223–232. doi: 10.1016/0021-9150(88)90045-7. [DOI] [PubMed] [Google Scholar]
- 19.Malinauskas RA, Herrmann RA, Truskey GA. The distribution of intimal white blood cells in the normal rabbit aorta. Atherosclerosis. 1995 Jun;115(2):147–163. doi: 10.1016/0021-9150(94)05497-7. [DOI] [PubMed] [Google Scholar]
- 20.Ogunrinade O, Kameya GT, Truskey GA. Effect of fluid shear stress on the permeability of the arterial endothelium. Ann Biomed Eng. 2002 Apr;30(4):430–446. doi: 10.1114/1.1467924. [DOI] [PubMed] [Google Scholar]
- 21.Livak KJ, Schmittgen TD. Analysis of relative gene expression data using real-time quantitative PCR and the 2(-Delta Delta C(T)) Method. Methods. 2001 Dec;25(4):402–408. doi: 10.1006/meth.2001.1262. [DOI] [PubMed] [Google Scholar]
- 22.Buchanan JR, Jr, Kleinstreuer C, Truskey GA, Lei M. Relation between nonuniform hemodynamics and sites of altered permeability and lesion growth at the rabbit aorto-celiac junction. Atherosclerosis. 1999 Mar;143(1):27–40. doi: 10.1016/s0021-9150(98)00264-0. [DOI] [PubMed] [Google Scholar]
- 23.Jo H, Dull RO, Hollis TM, Tarbell JM. Endothelial albumin permeability is shear dependent, time dependent, and reversible. Am J Physiol. 1991 Jun;260(6 Pt 2):H1992–1996. doi: 10.1152/ajpheart.1991.260.6.H1992. [DOI] [PubMed] [Google Scholar]
- 24.Phelps JE, DePaola N. Spatial variations in endothelial barrier function in disturbed flows in vitro. Am J Physiol Heart Circ Physiol. 2000 Feb;278(2):H469–476. doi: 10.1152/ajpheart.2000.278.2.H469. [DOI] [PubMed] [Google Scholar]
- 25.Nichols WW, O’Rourke MF, Hartley C, McDonald DA. McDonald’s blood flow in arteries: theoretic, experimental, and clinical principles. 4. London, New York: Arnold; Oxford University Press; 1998. [Google Scholar]
- 26.Valk PE, Hale JD, Crooks LE, Kaufman L, Roos MS, Ortendahl DA, Higgins CB. MRI of blood flow: correlation of image appearance with spin-echo phase shift and signal intensity. AJR Am J Roentgenol. 1986 May;146(5):931–939. doi: 10.2214/ajr.146.5.931. [DOI] [PubMed] [Google Scholar]
- 27.Klipstein RH, Firmin DN, Underwood SR, Rees RS, Longmore DB. Blood flow patterns in the human aorta studied by magnetic resonance. Br Heart J. 1987 Oct;58(4):316–323. doi: 10.1136/hrt.58.4.316. [DOI] [PMC free article] [PubMed] [Google Scholar]
- 28.Topper JN, Cai J, Falb D, Gimbrone MA., Jr Identification of vascular endothelial genes differentially responsive to fluid mechanical stimuli: cyclooxygenase-2, manganese superoxide dismutase, and endothelial cell nitric oxide synthase are selectively up-regulated by steady laminar shear stress. Proc Natl Acad Sci U S A. 1996 Sep 17;93(19):10417–10422. doi: 10.1073/pnas.93.19.10417. [DOI] [PMC free article] [PubMed] [Google Scholar]
- 29.Davies PF, Remuzzi A, Gordon EJ, Dewey CF, Jr, Gimbrone MA., Jr Turbulent fluid shear stress induces vascular endothelial cell turnover in vitro. Proc Natl Acad Sci U S A. 1986 Apr;83(7):2114–2117. doi: 10.1073/pnas.83.7.2114. [DOI] [PMC free article] [PubMed] [Google Scholar]
- 30.Garcia-Cardena G, Comander J, Anderson KR, Blackman BR, Gimbrone MA., Jr Biomechanical activation of vascular endothelium as a determinant of its functional phenotype. Proc Natl Acad Sci U S A. 2001 Apr 10;98(8):4478–4485. doi: 10.1073/pnas.071052598. [DOI] [PMC free article] [PubMed] [Google Scholar]
- 31.Bao X, Lu C, Frangos JA. Temporal gradient in shear but not steady shear stress induces PDGF-A and MCP-1 expression in endothelial cells: role of NO, NF kappa B, and egr-1. Arterioscler Thromb Vasc Biol. 1999 Apr;19(4):996–1003. doi: 10.1161/01.atv.19.4.996. [DOI] [PubMed] [Google Scholar]
- 32.Ni CW, Wang DL, Lien SC, Cheng JJ, Chao YJ, Hsieh HJ. Activation of PKC-epsilon and ERK1/2 participates in shear-induced endothelial MCP-1 expression that is repressed by nitric oxide. J Cell Physiol. 2003 Jun;195(3):428–434. doi: 10.1002/jcp.10259. [DOI] [PubMed] [Google Scholar]
- 33.Passerini AG, Polacek DC, Shi C, Francesco NM, Manduchi E, Grant GR, Pritchard WF, Powell S, Chang GY, Stoeckert CJ, Jr, Davies PF. Coexisting proinflammatory and antioxidative endothelial transcription profiles in a disturbed flow region of the adult porcine aorta. Proc Natl Acad Sci U S A. 2004 Feb 24;101(8):2482–2487. doi: 10.1073/pnas.0305938101. [DOI] [PMC free article] [PubMed] [Google Scholar]
- 34.Weinberg PD. Rate-limiting steps in the development of atherosclerosis: the response-to-influx theory. J Vasc Res. 2004 Jan-Feb;41(1):1–17. doi: 10.1159/000076124. [DOI] [PubMed] [Google Scholar]
- 35.Forster BA, Weinberg PD. Evans’ blue dye abolishes endothelium-dependent relaxation of rabbit aortic rings. Atherosclerosis. 1997 Feb 28;129(1):129–131. doi: 10.1016/s0021-9150(96)06020-0. [DOI] [PubMed] [Google Scholar]
- 36.DeBakey ME, Lawrie GM, Glaeser DH. Patterns of atherosclerosis and their surgical significance. Ann Surg. 1985 Feb;201(2):115–131. doi: 10.1097/00000658-198502000-00001. [DOI] [PMC free article] [PubMed] [Google Scholar]