Genome-wide association studies (GWAS) have enabled a considerable portion of the human genome to be scanned for genetic variants associated with disease etiology. Such large-scale investigations depend on DNA samples of high biological integrity and quality. As clinical DNA is often available in limited quantities, in vitro reproduction of quality template DNA using whole-genome amplification is necessary. The most widely used technique is multiple displacement amplification with φ29 polymerase1 (φ29MDA). Earlier studies do not offer a detailed map of how robust genome-wide panels of 300,000 to 1 million single-nucleotide polymorphisms (SNPs) will perform with φ29MDA2-3. We performed a meta-analysis of 6,541 DNA samples to assess the extent of information lost (Supplementary Table 1 online), and investigated genotype imputation for recovering the statistical power and genomic coverage of GWAS.
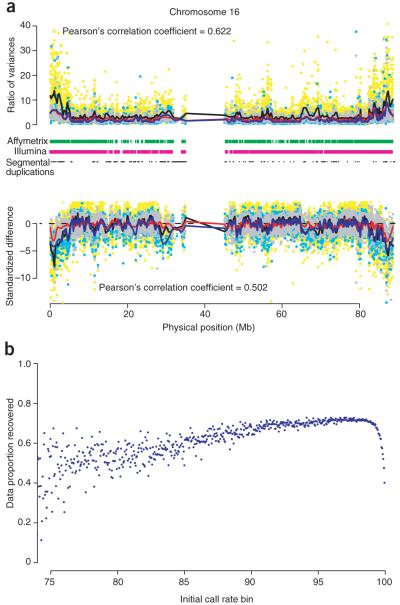
As previously seen with array-CGH3, we observed that φ29MDA led to differential rates of hybridization compared to genomic DNA, especially in telomeric regions, on both Affymetrix and Illumina arrays (Fig. 1a and Supplementary Fig. 1 online). This correlated to the G+C content of the SNP oligonucleotide probes (Supplementary Fig. 2 online) and to the presence of segmental duplications (Supplementary Table 2 online). In the context of a GWAS, this results in a proportion of SNPs with lower signal strength and increased variability, often resulting in overlapping or heavily scattered genotype clusters for both the allelic signal and strength-contrast scales (Supplementary Fig. 3 online). This increases the uncertainty when assigning genotypes and lowers call rates. The average call rates for SNPs on the Affymetrix array for two British cohorts, with φ29MDA amplified (OBC) and genomic (58C) DNA, were 96.3% and 98.7% respectively. The corresponding call rates for the Illumina arrays for a φ29MDA-amplified cohort (ML) and 58C were 95.9% and 98.5%. Furthermore, missing data were distributed nonrandomly across the genome resulting in significant decreases in genomic coverage when we applied GWAS SNP quality control. By excluding SNPs with call rates < 95.0%, the Affymetrix 500K array experienced a 6.5% drop in coverage from 60.6% to 54.1% when measured on the HapMap CEU population at an r2 threshold of 0.8. The Illumina 650Y, a chip with high tag-SNP content, had an 8.1% decrease (81.3% to 73.2%; Supplementary Table 3 and Supplementary Fig. 4 online).
Figure 1.
Missingness and imputation of amplified DNA on chromosome 16. (a) The relative performance of amplified DNA to genomic DNA, as quantified by the ratio of hybridization strengths and the standardized difference in mean hybridization strength. Each plot shows data from three comparisons of amplified DNA to genomic DNA. Affymetrix: TB (cyan dots and blue lines); Affymetrix: OBC-58C (gray dots and red lines); Illumina: ML-58C (yellow dots and black lines). Lines below the upper plots indicate regions where SNPs on the platform have call rates < 95.0%. The dashes in black indicate regions of segmental duplications. (b) The expected proportion of missing genotypes which can be recovered using the program IMPUTE6 as a function of the initial call rate. Initial SNP call rates have been partitioned into 0.01 bins with each bin’s data proportion recovery averaged across the number of SNPs.
Most low call rate SNPs contain individuals with signal intensities found in overlapping genotype clusters. Although the use of custom calling algorithms can potentially alleviate this4, genotype imputation provides a highly promising solution for analyzing regions with sufficient linkage disequilibrium by statistically inferring missing genotypes with high accuracy5 (Supplementary Fig. 5 online). Expanding this strategy to a genome-wide scale, we imputed the regions of data loss for the OBC cohort, and assessed genome coverage and data recovery. Using a probability threshold of 0.90, imputation of all missing genotypes for OBC samples recovered an additional 2.4% of the original φ29MDA dataset, giving an overall call rate of 98.7% across all SNPs. This is comparable to the performance for the 58C. Typically, one can expect to recover 60% of a SNP’s missing genotypes if the initial call rate is >75.0% (Fig. 1b). Imputation rescued 328 (14.9%) samples and 80,613 (16.7%) SNPs. The recovery of SNPs increased genome coverage for the Affymetrix 500K (measured by the HapMap CEU population at a pairwise r2 > 0.8) from 54.1% to 59.7% (with benchmark coverage at 60.6%), while the recovered samples allowed greater power in a GWAS.
Although variation in between SNPs across different populations and the SNP content of genotyping arrays may affect the performance of imputation, the statistical inference of missing genotypes presents a powerful solution for genetic studies constrained by severely limited quantities of DNA.
Supplementary Material
Footnotes
Note: Supplementary information is available on the Nature Methods website.
References
- 1.Dean FB, et al. Proc. Natl. Acad. Sci. 2002;99:5261–5266. doi: 10.1073/pnas.082089499. [DOI] [PMC free article] [PubMed] [Google Scholar]
- 2.Paez JG, et al. Nucleic Acids Res. 2004;32:e71. doi: 10.1093/nar/gnh069. [DOI] [PMC free article] [PubMed] [Google Scholar]
- 3.Lage JM, et al. Genome Res. 2003;13:294–307. doi: 10.1101/gr.377203. [DOI] [PMC free article] [PubMed] [Google Scholar]
- 4.Teo YY, et al. Bioinformatics. 2007;23:2741–2746. doi: 10.1093/bioinformatics/btm443. [DOI] [PMC free article] [PubMed] [Google Scholar]
- 5.Marchini J, Howie B, Myers S, McVean G, Donnelly P. Nat. Genet. 2007;39:906–913. doi: 10.1038/ng2088. [DOI] [PubMed] [Google Scholar]
Associated Data
This section collects any data citations, data availability statements, or supplementary materials included in this article.


