Abstract
The debate on the origin and evolution of flowers has recently entered the field of developmental genetics, with focus on the design of the ancestral floral regulatory program. Flowers can differ dramatically among angiosperm lineages, but in general, male and female reproductive organs surrounded by a sterile perianth of sepals and petals constitute the basic floral structure. However, the basal angiosperm lineages exhibit spectacular diversity in the number, arrangement, and structure of floral organs, whereas the evolutionarily derived monocot and eudicot lineages share a far more uniform floral ground plan. Here we show that broadly overlapping transcriptional programs characterize the floral transcriptome of the basal angiosperm Persea americana (avocado), whereas floral gene expression domains are considerably more organ specific in the model eudicot Arabidopsis thaliana. Our findings therefore support the “fading borders” model for organ identity determination in basal angiosperm flowers and extend it from the action of regulatory genes to downstream transcriptional programs. Furthermore, the declining expression of components of the staminal transcriptome in central and peripheral regions of Persea flowers concurs with elements of a previous hypothesis for developmental regulation in a gymnosperm “floral progenitor.” Accordingly, in contrast to the canalized organ-specific regulatory apparatus of Arabidopsis, floral development may have been originally regulated by overlapping transcriptional cascades with fading gradients of influence from focal to bordering organs.
Keywords: ABC model, basal angiosperms, comparative transcriptome analysis, fading borders model, floral evolution
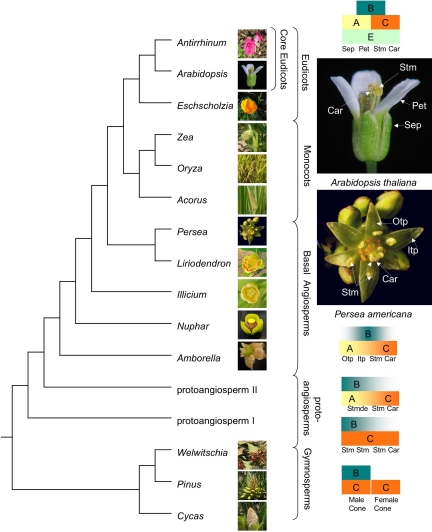
Recent insights into the genetic regulation of floral organ identity suggest that simple switches in the regulatory programs of nonflowering seed plants could have produced the original flowers (1–4) (Fig. 1). Although differing in details, these hypotheses involve transformation of a unisexual reproductive shoot into a bisexual structure with female organs (carpels) above male organs (stamens), through modifications to ancient genetic programs for male and female organ identity. Condensation of this cone-like axis, followed by development of an envelope of sterile perianth appendages surrounding the sexual organs, and perianth dimorphism into outer sepals (leaf-like) and inner petals (usually attractively colored), produced the typical flower (2). In the eudicot genetic model Arabidopsis thaliana, the development of such flowers is regulated by the “ABC model,” in which A and C represent mutually antagonistic functions that combine with B function to specify floral organ identity: A specifies sepals, AB specify petals, BC specify stamens, and C specifies carpels (5). E function (D having been assigned to ovule specification) is hypothesized to coordinate combinatorial activity between AB and BC factors through the assembly of tetrameric protein complexes, or “floral quartets” (6, 7). In Arabidopsis, A function is provided by APETALA1 (AP1) and APETALA2 (AP2), B function by APETALA3 (AP3) and PISTILLATA (PI), C function by AGAMOUS (AG), and E function by multiple SEPALLATA gene products (SEP1–4) (5–7). All but AP2 belong to the large MADS domain family of transcription factors (8).
Fig. 1.
On the origin and evolution of the floral developmental genetic program. Relationships between angiosperm and gymnosperm subjects of current genetic studies are indicated in accordance with current phylogenetic trees, and hypothetical “protoangiosperm” stages are inserted below angiosperms to illustrate hypothesized steps in floral origin from gymnosperm cones (1, 2). Color schemes on the right depict hypothesized (1, 2) and established gene expression patterns of ABC genes (5–7, 11, 12) in the evolution of the floral regulatory program. Reduction of B function in the distal region of male gymnosperm cones results in female development (carpels) in a bisexual protoangiosperm I, and subsequent reduction of C function at the proximal region leads to the replacement of stamens by sterile perianth organs in protoangiosperm II. Expression data for basal angiosperms (11, 12) suggest that a “fading borders” mechanism of organ identity determination was active before the establishment of the strict expression domains of the ABC(E) model in Arabidopsis (13–15). For comparative purposes, protoangiosperm “flowers” are depicted with condensed axes, although this step may have occurred between stages I and II (2); A function is included despite its controversial status. Persea americana and Arabidopsis thaliana flowers are enlarged to compare their morphologies: both have whorled phyllotaxy, but in Persea an undifferentiated perianth of tepals surrounds the stamens and carpels, whereas a dimorphic perianth with green sepals and white petals surrounds the reproductive organs of Arabidopsis. Otp, outer tepals; Itp, inner tepals; Stm, stamens; Stmde, staminodes; Car, carpels; Sep, sepals; Pet, petals. Photo credits: S. Kim for Amborella; Yi Hu for Nuphar; A.S.C. for Persea; A. Morris for Illicium; and public domain for the remaining.
Conserved expression patterns and successful complementation experiments for homologues of AG and AP3/PI in diverse angiosperms and gymnosperms suggest that B and C functions form the ancestral nucleus of the ABC(E) model, whereas A and E functions arose later in angiosperm evolution (2). Controversy surrounds A function, which may not be separable from floral meristem specification (9), but E function seems to operate in rice (10), suggesting an origin before the separation of monocots and eudicots. Genetic models have yet to be established among basal angiosperms, but the expression domains of ABC homologues, B homologues in particular, often extend beyond their expected boundaries (11, 12), supporting the “fading borders” modification of the ABC model for organ identity in their flowers (13–15) (Fig. 1).
Here, we have drawn upon progress in the characterization of global transcriptional patterns in Arabidopsis flowers for comparisons with the basal angiosperm Persea americana (avocado), to elucidate commonalities and features of the ancestral floral developmental program. Persea is a member of the magnoliid clade of basal angiosperms that, together with Chloranthales, lies sister to the eudicot + monocot clade in recent phylogenetic reconstructions (16, 17). Persea flowers are bisexual, with both stamens and carpels, and bear an undifferentiated perianth of petaloid organs, termed tepals (Fig. 1). An undifferentiated perianth is characteristic of basal angiosperms (18) and represents an intermediate stage in the evolutionary scenario for flowers, before the differentiation of sepals and petals (2).
Results
Custom microarrays targeting 6,068 genes collected from Persea floral buds by the Floral Genome Project (19, 20) identified 4,797 significantly differentially expressed genes (P < 0.05; false discovery rate = 0.62%) among 8 sampled tissues: inflorescence buds, premeiotic floral buds, outer tepals, inner tepals, stamens (including staminodes), carpels, initiating fruit, and leaves (Fig. S1). For Arabidopsis, measures of gene expression in wild-type vs. mutant flowers have identified large numbers of genes that are not expressed in the absence of ABC gene activity and likely act downstream of these transcription factors (21, 22). However, wild-type expression levels in floral organs, reported in the AtGenExpress dataset (23), are more comparable to our Persea data. The AtGenExpress data also include measures of gene expression in leaves, the vegetative organ we assayed to provide a benchmark for assessing florally biased expression in Persea. Because Arabidopsis floral organs are transformed into leaves in the absence of ABC(E) gene activity, and vice versa (6, 7), elevated expression in flowers relative to leaves likely applies to components of the transcriptome operating downstream of these floral regulators. Illustrating this relationship, positive log2 floral organ/leaf expression ratios calculated from the AtGenExpress dataset generally match negative mutant/wild-type ratios predicted by the ABC(E) model (Fig. S2). Notably, amidst the predominant pairing of downregulation in mutants and elevated floral expression, the anticipated upregulation of petal-expressed genes in ag flowers (22) is also evident. Furthermore, these ratios describe the established expression patterns of the ABC genes (Table S1), supporting their use in standardizing comparisons of transcriptional patterns in Persea and Arabidopsis flowers.
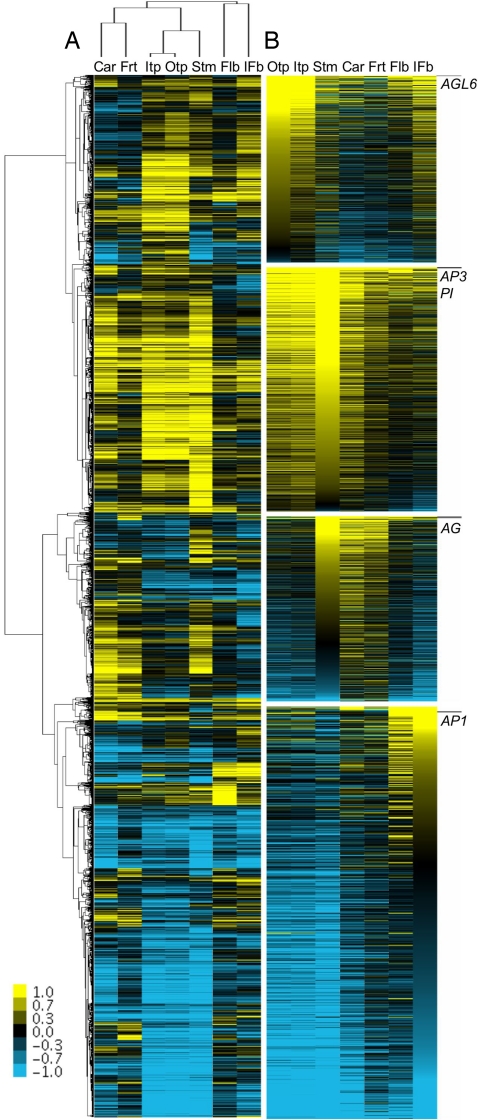
Unsupervised hierarchical clustering (24) of differentially expressed Persea genes assembled log2 expression ratios into groups, accommodating, and potentially regulated by, homologues of AG, AP3 and PI, AP1, and a fifth MADS domain gene, AGAMOUS-LIKE 6 (AGL6), respectively (Fig. 2). These genes are among the most highly expressed components of their respective clusters and exemplify the expression patterns of genes ostensibly downstream of them (Fig. 2). The broadest gene expression pattern is shown by genes clustered with homologues of AP3 and PI, the expression levels of which peak in stamens but remain high in tepals and are also detectable in carpels (Table S1; see also ref. 11). AG homologues are also broadly expressed, most strongly in stamens and carpels but still detectably in tepals (Table S1; see also ref. 11). In general, coexpressed genes are primarily upregulated in stamens and carpels. Genes grouped with homologues of AGL6 [which have uncertain function (25)] exhibit the opposite expression pattern [i.e., upregulation in tepals (Table S1; see also ref. 11)], whereas in a departure from perianth specification in Arabidopsis, the AP1 homologue is sharply downregulated after strong initial expression in inflorescence buds (Fig. 2). Thus, expression patterns in Persea flowers correspond well with individual A, B, and C functions, while organ-specific biases are largely absent.
Fig. 2.
Transcriptional patterns in Persea flowers. (A) Hierarchical clustering of significantly differentially expressed genes assembled elevated floral expression into 4 groups accommodating homologues of MADS domain genes with prominent (AG, AP3/PI, AP1) and unclear (AGL6) roles in floral developmental genetics. The hierarchy of tissue relationships indicates transcriptional similarities for inflorescences and floral buds, carpels and fruits, and tepals and stamens. (B) Homologues of AG, AP3, PI, AGL6, and AP1 (positions indicated by black bars) rank among the most highly expressed members of their respective clusters sorted by expression levels in outer tepals (AGL6 cluster), stamens (AP3/PI and AG clusters), and inflorescence buds (AP1 cluster). The scale bar of log2 expression ratios ranges from saturated yellow (1 and higher = at least 2-fold upregulated) to saturated blue (−1 and lower = at least 2-fold downregulated). Car, carpels; Flb, floral buds; Frt, fruits; IFb, inflorescence buds; Itp, inner tepals; Otp, outer tepals; Stm, stamens.
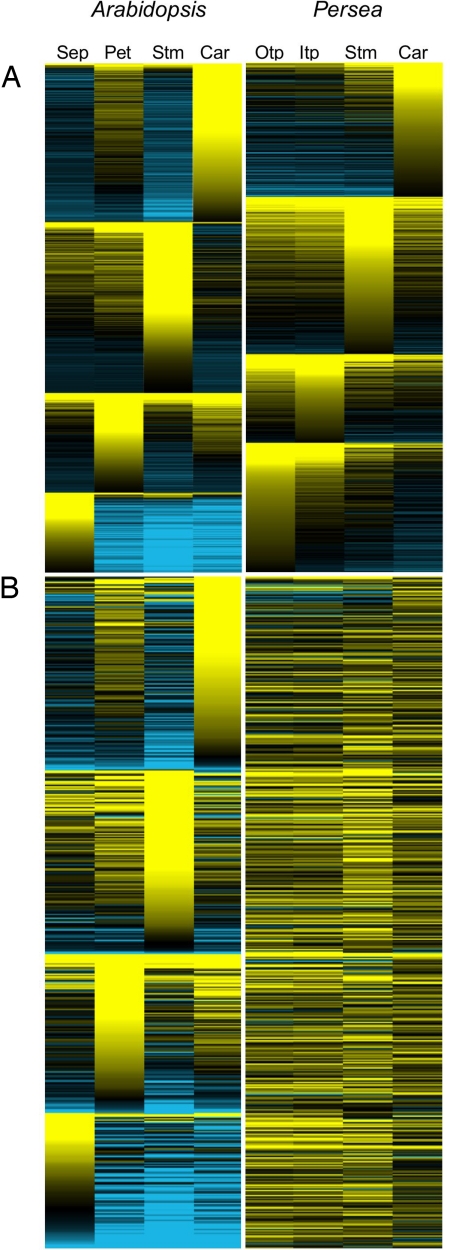
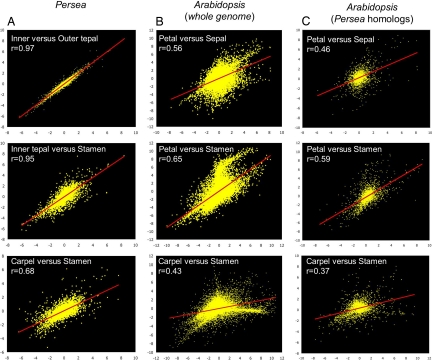
With these insights, we sought to determine how expression domains in Persea flowers compare with those in Arabidopsis. First, in global assessments of their transcriptional landscapes, organ-wise partitioning of elevated floral expression ranked in descending order indicates that, in Arabidopsis, expression domains are predominantly tightly constrained to individual organ categories with little “leakage” into adjacent whorls, whereas in Persea, all but the most weakly expressed genes extend from sites of peak expression into adjacent whorls and beyond (Fig. 3A). Almost all genes with peak expression in Arabidopsis carpels have negative expression ratios in stamens, and vice versa. The same is true for sepals and petals, and although genes with peak expression in Arabidopsis stamens are often also upregulated in petals, the reverse is not true. Curiously, this reciprocal relationship exists for petals and carpels, organs that, following the ABC model, do not share genetic developmental instructions. In Persea, however, genes expressed in tepals and carpels represent a subset of those expressed in tepals and stamens. Second, similar analyses comparing the expression domains of homologous genes (Fig. 3B) indicate that expression peaks restricted to individual Arabidopsis organs universally correspond to broader expression domains in Persea. Third, plots of log2 floral organ/leaf expression ratios comparing the transcriptional profiles of adjacent floral whorls generally assemble relative transcript frequencies close to the regression line in Persea, whereas these are skewed toward the axes in Arabidopsis (Fig. 4 A–C). Even lower correlations are obtained for Arabidopsis when only homologues of Persea genes are considered (compare Fig. 4 B and C), making it unlikely that our particular sample of Persea genes artificially increases correlations between floral whorls. Taken together, these results describe 2 distinct floral genetic landscapes: transcriptional programs in Persea flowers are deployed in broad domains that overlap across adjacent whorls and beyond, whereas those in Arabidopsis are more tightly constrained to individual organ categories.
Fig. 3.
The expression domains of genes with elevated floral expression are broader in Persea than in Arabidopsis. (A) Positive log2 floral organ/leaf ratios for Arabidopsis from the AtGenExpresss dataset (23) and Persea are ranked by organ of peak expression. (B) As above, but with the subset of genes with reciprocal homology sorted by Arabidopsis organs of peak expression. The scale of log2 expression ratios ranges from saturated yellow (1 and higher = at least 2-fold upregulated) to saturated blue (−1 and lower = at least 2-fold downregulated). Otp, outer tepals; Itp, inner tepals; Stm, stamens; Car, carpels; Sep, sepals; Pet, petals.
Fig. 4.
Transcriptional profiles of floral organs are more strongly correlated in Persea than Arabidopsis. Scatterplots of log2 floral organ/leaf ratios in adjacent floral organs of (A) Persea and (B and C) Arabidopsis. Pearson correlations of gene expression levels in the transcriptional profiles of adjacent floral organs are given. Plots and correlation values are calculated from genes in (A) the entire Persea dataset, (B) the entire AtGenExpress dataset (23) and (C) the subset of Arabidopsis genes with homologues in the Persea dataset. Pair-wise comparisons of correlations computed for Persea organs and the corresponding Arabidopsis organs (across rows) are all significantly different (z > 2.56).
Discussion
Our comparisons of the transcriptional patterns in Persea and Arabidopsis flowers provide insights into the ancestral floral developmental genetic program and its subsequent evolution. Persea flowers bear 3 types of floral organs [tepals, stamens (including staminodes), and carpels]; therefore, 3 distinguishable transcriptional programs should be, and are, deployed—but not 1 per organ category. Instead of being organ specific, they are overlapping, with broad domain expansions from sites of peak expression contributing to strong correlations between the expression profiles of adjacent floral whorls.
Earlier studies of ABC homologues in phylogenetically pivotal basal angiosperms, including Persea (11, 12), have supported the “fading borders” model of floral organ identity in basal angiosperms (13–15) (Fig. 1). Originally developed to explain the intergrading morphologies of spirally arranged organs in Amborella and other basal angiosperm flowers, “fading borders” posits that gradually fading influence toward the periphery of organ identity functions, of B function in particular, imparts some features of adjacent floral organs onto each other. A continuum of staminal features can be traced from stamens to tepals and from stamens to carpels in Persea flowers (26), and this seems to be well reflected in organ-wise transcriptional profiles.
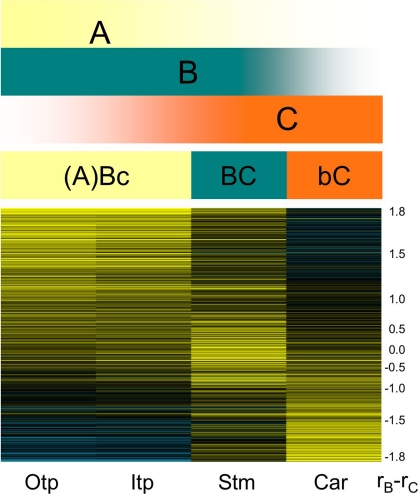
Our findings therefore extend the “fading borders” scenario from morphology and the key organ identity genes to the floral transcriptome (i.e., those genes including and lying downstream of the ABC genes). As such, fading activities of B and C class organ identity genes in central and peripheral floral regions, respectively, may be a vestige of the contraction of the male developmental program (BC) in evolutionary scenarios for floral origin (reviewed in ref. 1). Accordingly, carpel development proceeds where C function is the primary influence, whereas sterile perianth organs develop where B function is dominant (Fig. 5). The perianth identity program may be derived from interrupted stamen identity functions (2), and several genes implicated in AG repression participate in the Arabidopsis petal identity program (27). AG homologues are, however, expressed in Persea tepals, but at lower levels than in stamens and carpels, suggesting that genetic mechanisms for their repression exist, albeit in rudimentary form, in this basal angiosperm.
Fig. 5.
A “fading borders” model for Persea floral organ identity. While it remains to be shown whether A function exists, the present data indicate that floral organs are all influenced by B and C functions, but in varying proportions. Accordingly, transcriptional cascades regulated by “Bc,” “BC,” and “bC” activities, where lowercase font indicates lower functional influence, promote the development of tepals, stamens, and carpels, respectively. These shifting balances in B and C influence are evident in the relative correlations between transcriptional patterns in Persea flowers and B (rB) and C (rC) expression domains (Bottom). Genes with similar rB and rC values (rB − rC ∼ 0.0) are expressed primarily in stamens, whereas those with greater rB and rC scores are, respectively, primarily expressed in tepals and carpels. The scale of log2 expression ratios ranges from saturated yellow (1 and higher = at least 2-fold upregulated) to saturated blue (−1 and lower = at least 2-fold downregulated). The numeric scale measures the difference in rB and rC values (rB − rC = 1.8 to −1.8). Otp, outer tepals; Itp, inner tepals; Stm, stamens, Car, carpels.
Transcriptional programs remarkably similar to those in Persea are deployed across the intergrading floral organs of the water lily Nuphar (Nymphaeales; M.-J. Yoo, A.S.C., N.S.A., D.E.S., and P.S.S., unpublished data), representing the lineage that likely lies sister to all extant flowering plants except Amborella (16, 17). In Arabidopsis, in contrast, expression patterns highlighted here resemble the organ-specific transcriptional cascades predicted by the standard ABC(E) model (Fig. 3). On the basis of our data, we hypothesize that broadly overlapping transcriptional programs, promoted by B, C, and perhaps yet unknown A functions, act to orchestrate floral development in basal angiosperms through shifting gradients of influence that impart intergrading morphologies on floral organs (Fig. 5). As such, the ancestral flower may have been built by an incompletely partitioned regulatory mechanism that was subsequently modified into the highly canalized organ identity programs of Arabidopsis.
Methods
Array Design, Experimental Design, and Implementation.
Custom Persea microarrays, printed by Agilent Technologies, contain 10,187 randomly arrayed in situ–synthesized 60-mer oligonucleotide probes, designed as previously described (20), targeting 6,068 unique floral transcripts, collected and sequenced by the Floral Genome Project (19). Except for phylogenetic analyses of MADS domain genes (11), homology between 3,790 of these Persea genes and 3,187 Arabidopsis genes was assigned through best reciprocal BLAST E scores <10−5. Expression profiles of inflorescence buds, premeiotic floral buds, inner and outer tepals, stamens, carpels, initiating fruit, and leaves were assessed in an interwoven double-loop design (28) for 8 samples with 16 arrays (Fig. S1), which, compared with a reference design, minimizes the variance of pair-wise comparisons and increases power to detect differential gene expression (20). Sample materials were collected from 2 individuals (biologic replicates) cultivated on the University of Florida's Gainesville campus (Kim 1135 and Chanderbali 618, respectively; vouchers deposited at the University of Florida Herbarium), and RNA was isolated twice for technical replication using a method described for basal angiosperms (11, 12). RNA transcripts were hybridized to the arrays in accordance with Fig. S1.
Data Acquisition and Analyses.
Arrays were scanned with an Agilent DNA microarray scanner using Agilent's Feature Extraction Software 9.1.3. Raw data were read into Bioconductor's Limma package (29) for normalization and differential expression analysis. Arrays passing graphic quality-control checks were background corrected and loess normalized within, and A-quantile normalized between, arrays (29, 30). A 1-way empirical Bayes ANOVA, using single-channel analysis while accounting for correlation between channels (29, 30), identified significantly differentially expressed genes. Expression data for Arabidopsis (22, 23) were obtained from the Gene Expression Omnibus (accession no. GSE1275) and the Arabidopsis Information Resource (accession no. ME00319). Expression data were visualized using Java TreeView (31).
Supplementary Material
Acknowledgments.
We thank C. dePamphilis, J. Carlson, K. Wall, L. Mueller, D. Ilut, and W. Farmerie for EST sequencing and analysis; and M. Popp and the staff of the Interdisciplinary Center for Biotechnology Research at University of Florida for technical assistance with microarray processing. Oligonucleotide probes for the Persea arrays were designed by R. Gharaibeh and C. Gibbas of University of North Carolina-Charlotte. This study was supported by National Science Foundation Grants PRG-0115684 to the Floral Genome Project and PGR-0638595 the Ancestral Angiosperm Genome Project.
Footnotes
The authors declare no conflict of interest.
Data deposition: The experimental data reported in this paper have been deposited in the NCBI database (GEO accession no. GSE 13737).
This article is a PNAS Direct Submission.
This article contains supporting information online at www.pnas.org/cgi/content/full/0811476106/DCSupplemental.
References
- 1.Theissen G, Melzer R. Molecular mechanisms underlying origin and diversification of the angiosperm flower. Ann Bot. 2007;100:603–619. doi: 10.1093/aob/mcm143. [DOI] [PMC free article] [PubMed] [Google Scholar]
- 2.Baum DA, Hileman LC. A developmental genetic model for the origin of the flower. In: Ainsworth C, editor. Flowering and Its Manipulation. United Kingdom: Blackwell, Sheffield; 2006. pp. 3–27. [Google Scholar]
- 3.Frohlich MW, Parker DS. The mostly male theory of flower evolutionary origins: From genes to fossils. Syst Bot. 2000;25:155–170. [Google Scholar]
- 4.Albert VA, Oppenheimer DG, Lindqvist C. Pleiotropy, redundancy and the evolution of flowers. Trends Plant Sci. 2002;7:297–301. doi: 10.1016/s1360-1385(02)02300-2. [DOI] [PubMed] [Google Scholar]
- 5.Coen ES, Meyerowitz EM. The war of the whorls: Genetic interactions controlling flower development. Nature. 1991;353:31–37. doi: 10.1038/353031a0. [DOI] [PubMed] [Google Scholar]
- 6.Honma T, Goto K. Complexes of MADS-box proteins are sufficient to convert leaves into floral organs. Nature. 2001;409:525–529. doi: 10.1038/35054083. [DOI] [PubMed] [Google Scholar]
- 7.Theißen G, Saedler H. Plant biology: Floral quartets. Nature. 2001;409:469–471. doi: 10.1038/35054172. [DOI] [PubMed] [Google Scholar]
- 8.Ma H, dePamphilis CW. The ABCs of floral evolution. Cell. 2000;101:5–8. doi: 10.1016/S0092-8674(00)80618-2. [DOI] [PubMed] [Google Scholar]
- 9.Litt A. An evaluation of A-function: Evidence from the APETALA1 and APETALA2 gene lineages. Int J Plant Sci. 2007;168:73–91. [Google Scholar]
- 10.Whipple CJ, Schmidt RJ. Genetics of grass flower development. Adv Bot Res. 2006;44:385–424. [Google Scholar]
- 11.Chanderbali AS, et al. Genetic footprints of stamen ancestors guide perianth evolution in Persea (Lauraceae) Int J Plant Sci. 2006;167:1075–1089. [Google Scholar]
- 12.Kim S, et al. Expression of floral MADS-box genes in basal angiosperms: Implications for the evolution of floral regulators. Plant J. 2005;43:724–744. doi: 10.1111/j.1365-313X.2005.02487.x. [DOI] [PubMed] [Google Scholar]
- 13.Soltis DE, et al. The floral genome: an evolutionary history of gene duplication and shifting patterns of gene expression. Trends Plant Sci. 2007;12:358–367. doi: 10.1016/j.tplants.2007.06.012. [DOI] [PubMed] [Google Scholar]
- 14.Soltis PS, Soltis DE, Kim S, Chanderbali AS, Buzgo M. Expression of floral regulators in basal angiosperms and the origin and evolution of ABC-function. Adv Bot Res. 2006;44:385–424. [Google Scholar]
- 15.Buzgo M, Soltis PS, Soltis DE. Floral developmental morphology of Amborella trichopoda (Amborellaceae) Int J Plant Sci. 2004;165:925–947. [Google Scholar]
- 16.Jansen RK, et al. Analysis of 81 genes from 64 plastid genomes resolves relationships in angiosperms and identifies genome-scale evolutionary patterns. Proc Natl Acad Sci USA. 2007;104:19369–19374. doi: 10.1073/pnas.0709121104. [DOI] [PMC free article] [PubMed] [Google Scholar]
- 17.Moore MJ, Bell CD, Soltis PS, Soltis DE. Using plastid genome-scale data to resolve enigmatic relationships among basal angiosperms. Proc Natl Acad Sci USA. 2007;104:19363–19368. doi: 10.1073/pnas.0708072104. [DOI] [PMC free article] [PubMed] [Google Scholar]
- 18.Endress PK. The flowers in extant basal angiosperms and inferences on ancestral flowers. Int J Plant Sci. 2001;162:1111–1140. [Google Scholar]
- 19.Albert VA, et al. Floral gene resources from basal angiosperms for comparative genomics research. BMC Plant Biol. 2005;5:1–15. doi: 10.1186/1471-2229-5-5. [DOI] [PMC free article] [PubMed] [Google Scholar]
- 20.Altman NS, et al. Behind the scenes: Planning a multispecies microarray experiment. Chance. 2006;19:28–39. [Google Scholar]
- 21.Zik M, Irish VF. Global identification of target genes regulated by APETALA3 and PISTILLATA floral homeotic gene action. Plant Cell. 2003;15:207–222. doi: 10.1105/tpc.006353. [DOI] [PMC free article] [PubMed] [Google Scholar]
- 22.Wellmer F, Riechmann JL, Alves-Ferreira M, Meyerowitz EM. Genome-wide analysis of spatial gene expression in Arabidopsis flowers. Plant Cell. 2004;16:1314–1326. doi: 10.1105/tpc.021741. [DOI] [PMC free article] [PubMed] [Google Scholar]
- 23.Schmid M, et al. A gene expression map of Arabidopsis thaliana development. Nat Genet. 2005;37:501–506. doi: 10.1038/ng1543. [DOI] [PubMed] [Google Scholar]
- 24.de Hoon MJ, Imoto S, Nolan J, Miyano S. Open source clustering software. Bioinformatics. 2004;20:1453–1454. doi: 10.1093/bioinformatics/bth078. [DOI] [PubMed] [Google Scholar]
- 25.Ma H, Yanofsky MF, Meyerowitz EM. AGL1-AGL6, an Arabidopsis gene gamily with similarity to floral homeotic and transcription factor genes. Genes Dev. 1991;5:484–495. doi: 10.1101/gad.5.3.484. [DOI] [PubMed] [Google Scholar]
- 26.Buzgo M, et al. Floral developmental morphology of Persea americana (avocado, Lauraceae): The oddities of male organ identity. Int J Plant Sc. 2007;168:261–284. [Google Scholar]
- 27.Irish VF. The Arabidopsis petal: A model for plant organogenesis. Trends Plant Sci. 2008;13:430–436. doi: 10.1016/j.tplants.2008.05.006. [DOI] [PubMed] [Google Scholar]
- 28.Altman NS, Hua J. Extending the loop design for 2-channel microarray experiments. Genet Res. 2006;88:153–163. doi: 10.1017/S0016672307008476. [DOI] [PubMed] [Google Scholar]
- 29.Smyth GK. Limma: Linear models for microarray data. In: Gentleman R, Carey V, Dudoit S, Irizarry R, Huber W, editors. Bioinformatics and Computational Biology Solutions using R and Bioconductor. New York: Springer; 2005. pp. 397–420. [Google Scholar]
- 30.Smyth GK. Linear models and empirical Bayes methods for assessing differential expression in microarray experiments. Stat Appl Gen Mol Biol. 2004;3:1–26. doi: 10.2202/1544-6115.1027. [DOI] [PubMed] [Google Scholar]
- 31.Saldanha AJ. Java Treeview—Extensible visualization of microarray data. Bioinformatics. 2004;20:3246–3248. doi: 10.1093/bioinformatics/bth349. [DOI] [PubMed] [Google Scholar]
Associated Data
This section collects any data citations, data availability statements, or supplementary materials included in this article.


