

0. Abstract
The threshold of stability (ToS) is introduced as a new tool for evaluating spinal stability. Current methods have evaluated the magnitude of spinal kinematic variability, stability diffusion, or Lyapunov exponents. This present method differs by modifying task difficulty to obtain a critical value delineating regions of stability and instability. Conceptually, as task difficulty increases, kinematic variability of the system increases and the basin of stability decreases. When kinematic variability exceeds the basin of stability, stability cannot be maintained over time. This concept is first illustrated using a mathematical model, from which an effective potential function was calculated to show the relationships among kinematic variability, the basin of stability, and task difficulty. In addition, an experiment was performed to evaluate the sensitivity of the ToS to changes in postural control using visual feedback as a control variable. The ToS was found to be more sensitive than the Lyapunov exponent to removal of visual feedback, suggesting it may have use as a diagnostic indicator (e.g. for low back pain). Furthermore, this new method has an additional advantage in that minimal instrumentation is needed. Its simplicity, sensitivity, and low cost suggest that the ToS has potential as a diagnostic or prognostic tool in a clinical setting.
Keywords: Threshold of Stability, Lyapunov, Spinal Stability, Kinematic Variability, Low Back Pain
1. Introduction
The term spinal stability may be used to describe the ability of the spine, paraspinal ligaments, core musculature, and neuromuscular control system to maintain an upright posture. As argued by several researchers (Dieën, Cholewicki et al., 2003; Panjabi, 2003; Granata, Slota et al., 2004) loss of spinal stability may lead to excessive strain of paraspinal tissues and thereby be a potential cause of low back pain (LBP). There is no consensus on the definition of spinal stability (Reeves, Narendra et al., 2007). However in biomechanics, diverse parameters have been developed as indicators of system stability or robustness. Kinematic variability (KV) has commonly been used to quantify stability (Overstall, Exton-Smith et al., 1977; Fernie, Gryfe et al., 1982; Prieto, Myklebust et al., 1996; Blaszczyk, 2008), and is based on the assumption that more robust systems will be able to more effectively reduce system variability. Some of these KV parameters include displacement, standard deviation, RMS area and path velocity of the center of mass (COM) or center of pressure (COP). In addition, stability diffusion analysis (Collins and De Luca, 1993; Cholewicki, Polzhofer et al., 2000; Hsiao-Wecksler, Katdare et al., 2003) and Lyapunov stability (Dingwell, Cusumano et al., 2000; England and Granata, 2007; Lee and Granata, 2008) have been used to quantify stability, based on the rate of separation and the divergence of state trajectories, respectively. Higher diffusion or divergence rates are indicators of a less robust system.
All of these existing methods evaluate system performance at a fixed level of task difficulty. An alternative approach is presented and evaluated herein, involving explicit manipulation of task difficulty. The basic premise is that increasing task difficulty will have two effects. First, KV of the system will increase, indicating that the participant will explore a larger region of state space. Second, the size of the basin of stability (stable region of state space) will decrease, reducing the area of stable system behavior. When KV goes beyond the boundary of the basin of stability, the system will exhibit unstable behavior (Figure 1). Based on this premise, a new metric is introduced, the threshold of stability (ToS). ToS is defined as the maximum task difficulty in which stability can be maintained, and is found by increasing task difficulty until KV lies just within the boundary of the basin of stability.
Figure 1.

Schematic diagrams of the state space. (a) If kinematic variability (KV) is fully within the stable region, the system is stable. As task difficulty increases, the KV increases while the basin of stability shrinks. (b) If the range of KV extends beyond the boundary of the stable region in state space, the system will become unstable.
The purpose of this study was to develop the ToS and to evaluate its potential to serve as a quantitative indicator for spinal stability. It was hypothesized that the ToS would be able to detect changes in spinal stability induced by removal of visual feedback during unstable sitting tests. In addition, the theoretical basis for the ToS was evaluated using a mathematical model of unstable sitting.
2. Methods
2.1 Overview of Experiment
The wobble chair (Figure 2a) is an unstable seat apparatus used to evaluate spinal stability based on the apparatus developed by Cholewicki et al. (2000) and used in several subsequent studies (Cholewicki, Polzhofer et al., 2000; Tanaka and Granata, 2007; Lee and Granata, 2008; Lee, Granata et al., 2008; Slota, Granata et al., 2008). The seat pivots on a central low-friction ball joint, and adjustable springs are positioned at the front, back, left and right of center. Moving these springs closer to the center decreases the restorative moment applied to the seat, thereby increasing task difficulty. Although full medial-lateral (ML) and anterior-posterior (AP) motion is possible, large ML spring distances were employed here to limit movements outside the sagittal plane.
Figure 2.
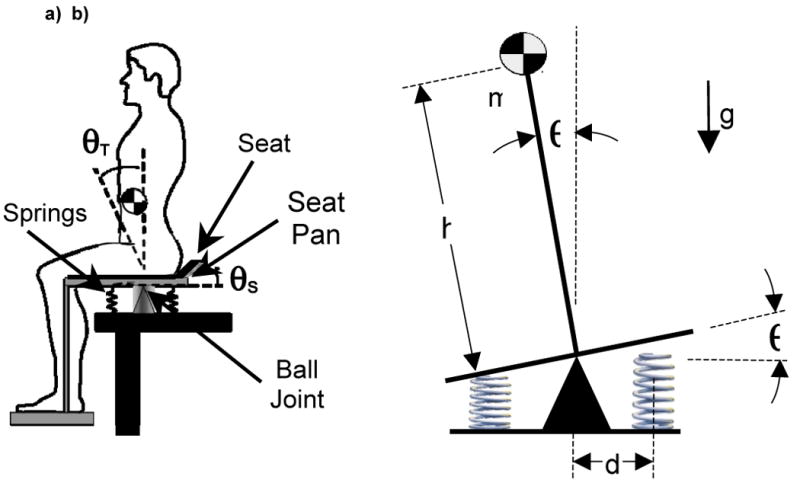
Experimental and model configuration. (a) The wobble chair is a seated stability test apparatus where movement of the lumbar spine is used to maintain balance (Adapted from (Cholewicki, Polzhofer et al., 2000; Tanaka and Granata, 2007)). (b) A simple model of the wobble chair consists of a planar inverted pendulum with concentrated mass, stabilizing springs and a limited gain controller.
During unstable sitting tests, postural control was challenged to determine the maximum task difficulty (smallest AP spring spacing) at which stability could be achieved (i.e. the ToS). Sensitivity of this new approach was determined with respect to the presence or absence of visual feedback (eyes open or closed) and was compared with an alternative measure of local dynamic stability (state-space averaged maximum Lyapunov exponent). Visual feedback, a known component of balance control (Jacobson, Newman et al., 1993; Herdman, 2007), was selected as an independent variable because it was easily altered and has been shown to have a substantial influence on the outcome of balance control tests (Roerdink, De Haart et al., 2006; Blaszczyk, 2008). Moreover, it allowed within-subjects comparisons to be made with associated improvements in effect estimation.
2.2 Mathematical Model
A simple inverted pendulum model (Figure 2b) was developed to represent the seated balance test apparatus (Figure 2a) (Tanaka, 2008). It included a concentrated body mass (m) and a massless segment length (h). Stabilizing springs with a spring constant k are located a distance d from the pivot point. Task difficulty is increased by reducing the distance of the springs from the central pivot point. The model also included a limited gain proportional-derivative controller to simulate neuromuscular control,
| (1) |
where, Gd is the derivative gain constant, θcr = Tpmax/Gp is the smallest angle at which the maximum gain is achieved, Gp is the proportional gain constant, and Tpmax is the maximum value of proportional torque. Physiologically, Tpmax represents the fact that muscle strength is limited. The final component of the model was system noise, which occurs naturally and may result from disturbances induced by breathing, heartbeat, muscle twitches, inaccurate muscle recruitment or other underlying stochastic processes (Collins and De Luca, 1993; Delignieres, Deschamps et al., 2003; Bottaro, Casadio et al., 2005). These random disturbances were modeled as perturbation energy, E (0.1 J). Lagrange's equation was used to determine the equation of motion for the inverted pendulum, mh2 θ̈ − mgh sinθ = τ, where, θ, θ̈, and g are the rotation angle, angular acceleration, and acceleration of gravity, respectively. The parameter τ represents the combined torques resulting from the springs, controller, and perturbation energy. Combining these components yields the governing differential equation:
| (2) |
where, θ̇ is the angular velocity. Gravity, springs, and the proportional component of the controller all contribute to the potential energy of the system. These components can be combined to generate an effective potential energy function, Veff, by integrating the terms with respect to θ yielding,
| (3) |
Using model parameters for a typical adult male (Table 1), a mathematical model of the potential function was developed using MATLAB® software (MathWorks; Natick, MA).
Table 1.
Model Parameters
| parameter | value | Description |
|---|---|---|
| m | 69 kg | Typical body mass |
| g | 9.81 m/s2 | Acceleration of gravity |
| h | 43 cm | Calculated from ∇G |
| k | 10,900 N/m | Wobble chair springs |
| d | 10.35 cm | Half force plate width |
| Gd | 1 Nm/(rad/s) | Derivative gain |
| Gp | 190 Nm/rad | Proportional gain |
| Tpmax | 14.5 Nm | Max proportional gain |
| E | 0.1 J | Perturbation Energy |
2.3 Participants and Experimental Protocol
Eight adults from the university and surrounding area participated in the study (five male and three female). Mean (SD) body mass, stature, and age were 71(13) kg, 174(15) cm, and 27(5) years, respectively. All participants were asymptomatic for LBP at the time of testing and reported no history of spinal surgery or back disorders. Prior to beginning the tests described below, participants completed an informed consent procedure approved by the Institutional Review Board at Virginia Tech.
Before stability testing was performed, the gravitational gradient (∇G) for each subject was found using previously developed methods (Tanaka and Granata, 2007; Lee and Granata, 2008; Slota, Granata et al., 2008). Briefly, ∇G is a measure of the mass and weight distribution of an individual given by,
| (4) |
where M̅g is the gravitational moment, and θ̅S and θ̅T are the 2-D (sagittal plane) angles of the seat and torso, respectively. Neutral stability is achieved when moments generated by the springs equilibrate the gravitational gradient (i.e. a spring setting of 100%∇G).
During experimental trials, participants were instructed to sit on the wobble chair with arms crossed in front of the body while attempting to maintain an upright balanced posture for 60 seconds. Five practice trials were performed in order to reduce learning effects (Lee and Granata, 2008). Trials were performed in each visual feedback condition (eyes open or closed); the order of visual feedback condition was balanced across participants. A rest period of at least one minute was provided between trials to avoid mental and physical fatigue. Sensors (MTx, Xsens Technologies; Enschede, The Netherlands) attached to the base of the seat and on the dorsal aspect of the thorax (T5 level) were used to measure (at 100 Hz) the respective angles. Participants were visually monitored to determine if the seat made contact with the base, where such contact indicated instability and a ‘failing’ trial.
Testing began with respective initial spring settings of 80% and 100% ∇G in the AP and ML directions. Following each trial, the AP spring distance was adjusted. Initially, if the participant maintained stability within 4° of the center, the spring setting was reduced by 20% ∇G. If the participant was able to maintain stability, but not within 4° of the center, the spring setting was reduced by 10% ∇G. If the participant became unstable as indicated by making base contact (failed) the spring setting was increased by 5% ∇G. This method quickly adjusted the task difficulty to the approximate threshold value. The first failed trial was used as an indicator that an approximate value of the ToS was found. Subsequent passing (failing) trials reduced (increased) the spring setting by 5% ∇G. This method was designed to concentrate data collection around the threshold of stability.
2.4 Analysis
Threshold of stability was determined through evaluation of the test results at each spring setting (Figure 3). The number of passing and failing trials at each spring setting was tallied. When both passing and failing trials existed at a given spring setting, the majority result was assigned to that spring setting. If upon completing eight trials a clear separation existed between passing and failing spring settings, testing was concluded. However, if the number of passing and failing trials was equal at a given level, additional trials were performed until a definitive outcome was obtained.
Figure 3.

Determining the threshold of stability (ToS). Multiple trials were conducted for each participant at different spring settings. Typical results for a participant are shown. The ToS was found by locating the lowest passing spring setting. In this case, the ToS was 45% ∇G for eyes open and 65% ∇G for eyes closed.
For purposes of comparison with the ToS, the maximum Lyapunov exponent (λmax) was determined; λmax is a measure of local stability that quantifies the mean rate of divergence with respect to an equilibrium state (Wolf, Swift et al., 1985; Rosenstein, Collins et al., 1993). Well established methods were used to generate the state vector, filter data, and calculate λmax (England and Granata, 2007; Tanaka and Granata, 2007; Lee and Granata, 2008; Tanaka, 2008).
Paired t-tests were used to assess the sensitivity of both the ToS and λmax to the manipulation of visual feedback. Since λmax was determined at the ToS, which varied between subjects and visual conditions, an additional analysis of covariance (ANCOVA) was performed (with ToS and visual condition as independent variables). A value of p< 0.05 was used as the criterion for significance.
3. Results
3.1 Model Results
The effective potential function (Veff) had a basin of stability between ±5.72 degrees at a task difficulty of 50%∇G (Figure 4). System states within this region were attracted toward the vertical equilibrium position as a result of the stabilizing springs and the controller. Beyond the basin of stability, trajectories were drawn away from the vertical position due to the dominating gravitational gradient (and were thus unstable).
Figure 4.

Components of the effective potential function. Components that contribute to the effective potential function (solid line) include the gravitational gradient (dashed line), the stabilizing springs (dotted line) and the proportional component of the control (dot-dash line). System states within the basin of stability (±5.72 degrees) may be able to escape given sufficiently large perturbation energy (E). For an arbitrary E = 0.1 J, KV remained within ±3.86 degrees. At this level of E, the system was stable since KV did not exceed the boundary of the basin of stability. However, if E exceeds the maximum value of the effective potential function (0.170 J) for this task difficulty (50%∇G), it is possible to achieve system states outside the basin of stability. Over time, this system may exhibit unstable behavior.
In order to develop an understanding of the effects of task difficulty on system behavior, Veff was determined for various levels of difficulty (Figure 5). Increasing task difficulty increased KV and decreased the basin of stability. The intersection of the curves (44.7%∇G, 5.16°) separates stable from unstable system behavior (E=0.1J). Increasing perturbation energy moves the transition point separating stable and unstable behavior to the right.
Figure 5.

Sensitivity of the effective potential function to spring setting. The Veff indicated that for the four most difficult spring settings (0-30% ∇G) were globally unstable, with a local maximum existing exclusively at the vertical equilibrium point (0,0). At a spring setting of 35%∇G, a basin of stability (circles) formed around the vertical equilibrium position (±4.40°). The system displayed low robustness to small perturbations could induce instability. For E = 0.1 J (dashed line), the energy exceeded the maximum energy of the effective potential function (0.003 J). Thus, KV was not bounded by the potential function and could become large. When the task difficulty was decreased to 50%∇G, the system became more robust, with the peak of Veff increasing to 0.170 J. At this task difficulty, E was less than the peak value of Veff and perturbations lacked sufficient energy to escape the potential function. Thus, KV was contained within the basin of stability and the system was stable.
The effects of task difficulty on KV and the size of the basin of stability are shown in Figure 6. In particular, the size of the basin of stability decreased with increasing task difficulty, consistent with the original premise. Furthermore, KV increased with increased task difficulty as predicted. As expected, reducing perturbation energy decreased KV, but had no impact on the basin of stability size.
Figure 6.

Sensitivity of the ToS to changes in perturbation energy and stability regions. Three distinct regions were observed. First, a globally unstable region was present as spring settings below 34.7%∇G where no basin of stability existed. The ToS occurred at the intersection (44.7%∇G, 5.16°) of the KV (dashed line) and the basin of stability (solid line) curves. Second, a stable region was present for spring settings greater than the ToS (44.7%∇G) where KV was within the boundary of the basin of stability. In the third region (between 34.7 and 44.7%∇G) it was possible for the system to exhibit both stable and unstable behavior. Yet, over time the system will become unstable, since the range of KV exceeds the boundary of the basin of stability. For this system KV increased sharply indicating little stable behavior in this region and quickly transitions from stable to unstable behavior at the ToS.
Different people will have varying factors that influence the capability of the control system. One of these factors is muscle strength, which may be modeled by modifying the Gp and Tpmax (Figure 7). Reducing Gp and Tpmax values decreased the boundary of the basin of stability and increases kinematic variability. Indeed, these two factors had a net effect of increasing the ToS.
Figure 7.

Sensitivity of the ToS to simulated changes in muscle strength. Reduced muscle strength may be modeled as a decrease in Gp and Tpmax. At the modeled value of Gp and Tpmax, the ToS was 44.7%∇G as indicated by the intersection of the KV (bold dashed line) and the basin of stability (solid line) curves labeled 100%. Decreasing Gp and Tpmax to 80% of their original values resulted in an increase in the ToS to 57.4%∇G. A similar trend was observed for 60% (ToS = 69.9%∇G) and 120% (ToS =31.9%∇G) muscle strength.
3.2 Experimental Results
For the ToS (Figure 8), mean (SD) values for eyes open and closed were 36 (6.4) and 51 (7.4) %∇G, respectively. This difference of ∼15% was significant (t=11.2; p=.0001). In contrast, the effect of visual condition on λmax was not significant (t=0.786; p=0.46), and mean values for eyes open and closed were 0.40 (0.18) and 0.47 (0.20), respectively. The effect of visual feedback condition on λmax was similarly non-significant (p=0.71) in the covariate analysis.
Figure 8.

Effects of visual feedback (eyes open vs. closed) on the threshold of stability (left) and maximum Lyapunov exponent (right). Values are means (SD), and the symbol * indicates a significant effect of visual feedback.
4. Discussion
In this study the threshold of stability (ToS) was developed and evaluated as an indicator for spinal stability. The theoretical analysis verified the premise that KV increases and the size of the basin of stability decreases with increasing task difficulty. Experimentally, the ToS was shown to be sensitive to differences in visual acuity, a factor known to influence postural stability. Hence, support for the ToS method was provided both theoretically and experimentally.
To understand why KV increases with increasing task difficulty, consider the source of perturbation energy. Naturally occurring perturbations resulting from a variety of natural random processes are expected to be independent of task difficulty. By examining Veff at a set value of E, KV was observed to increase as the spring stiffness decreased. This increase in KV was caused by a decrease in the gradient (slope) of Veff. KV continued to increase gradually until the ToS was reached, and further increases in task difficulty lowered the magnitude of Veff below E. As a result, the system became unstable which greatly increased KV.
Our finding that KV increases with task difficulty is consistent with previous studies of standing postural sway that showed the area (Vuillerme, Pinsault et al., 2005), sway range, and variability (Teasdale, Stelmach et al., 1991) of the center of pressure (COP) to increase when standing on a compliant surface, typically a foam pad. It may be argued that standing on a foam pad increases KV due to decreased proprioceptive feedback rather than increased task difficulty. Granted, the foam pad decreases local pressures and may reduce proprioception. However, the compliance of the pad also acts as a spring between the controlling force applied by the foot and the reaction support which effectively increases task difficulty. Indeed, similar results were observed when standing on a thin wooden plate over a foam pad (Cornilleau-Peres, Shabana et al., 2005). In this example, the plate effectively restored proprioception yet maintained the increased task difficulty caused by reduced coupling between the control and support.
The basin of stability is defined as a stable region in state space where trajectories will remain in the neighborhood over time. Unlike globally stable systems that attract trajectories regardless of their position or velocity, systems with a basin of stability only retain trajectories within the boundaries of the basin (i.e. a limited range of positions and velocities, a.k.a. states). The mathematical model showed that higher task difficulty (lower gradient of Veff) resulted in a smaller basin of stability size. A transition between stable and unstable behavior occurs when the stabilizing contributions equal the destabilizing contributions. This transition forms the boundary of the basin of stability. As the spring stiffness decreased, its stabilizing contribution to Veff also decreased reducing its contribution to Veff at any given angle, θ. This reduction in stabilizing contributions reduced the angle where this transition occurred effectively reducing the size of the basin of stability.
The experimental results presented herein showed the basin of stability size to decreases with increasing task difficulty. This outcome is consistent with a previous standing postural sway experiment where participants leaned forward to a maximum stable angle using only the ankle joint and rotated in a circular direction to experimentally define the stability boundary (Cornilleau-Peres, Shabana et al., 2005). Task difficulty was increased by performing the task while standing on a thin wooden plate covering a foam pad. Importantly, this experiment showed the basin of stability to decrease with task difficulty when evaluated in configuration space (position but not velocity).
Another aspect of our method that differentiates it from previous methods is the application of task difficulty as an independent variable. Altering task difficulty is inherently different because it actively changes the system (i.e., “plant” in control theory) to determine the performance on the controller. This difference may not be an overall improvement over previous methods, but its use may allow a difference to be detected that would otherwise be missed using traditional approaches.
Fundamentally, one of the strengths of the ToS is that it identifies a transition between two distinctly different types of behavior (i.e. stable and unstable). For the mathematical model evaluated herein, the transition is sharp, indicating that the method is relatively insensitive to variability. This sharp transition was also observed in the wobble chair experiments, but with less consistency. This inconsistency may be attributed to an increase in degrees of freedom of the actual system and an increased complexity of human neuromuscular control relative to the PD control used in the model. Nevertheless, despite these inconsistencies and a small sample size, we demonstrated that the ToS was sensitive to differences in the balance control system. In addition, ToS was also found to be more sensitive than Lyapunov stability which did not show significant differences.
One limitation of this study was the choice of mathematical model which consisted of a single inverted pendulum with stabilizing springs and PD control. A potentially more accurate model would consist of a double inverted pendulum with segments representing the lower and upper body and a pin joint at the lumbar spine. This type of model would more closely represent the actual experimental configuration but at the expense of increasing model complexity. Since the purpose of our model was to illustrate a theoretical concept, the authors felt the less complex model would effectively fulfill the purpose.
Ultimately, the ToS may be useful in the future as a diagnostic tool in a clinical setting. Specifically, ToS could be used to indicate patients who have low back pain because of instability allowing appropriate treatments to be prescribed. Although electronics were used in this study to determine the Lyapunov exponents, they were not needed to find the threshold of stability. Furthermore, the ∇G for each participant could be approximated using anthropometric parameters. Thus, the simplicity, sensitivity, and low cost of this method may make it suitable for evaluating spinal stability of LBP patients in a clinical practice.
Overall, a new method, ToS, was developed for evaluating spinal stability. This new method was theoretically and experimentally evaluated. Results indicated that the method has a sound theoretical foundation and is sensitive to differences using a small number of samples. Future applications for the ToS method might include its use as a diagnostic tool for evaluating spinal stability associated with LBP.
Acknowledgments
Support for this work was provided by Cooperative Agreement Number R01 OH 008504 (to Dr. Kevin Granata and MAN) from the CDC-NIOSH, grant R21 HD046628-01A2 from NCMRR - NICHD (to Dr. Deborah Givens), and from the Kevin P. Granata Occupational Safety and Health Pilot Research Program of Virginia Tech's Center for Innovation in Construction Safety and Health (to SDR). Its contents are solely the responsibility of the authors and do not necessarily represent the official views of the sponsor. The authors would also like to express their sincere gratitude to Dr. Kevin P. Granata for his contributions and guidance during the early portions of this research.
Footnotes
Conflict of Interest The authors declare that there are no conflicts of interest associated with this research.
Publisher's Disclaimer: This is a PDF file of an unedited manuscript that has been accepted for publication. As a service to our customers we are providing this early version of the manuscript. The manuscript will undergo copyediting, typesetting, and review of the resulting proof before it is published in its final citable form. Please note that during the production process errors may be discovered which could affect the content, and all legal disclaimers that apply to the journal pertain.
References
- Blaszczyk JW. Sway ratio - a new measure for quantifying postural stability. Acta Neurobiol Exp (Wars) 2008;68(1):51–7. doi: 10.55782/ane-2008-1672. [DOI] [PubMed] [Google Scholar]
- Bottaro A, Casadio M, Morasso PG, Sanguineti V. Body sway during quiet standing: is it the residual chattering of an intermittent stabilization process? Hum Mov Sci. 2005;24(4):588–615. doi: 10.1016/j.humov.2005.07.006. [DOI] [PubMed] [Google Scholar]
- Cholewicki J, Polzhofer GK, Radebold A. Postural control of trunk during unstable sitting. J Biomech. 2000;33(12):1733–7. doi: 10.1016/s0021-9290(00)00126-3. [DOI] [PubMed] [Google Scholar]
- Collins JJ, De Luca CJ. Open-loop and closed-loop control of posture: a random-walk analysis of center-of-pressure trajectories. Exp Brain Res. 1993;95(2):308–18. doi: 10.1007/BF00229788. [DOI] [PubMed] [Google Scholar]
- Cornilleau-Peres V, Shabana N, Droulez J, Goh JC, Lee GS, Chew PT. Measurement of the visual contribution to postural steadiness from the COP movement: methodology and reliability. Gait Posture. 2005;22(2):96–106. doi: 10.1016/j.gaitpost.2004.07.009. [DOI] [PubMed] [Google Scholar]
- Delignieres D, Deschamps T, Legros A, Caillou N. A methodological note on nonlinear time series analysis: is the open- and closed-loop model of Collins and De Luca (1993) a statistical artifact? J Mot Behav. 2003;35(1):86–97. doi: 10.1080/00222890309602124. [DOI] [PubMed] [Google Scholar]
- Dieën JHV, Cholewicki J, Radebold A. Trunk muscle recruitment patterns in patients with low back pain enhance the stability of the lumbar spine. Spine. 2003;28(8):834–41. [PubMed] [Google Scholar]
- Dingwell JB, Cusumano JP, Sternad D, Cavanagh PR. Slower speeds in patients with diabetic neuropathy lead to improved local dynamic stability of continuous overground walking. J Biomech. 2000;33(10):1269–77. doi: 10.1016/s0021-9290(00)00092-0. [DOI] [PubMed] [Google Scholar]
- England SA, Granata KP. The influence of gait speed on local dynamic stability of walking. Gait Posture. 2007;25(2):172–8. doi: 10.1016/j.gaitpost.2006.03.003. [DOI] [PMC free article] [PubMed] [Google Scholar]
- Fernie GR, Gryfe CI, Holliday PJ, Llewellyn A. The relationship of postural sway in standing to the incidence of falls in geriatric subjects. Age Ageing. 1982;11(1):11–6. doi: 10.1093/ageing/11.1.11. [DOI] [PubMed] [Google Scholar]
- Granata KP, Slota GP, Wilson SE. Influence of fatigue in neuromuscular control of spinal stability. Hum Factors. 2004;46(1):81–91. doi: 10.1518/hfes.46.1.81.30391. [DOI] [PMC free article] [PubMed] [Google Scholar]
- Herdman S, editor. Vestibular Rehabilitation Contemporary perspectives in rehabilitation. Philadelphia: F.A. Davis; 2007. [Google Scholar]
- Hsiao-Wecksler ET, Katdare K, Matson J, Liu W, Lipsitz LA, Collins JJ. Predicting the dynamic postural control response from quiet-stance behavior in elderly adults. J Biomech. 2003;36(9):1327–33. doi: 10.1016/s0021-9290(03)00153-2. [DOI] [PubMed] [Google Scholar]
- Jacobson G, Newman C, Kartush J, editors. Handbook of balance function testing. St. Louis: Mosby Year Book; 1993. [Google Scholar]
- Lee H, Granata KP. Process stationarity and reliability of trunk postural stability. Clin Biomech (Bristol, Avon) 2008;23(6):735–42. doi: 10.1016/j.clinbiomech.2008.01.008. [DOI] [PMC free article] [PubMed] [Google Scholar]
- Lee H, Granata KP, Madigan ML. Effects of trunk exertion force and direction on postural control of the trunk during unstable sitting. Clin Biomech (Bristol, Avon) 2008;23(5):505–9. doi: 10.1016/j.clinbiomech.2008.01.003. [DOI] [PubMed] [Google Scholar]
- Overstall PW, Exton-Smith AN, Imms FJ, Johnson AL. Falls in the elderly related to postural imbalance. Br Med J. 1977;1(6056):261–4. doi: 10.1136/bmj.1.6056.261. [DOI] [PMC free article] [PubMed] [Google Scholar]
- Panjabi MM. Clinical spinal instability and low back pain. Journal of Electromyography and Kinesiology. 2003;13(4):371–379. doi: 10.1016/s1050-6411(03)00044-0. [DOI] [PubMed] [Google Scholar]
- Prieto TE, Myklebust JB, Hoffmann RG, Lovett EG, Myklebust BM. Measures of postural steadiness: differences between healthy young and elderly adults. IEEE Trans Biomed Eng. 1996;43(9):956–66. doi: 10.1109/10.532130. [DOI] [PubMed] [Google Scholar]
- Reeves NP, Narendra KS, Cholewicki J. Spine stability: the six blind men and the elephant. Clin Biomech (Bristol, Avon) 2007;22(3):266–74. doi: 10.1016/j.clinbiomech.2006.11.011. [DOI] [PMC free article] [PubMed] [Google Scholar]
- Roerdink M, De Haart M, Daffertshofer A, Donker SF, Geurts AC, Beek PJ. Dynamical structure of center-of-pressure trajectories in patients recovering from stroke. Exp Brain Res. 2006;174(2):256–69. doi: 10.1007/s00221-006-0441-7. [DOI] [PubMed] [Google Scholar]
- Rosenstein MT, Collins JJ, Deluca CJ. A Practical Method for Calculating Largest Lyapunov Exponents from Small Data Sets. Physica D. 1993;65(12):117–134. [Google Scholar]
- Slota GP, Granata KP, Madigan ML. Effects of seated whole-body vibration on postural control of the trunk during unstable seated balance. Clin Biomech (Bristol, Avon) 2008;23(4):381–6. doi: 10.1016/j.clinbiomech.2007.11.006. [DOI] [PubMed] [Google Scholar]
- Tanaka M. Biodynamic Analysis of Human Torso Stability using Finite Time Lyapunov Exponents. Virginia Tech - Wake Forest University School of Biomedical Engineering. Virginia Polytechnic Institute and State University (Virginia Tech); Blacksburg: 2008. Ph.D. [Google Scholar]
- Tanaka ML, Granata KP. Methods & Nonlinear Analysis for Measuring Torso Stability. ASCE 18th Engineering Mechanics Division Conference; Blacksburg, VA. 2007. [Google Scholar]
- Teasdale N, Stelmach GE, Breunig A. Postural sway characteristics of the elderly under normal and altered visual and support surface conditions. J Gerontol. 1991;46(6):B238–44. doi: 10.1093/geronj/46.6.b238. [DOI] [PubMed] [Google Scholar]
- Vuillerme N, Pinsault N, Vaillant J. Postural control during quiet standing following cervical muscular fatigue: effects of changes in sensory inputs. Neurosci Lett. 2005;378(3):135–9. doi: 10.1016/j.neulet.2004.12.024. [DOI] [PubMed] [Google Scholar]
- Wolf A, Swift JB, Swinney HL, Vastano JA. Determining Lyapunov exponents from a time series. Physica D: Nonlinear Phenomena. 1985;16(3):285–317. [Google Scholar]