Abstract
Nonlinear dynamics has been introduced to the analysis of biological data and increasingly recognized to be functionally relevant. The purpose of this study was to examine chaotic properties of human scalp EEG signals associated with voluntary motor tasks using the largest Lyapunov exponent (L1). 64-channel scalp EEG data were recorded from eight healthy subjects in two tasks: (1) Intermittent handgrip contractions at 20, 40, 60, and 80% of maximal voluntary contraction (MVC) with 20 trials at each level. No significant fatigue were induced; (2) intermittent handgrip MVCs (100 trials) that resulted in significant fatigue. The L1 values of all EEG channels were calculated in each trial first then averaged across the 20 trials at each force level (Task 1) or over each of the 5-trial blocks (Task 2) before the group means were obtained. A multivariate statistical model was used to examine the effect of force and fatigue on L1. L1 values were greater with higher force (Task 1), and decreased significantly with fatigue (Task 2). The L1 of the EEG signals changes systematically and correlates significantly with muscle force and fatigue. The results suggest that nonlinear chaotic index L1 may serve as a quantitative measure for motor control-related cortical signal adaptations.
Keywords: Chaos, Neuromuscular, Lyapunov exponent
1. INTRODUCTION
The tools of nonlinear analysis have been greatly improved recently in the study of the time series signals from nonlinear biological and physical systems, such as the signals pertaining to electroencephalography (EEG), magnetoencephalography (MEG) and electrocardiography (ECG) (Freeman, 2003; Kotini and Anninos, 2002; Perkiomaki et al., 2005). Many studies are known that the nonlinear time series analysis have been applied to EEG signals of animals (Gonzalez et al., 1999; Sarnthein et al., 1998) or humans, such as recording from normal awake subjects (Palus, 1996; Stam et al., 1999), during sleep (Pereda et al., 1998; Roschke and Aldenhoff, 1992), or from patients with diseases like epilepsy, Parkinson's Disease, Alzheimer's Disease and schizophrenics (Jeong et al., 1998a; Lai et al., 2004; Sabesan et al., 2003; Stam et al., 1996; Stam et al., 1994).
Nonlinearity is present in many dynamical systems in nature. For a neuronal network such as the brain, it is known that there are billions of neurons, each interacting with a large number of other neurons via synapses. The common, yet complex daily processes such as motivating, movement, thinking, and remembering are based on neurons exhibiting complex interactions. The hypothesis of an entirely stochastic brain cannot be true because we know our brain has the ability to perform the aforementioned sophisticated tasks (Andrzejak et al., 2001). It was demonstrated that neuronal systems such as periodically stimulated molluscan neurons (Holden et al., 1982), squid giant axons (Aihara and Matsumoto, 1986) or the olfactory bulb of rabbits (Freeman, 1987), exhibit a variety of nonlinear behavior. EEG, as one of the measures of brain activity taking place at higher hierarchic levels of the central nervous system, appears to be an appropriate area for nonlinear time series analysis techniques (Kantz and Schreiber, 1997).
In the field of motor control, how the brain signals change when the muscle fatigues during a motor task such as a prolonged handgrip is a relatively unknown question with significant clinical relevance. Recent findings have shown that fatigue induced by repetitive maximal voluntary contractions (MVCs) results in progressive declines in muscle force and electromyographic (EMG) signals. Earlier research has suggested that muscular mechanisms are responsible for the loss of force (Bigland-Ritchie, 1981). More recent findings, however, point to the possibility that the central nervous system also becomes fatigued and may fail to fully activate the performing muscles (Gandevia, 2001; Liu et al., 2005c). A few studies have applied linear analysis to EEG signals, such as movement-related cortical potential (MRCP) measurements (Bates, 1951; Siemionow et al., 2000) and power spectra or coherence analyses (Liu et al., 2005c; Rosenberg et al., 1989) during motor tasks of varying muscle force or fatigue levels. However, these types of analysis could not explore the full information from the EEG signal due to the complexity and nonlinearity of such signal. Therefore, it is expected that a nonlinear time series analysis may provide us with new tools to study brain function with EEG signals. A previous study (Liu et al., 2005a) showed that fractal dimensions (FDs) of scalp EEG signals increased linearly with handgrip force, suggesting that under normal conditions the FD measure relates proportionally to brain signals that control muscle force. In this study, we attempted to use another important nonlinear quantity, the largest Lyapunov exponent (L1), to quantify scalp EEG signals at different fatigue states and handgrip force levels. Basically, the largest Lyapunov exponent L1 estimates the mean exponential divergence or convergence of nearby trajectories in phase space, expressing the well-known sensitive dependence to initial conditions in nonlinear phenomenon (Kantz and Schreiber, 1997; Wolf et al., 1985). Hence, the L1 may serve as a good estimate of the chaoticity of a dynamical system.
The purpose of the present study was to quantify, using L1, the chaoticity of scalp EEG signals at different muscle force and fatigue levels in a handgrip motor task and determine the relationship between L1 and the force and between L1 and fatigue. We hypothesized that L1 value of the EEG signals would be different at different handgrip force levels and it would also change with muscle fatigue.
2. RESULTS
Fig. 4 shows average force data of eight subjects as a function of trial block (time) during the fatigue experiment. The initial blocks were associated with minimal fatigue. The fatigue effects became more obvious in the later blocks. The results show that the force amplitude dropped dramatically from the beginning (95.9% MVC at block 1) to the time of block 7 (55.7% MVC). From block 7, the force reached a relatively steady stage and remained in the range of 50% − 55% MVC for the rest of trial blocks. This figure clearly shows how fatigue affects force output of the handgrip muscles.
Fig. 4.
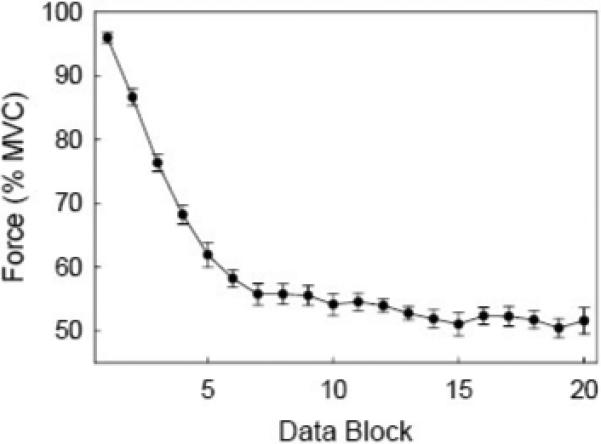
A grand average of relative (%MVC) handgrip force (over 8 subjects) on each trial block (totally 20 blocks) in the fatigue experiment. Each block is an average of 5 consecutive trials. The error bar indicates standard error.
L1 maps based on the values of 63 electrodes on the scalp during the active period for the four force level experiment are shown in Fig. 5. Each map shows average L1 data of 20 trials of the 8 subjects at the corresponding force level. At the 20% and 40% levels, the L1 values were small for most of the EEG channels with no significant difference in L1 between the two force levels. At the 60% and 80% MVC levels, the L1 values were significantly higher compared to the two lower force levels or rest. For more detail analysis, we selected five electrodes overlying major sensorimotor regions. The five electrodes were C3 (contralateral) C4 (ipsilateral) over the primary sensorimotor regions; Cz, over the supplementary motor area; Fz, over the central frontal area; and Pz, over the central parietal field. Fig. 6a shows group L1 data of the five selected major EEG channels during the active period at the four force levels. The two-way ANOVA analysis revealed significant increases in L1 with elevation of the force (P < 0.001). However, the L1 values among the five EEG channels showed no significant difference (P = 0.503). Subsequent multiple comparisons showed that the L1 at 80% MVC was significantly higher (P < 0.01) than those at the 20%, 40% and 60% MVC levels. These results are indicated in the figure. For example, “(20 : 80)” means that the L1 value at the 20% level is significantly different from that at the 80% level. Pearson's correlation indicated a significant association between the L1 and handgrip force in four of the five electrodes. The L1 results for the rest period corresponding to each force level are shown in Fig. 6b. No significant L1 changes were found among force levels (P = 0.772) or EEG channels (P = 0.815). Paired t-tests showed that the L1 values were significantly different between the active and rest periods (P < 0.01).
Fig. 5.
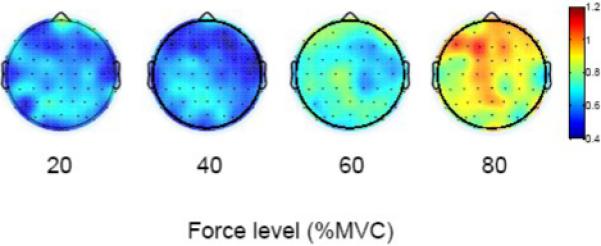
Average L1 maps (based on 8 subjects) corresponding to the active period of the force record in the force-level experiment. Colors indicate values of L1 with red = high L1 and blue = low L1. Each map (at each force level) is an average of 20 trials across all the subjects. In each brain map, the nose is represented by the triangle on the top and left hemisphere is on the left.
Fig. 6.
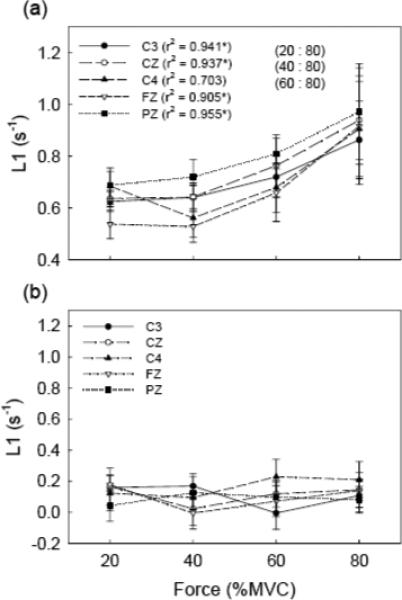
Grand average (over 8 subjects) of L1 results of the force level experiment. The L1 values from five major EEG channels at four different force levels (20%, 40%, 60%, and 80% of MVC) are shown. (a) The L1 results in the active period, and (b) the L1 results in the rest period. “*” in (a) indicates significant (P < 0.05) correlation coefficient between L1 and force level. Significant comparisons between L1 values of force levels are marked on the figure. For example, “(20 : 40)” means that the L1 value at 20% level is significantly different with that at 40% level, etc. The difference in L1 values between active and rest periods is significant detected by paired t-test (P < 0.01). No significant differences were observed in the correlation and L1 amplitude within the data set of the rest period.
Maps of L1 values based on all the EEG channels during the active period of the fatigue experiment in all the subjects are shown in Fig. 7. It is obvious that L1 values were higher under minimal and moderate fatigue conditions (compare blocks 1 and 2 to other blocks) than those under severe fatigue conditions. Furthermore, higher L1 were seen in the frontal lobe and contralateral (left) hemisphere (referenced to the exercising arm). It is also worth noting that the L1 became relatively stable as the force dropped to a relatively steady level (compare Figs. 4 and 7). More detailed results of the five selected EEG channels (C3, CZ, C4, FZ and PZ) are presented in Fig. 8. During the active period of the contraction (−0.75 to 3 s) in the first two blocks when the fatigue was minimal and force was still high, the L1 values of all the five channels were also high. However, the values decreased rapidly after block 2 and reached a steady L1 level at block 5 and thereafter, similar to the force curve in Fig. 4. The two-way ANOVA revealed significant differences in L1 among blocks (P < 0.001), but not among EEG channels (P = 0.084). Post hoc comparisons showed no significant difference between block 1 and block 2 (P = 0.626). L1 values of block 1 to block 4 are significantly greater than those in the following blocks (P < 0.005 for block 1 with other blocks and P < 0.05 for block 2, 3, and 4 with other blocks). The significant pair-wise comparisons between blocks are marked on the figure. For example, “(4 : 6, 8, 10−16)” means L1 in block 4 is significantly greater than that in blocks 6, 8 and blocks 10 to 16. Pearson correlation analysis showed a strong relationship between L1 and force for the fatigue experiment (Fig. 8a). The correlation coefficients were all above 0.8 and the correlations are all significant. For the control data (L1 calculated during rest period), no significant L1 differences among blocks and EEG channels were found and no significant correlation between the L1 and force was detected (Fig. 8b). Paired t-tests showed that the L1 values were significantly greater in the active than rest periods (P < 0.001).
Fig. 7.
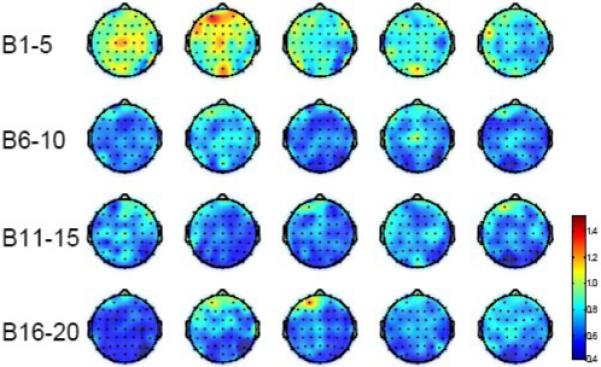
Average L1 maps (based on 8 subjects) over the active period of the force record in the fatigue experiment. Colors indicate values of L1 with red = highest L1 and blue = lowest L1. Each block is an average of L1 values over 5 consecutive trials followed by a grand average over all subjects. Block 1 represents the lowest fatigue level and block 20 the highest. In each brain map, nose is represented by the triangle on the top and left hemisphere is on the left.
Fig. 8.
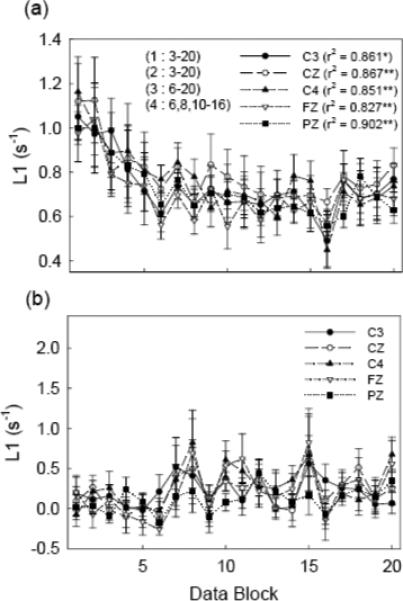
Grand average (over 8 subjects) of L1 results for the fatigue experiment. The L1 values from five major EEG channels (C3, CZ, C4, FZ, and PZ), which are denoted in different symbols, are drawn for all 20 blocks of the data. Error bars indicate standard errors. (a) The L1 results in the active period. The correlation coefficients with force were denoted at the corresponding EEG channels. “*” indicates P < 0.05 and “**” P < 0.01. The significance of comparisons (P < 0.05) between L1 values of trial blocks is marked on the figure. For example, “(4 : 6, 8, 10−16)” means L1 of block 4 is significantly different from that of block 6, block 8 and blocks 10 to 16, etc. (b) The L1 results in the rest period. The L1 values in the active period are significant different (P < 0.01) from those of the rest period detected paired t-test. No significant differences were observed in the correlation and L1 amplitude within the data set of the rest period.
3. DISCUSSION
In this study, we attempted to reveal the relationship between nonlinear properties of human scalp EEG signals and levels of muscle force and fatigue. We found that the largest Lyapunov exponent (L1) was significantly related to muscle force, regardless of whether fatigue being involved in the motor performance.
As an important index of chaos, the Lyapunov exponent estimates the mean exponential divergence or convergence of nearby trajectories of the attractor. A system with at least one positive Lyapunov exponent is chaotic, reflecting sensitive dependence on the initial conditions (Roschke et al., 1993). This suggests that L1 values can be regarded as a measurement of complexity or flexibility of a dynamic system (Aftanas et al., 1997; Jeong et al., 1998b; Jin et al., 2002; Roschke et al., 1995). In the neuron network, the number of neurons that were recruited into an action and their discharging behavior are the major factors that contribute to the complexity (Lutzenberger et al., 1995). Compared to the rest condition, a larger number of cortical neurons, especially in the motor function-related areas, are thought to participate in controlling a motor task. Similarly, compared to the low-force condition, more neurons are expected to participate in controlling greater force with higher discharge rates (Cadoret and Smith, 1997; Thickbroom et al., 1999), adding complexity to the signal, and correspondingly, increasing the L1 values. Moreover, the sensory feedback from the muscle to the brain may further increase complexity of the signal, and thus, resulting in an even larger L1 value.
The larger L1 values at higher force levels may suggest that the brain recruits more neurons and increases the firing rates of those neurons in a linear relationship with force. A number of former studies show that force is linearly related to the level of brain activation. For instance, the linear increase of brain activation level due to the increase of force was shown in functional magnetic resonance imaging (fMRI) and positron emission tomography (PET) data, which represent the brain task-related responses in blood metabolism (Kinoshita et al., 2000; Thickbroom et al., 1998). EEG data also showed that both the cortical potential and power of the signal are linearly correlated with force (Nishihira et al., 1989; Siemionow et al., 2000). Studies on monkeys revealed that the neuron firing rate is proportional to the level of exerted force by the animals (Maier et al., 1993; Smith et al., 1975). Our previous study (Liu et al., 2005a) also showed that the fractal dimension (FD) of EEG signals had a linear correlation with handgrip force. All these results suggest that the number of involved neurons and perhaps their level of activity increase in proportion to the force exerted under normal conditions.
Besides complexity, enhanced L1 values also reflect the increased flexibility of information processing. Here, the flexibility may be understood as the facility of the central nervous system to reach different states of information processing from similar initial states (Roschke et al., 1995). In the fatigue experiment, the decrease in L1 values with muscle fatigue suggests that the brain's ability to do this (100% handgrip MVC) and other similar tasks weaken. The “weakening” of the brain by fatigue may be supported by our recently finding that showed a significant reduction in the power of the EEG frequencies (11−35 Hz) as a result of fatigue induced by repetitive handgrip MVCs (Liu et al., 2005b). Many studies reported correlations of L1 values with information processing flexibility of the brain under functional or clinical conditions. For example, the decreased L1 values were found in Alzheimer's disease patients (Jeong et al., 1998b), or after sound and light stimulation in healthy subjects (Jin et al., 2002). The L1 values were also shown as an enhancement in response to affective induction (Aftanas et al., 1997).
Similar L1 change patterns were found among the five EEG recording locations for the force-level and fatigue experiments. This observation suggests that different regions of the brain work synchronously to accomplish the same task (Konig and Engel, 1995), assuming that signals of each electrode originated from an independent cortical field. It is well-known that electrodes C3, Cz and Fz are positioned over cortical areas closely related to motor control. Moreover, it has been found that the parietal cortex is also important in control of hand function (Murata et al., 2000; Sakata et al., 1997). Therefore, it is understandable that similar L1 changes were seen at C3, Cz, Fz and Pz locations during our handgrip experiments. The L1 from channel C4 also followed a similar pattern of correlation with force and fatigue compared to the other 4 channels, suggesting that the ipsilateral (right hemisphere) primary sensorimotor cortex was also involved in the task modulation. Such a phenomenon of ipsilateral involvement has been noticed in many other studies (Crone et al., 1998; Dettmers et al., 1995; Ehrsson et al., 2000). The similarity in the L1 modulation under the fatigue and force-level conditions among different functional regions in the brain indicates that the primary sensorimotor cortices (C3 and C4) and higher-level secondary and association cortices (Fz, Pz and Cz) modulate a motor task in a coordinated manner.
Since the first algorithm for calculating the Lyapunov exponents from a time series data was introduced by Wolf et al. (1985), it has been used in many fields. Kantz et al. (1994) improved Wolf's algorithm independently and developed a practical method for calculating the largest Lyapunov exponent. This algorithm works well in presence of noise and for small data sets, and has been used in processing physiological data (Gonzalez et al., 1999; Lai et al., 2004). The analytical methods of nonlinear system theory offer new approaches to the analysis of EEG signals in addition to the conventional methods such as MRCP or spectral analysis. Compared with the conventional methods, nonlinear analysis reconstructs the signal into a phase space, and condenses the information into a single value, which reflects a property of the whole dynamic system. It is worth noting that numerical results of nonlinear measures like L1 depend on the choice of several input parameters, such as dimension and time lag. Therefore, the absolute values of L1 should be viewed with caution. A reasonable interpretation should be based on statistical assessment of L1 values. In our analysis, the data length, the choice of dimension m, time lagτ and minimum distance ε (see Methods) remained the same for all the trials within each experimental session of any individual subject. Our conclusion was based on the statistical evaluation of L1 changes, adding consistency and reliability to our analysis.
Special precautions to minimize noise during the experiments were taken in the data collection. The subjects were required to neither move their head and body nor to blink their eyes or bite down on their teeth when squeezing the handgrip device. They were also required to concentrate on the performance of the task during the experiment. They practiced before the experiment until they could perform the task as required. Furthermore, data with observable artifacts were eliminated at the post processing stage.
In summary, L1, as a measurement of complexity or flexibility of a dynamic system, is shown to be a useful chaotic index in analysis of EEG data. It serves as a relatively sensitive quantity for objective classification of fatigue stages of the brain and recognition of intensity of motor command to control various levels of muscle force without involvement of muscle fatigue. The nonlinear analysis (L1), especially combined with other tools such as MRCP or spectra analysis, provides a powerful method for revealing functional relevance of rather noisy brain signals, such as scalp EEG.
4. EXPERIMENTAL PROCEDURE
Experiment
Subjects and Motor Task
Eight right-handed healthy volunteers (6 men and 2 women, age = 30.1 ± 2.3 yrs) participated in the study. The experimental procedures were approved by the Institutional Review Board at the Cleveland Clinic Foundation. All volunteers signed an informed consent form prior to the participation.
The motor tasks involved handgrip contractions against a force measurement device using the right arm (see Data Recording below). Two motor tasks were performed in two different days. Task 1 consisted of intermittent handgrip contractions at 20%, 40%, 60%, and 80% of maximal voluntary contraction (MVC) force levels (the MVC was determined at the beginning of the experiment). An oscilloscope was placed facing the subject, the target force was displayed on its screen as a horizontal cursor. The subjects performed 20 handgrip contractions at each force level by matching the target. Each trial lasted about 3 s. A 20-s rest was provided after each contraction to minimize fatigue. The order of performing the four force levels was randomized. In task 2, the subjects performed handgrip MVCs that resulted in significant fatigue. Each MVC trial lasted 3 s and followed by a fixed 5-s rest.
Data Recording
Force
Handgrip force was measured by a data-recording system that consisted of a handgrip device connected to a pressure transducer (EPX-N1 250 PSI, Entran Devices, Inc., Fairfield, NJ) in a hydraulic environment, and a signal amplifier (DC – 50 Hz) (see Liu et al. (2002) for details). The handgrip device was a soft plastic bottle that could be comfortably gripped by hand. The force applied by handgrip was sensed and converted to a voltage signal by the pressure transducer. The output of the transducer was directed to the amplifier and then to an input channel of the Spike 2 data acquisition system (version 3.05, Cambridge Electronic Design, Ltd., Cambridge, UK), which transferred the voltage data to a laptop computer. The sampling rate for the force data was 100 Hz. A sampled time course of force data during the experiment is displayed in Fig. 1. Before the experiment, a brief (∼ 3 s) handgrip MVC was performed and the force was recorded. This MVC force was used to determine the target force levels. At the end of each experimental (task) session, the subjects exerted another brief handgrip MVC and the force was measured to examine whether muscle fatigue had set in.
Fig. 1.
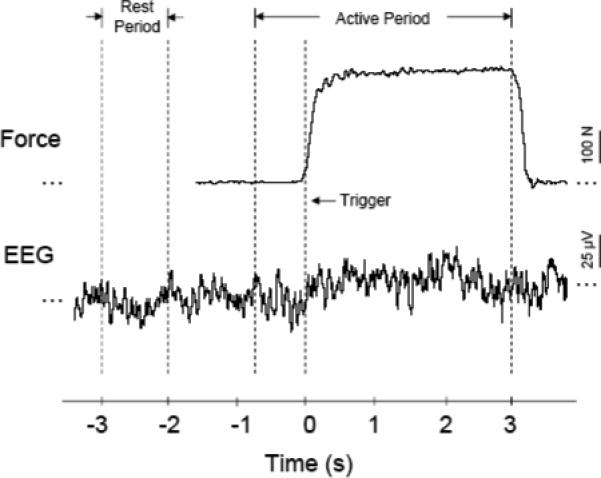
Sample force and EEG time courses and division of the data sections. The upper part is the force data of a handgrip trial; the lower part is the corresponding EEG signal (C3). The trigger (time “0”) is defined as the time at the 10% rising point of the force being generated in the trial. The active period is defined as the time from −0.75 to 3 s. The rest period is from 3 to 2 s prior to the trigger.
EEG
EEG signals were recorded from the scalp using a 64-channel NeuroSoft SYNAMPS system (version 4.2, NeuroScan, El Paso, Texas, USA). The subjects were seated in a position that allowed them to perform the handgrip comfortably. The electrode cap that holds the 64 Ag-AgCl electrodes was placed onto each subject's head based on the International 10−20 positioning method (Jasper, 1958). Conducting gel (Electro-gel™, Electro-Cap International, Inc., Eaton, OH, USA) was injected into the electrodes to connect the recording surface of each electrode with the scalp. The impedance of the EEG channels was maintained below 10 KΩ. One of the 64 electrodes (O2) was used to record the handgrip force. All the remaining 63 electrodes were referenced to the linked mastoids (M1 and M2). With this arrangement, the force signal was able to serve as the trigger signal for EEG processing (see below).
The EEG signals were band-pass filtered (0.05−70 Hz), amplified (× 75,000), and recorded on the hard disk of the computer at a sampling rate of 2000 Hz. The subjects were required to concentrate on the task performance and minimize distractions as much as possible. They were asked to maintain a stable body position and avoid eye blinks, teeth biting and head movements during the handgrip contractions, whereas minimal eye blinks and body adjustment were allowed during the resting periods. Possible sources of distraction or noise, such as sound or light, were minimized.
Data Analysis
Trigger and segmentation
The data were processed using house-coded programs within the Spike2 software package, MatLab (Version 7.0, The MathWorks, Inc., Natick, MA) and the TISEAN package (Hegger et al., 1999). The raw EEG data were visually inspected and trials with artifacts due to eye blinks or head movements were excluded (on average 2±2 out of 100 trials removed).
A trigger was set at the 10% MVC level in the rising position of the force in each trial (Fig. 1). This trigger point was defined as time “0”. In each trial, the EEG signal corresponding to the time period from −0.75 to 3.0 s (active period) and −3.0 to −2.0 s (rest period) was segmented and used for data analysis (Fig. 1).
Force analysis
The force data during the holding period of each trial (steady force) was measured and normalized to each subject's initial MVC in the fatigue experiment. The 100 MVC trials were grouped into 20 blocks with five trials in each block. The force was averaged in each block and over the eight subjects. Because the actual forces were very close to the target force levels during the 4-level-force experiment, the target forces (20, 40, 60 and 80% MVC) were used for the analysis of this task.
Chaos analysis
The EEG data were a sequence of voltage measurement sampled at discrete time points. To perform non-linear dynamic analysis a multivariate phase space was established first. The signal sequence was unfolded in the phase space. This procedure is known as state space reconstruction, which is based on the embedding theorem attributed to Takens (1981). Briefly, suppose s(1), s(2), ..., s(N) is our sequence of voltage measurements s(t), the reconstructed trajectory, X, can be expressed as a matrix where each row is a phase-space vector, i.e.,
| (1) |
where Xi is the state of the system at discrete time i. Each Xi is given by
| (2) |
where τ is the time lag or reconstruction delay, and m is the embedding dimension. The total number of points in the phase space n can be determined as n = N − (m − 1)τ. These Xi replace the scalar data measurements s(i) with data vectors in an Euclidean m-dimensional space in which the invariant aspects of the sequence of points s(t) are captured with no loss of information about the properties of the original system.
Determination of time lag
The time lag τ between successive elements in the delay vectors is not the subject of the embedding theorem, i.e., it could be arbitrary since the data items are assumed to have infinite precision and infinite number of length. However, in practice, the proper choice of the time lag is quite important. If τ is taken too small, there is almost no difference between the different elements of the delay vectors such that all points are accumulated around the bisectrix of the embedding space (Casdagli et al., 1991; Gibson et al., 1992). If τ is taken too large, the different coordinates may not be well correlated, in this case the reconstructed attractor may become very complicated, even if the underlying ‘true’ attractor is simple.
We determined the time lag τ using the method of Average Mutual Information (AMI) (Gallager, 1968). AMI is a type of nonlinear correlation function because the definition of information requires the joint distribution of the two measurements. Generally, the definition of AMI between measurement ai drawn from a set A = {ai} and measurement bj drawn from a set B = {bj} is given by
| (3) |
where PAB(a,b) is the joint probability density for measurements A and B resulting in values a and b. PA(a) and PB(b) are the individual probability densities for the measurements of A and of B, respectively. If the measurement of a value from A resulting in ai is completely independent of the measurement of a value from B resulting in bj, then PAB(ai,bj) factorizes as PAB(ai,bj) = PA(ai)PB(bj) and the amount of the mutual information between the measurements is zero as it should be. In our case, we created a histogram for the probability distribution in the data. Denote pi as the probability that the signal assumes a value inside the ith bin of the histogram, and let pij (τ) be the probability that s(t) is in bin i and s(t+τ) is in bin j. Then derived from Eq.(3), the mutual information for time lag τ reads as
| (4) |
In the special case of τ = 0, the joint probabilities pij = piδij and the expression yields the Shannon entropy (Gallager, 1968) of the data distribution. In the limit of large τ, s(t) and s(t +τ) have nothing to do with each other and pij thus factorizes to pipj and the mutual information becomes zero. In our study, the AMI was normalized so that I(τ = 0) = 1. A representative AMI curve of one trial was shown in Fig. 2a. The AMI value decreases as the increase of the time lag. The time lag where AMI falls to 20% determines a practical value for τ (Sarnthein et al., 1998). This criterion led to τ ≈ 4 ms for both the fatigue and the force-level data.
Fig. 2.
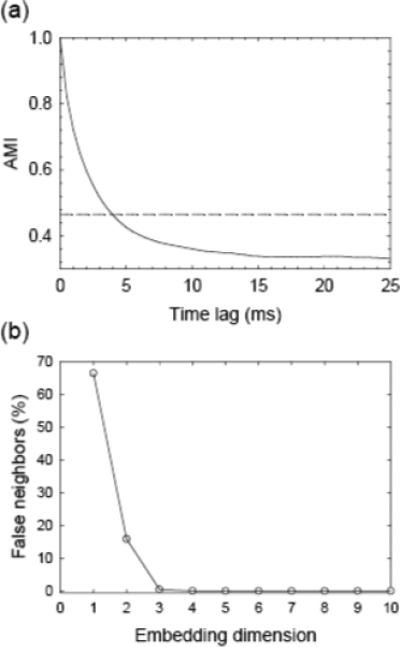
(a) Illustration of the relationship between Average Mutual Information (AMI) and time lag (τ) in a single trial (solid curve). The threshold, where AMI falls to 20% of its maximal interval, determines a practical value of τ (dashed line). (b) Illustration of percentages of false nearest neighbors in one trial. Less than 0.1% false nearest neighbors was found at dimension of 5 or higher, which determines the dimension.
Determination of dimension
Once we determined the time lag τ, the next step was to determine a proper dimension of the attractor. Consider the situation that an m0 dimensional delay reconstruction is an embedding, but an m0 − 1 dimensional is not. When passing from m0 to m0 − 1, one simply projects along one coordinate and thus maps different parts of the attractor onto each other, i.e., two points far away from each other in the higher-dimensional space could become neighbors in the lower-dimensional space due to projection. Hence, the dimension is determined by looking at the nearest neighbor of each point Xi in dimension d = 1, 2, ..., and asking whether that neighbor remains a neighbor in dimension d + 1. If all nearest neighbors remain neighbors as the dimension increases, then all points are true neighbors rather than being false neighbors due to projection from a higher dimension. This is called the false nearest neighbors test (Abarbanel, 1996), which works robustly even in the presence of noise. The percentages of false nearest neighbors of one trial were drawn in Fig. 2b. The percentage drops down as the dimension increases. Less than 0.1% false nearest neighbors was found at dimension of 5 or higher in our data analysis. By using this false nearest neighbor method, we determined the embedding dimension to be 5 for both the fatigue and force level EEG data.
Calculation of the largest Lyapunov exponent (L1)
The largest Lyapunov exponent L1 is one of the most important indices in describing the properties of a chaos system and it can be defined as follows (Kantz and Schreiber, 1997).
Let Xi1 and Xi2 be two points in the phase space with distance ∥Xi1 − Xi2∥ = δ0 = 1. Denote δΔ i the distance at time i between the two trajectories emerging from these points, i.e., δΔ i = ∥Xi1 + Δ i − Xi2 + Δ i∥. Then L1 is determined by
| (5) |
A positive L1 means an exponential divergence of nearby trajectories, i.e., chaos. In other words, L1 is an index to measure how much the outcome of a system depends on the initial conditions. In this study, we adopted the algorithm introduced by Kantz (1994). It has been tested to be useful for small data set and also works well in the presence of noise.
Practically, a point Xi0 of the time series in embedding space was chosen and all neighbors with distance from Xi0 that were smaller than ε were selected. Then the average over the distances of all neighbors to the reference part of the trajectory as a function of the relative time was computed. The logarithm of the average distance at time Δ i was calculated (plus the logarithm of the initial distance). Repeating this for many values of i0, the fluctuations of the effective expansion rates were averaged out. In formula, we calculated:
| (6) |
where the reference points Xi0 are the embedding vectors using the determined dimension m and time lag τ; U(Xi0 ) is the neighborhood of Xi0 with diameter ε . ε can neither be too small (otherwise few neighbors could be found inside the range of ε, resulting in larger statistical fluctuations) nor too big (resulting in a very time consuming calculation). According to Kantz (1994), this algorithm is not sensitive to the choice of ε as long as an acceptable number of neighbors are found. Based on our preliminary analysis, we set a reasonable value of ε, which was about 5% of the maximal peak-to-peak interval of the trial.
After the curve S(Δ i) was obtained, a linear range in every S(Δ i) plot was selected and linearly fitted. The slope was the largest Lyapunov exponent (L1). Fig. 3 shows the plot of the quantity S as a function of time step Δ i . After a sharp rising, S increases steadily along Δ i starting from about 0.02 s. After the time step at about 0.2 s, it reaches to a relatively stable value. In this example, the quantity S shows a linear curve during the time range from 0.02 to 0.2 s. This portion of S was linearly fitted and thus the slope was determined. For the fatigue experiment, the 100 trials were segmented into 20 blocks with 5 trials in each block. Within every block, the L1 values were averaged. For the force level experiment, the 20 trials at each force level were averaged. Finally, the results of all subjects were grand averaged. The data from both the active period (−0.75 to 3 s) and rest period (−3 to −2 s) were calculated and then compared.
Fig. 3.
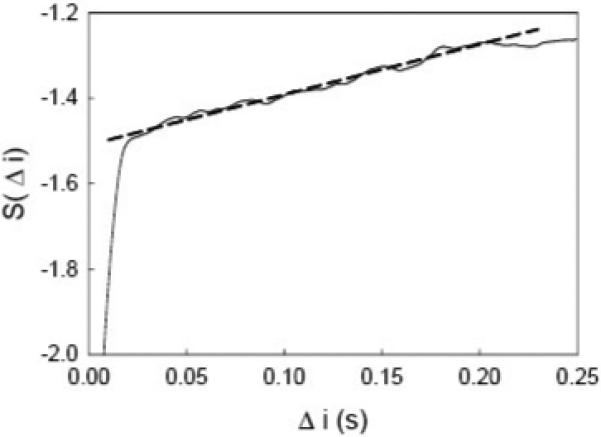
A sample plot of the quantity S as a function of time step Δ i in one trial. A linear portion of the S curve (solid curve) is linearly fitted (dashed line). The slope of the fitted line was determined as the L1 value.
Statistical Analysis
A two-way ANOVA was performed to examine the effects of the two factors (fatigue (block) / force level and recording electrode) and their interactions. Subsequently, a one-way ANOVA on one of the most interesting factors (fatigue / force level) was performed, followed by multiple comparisons among L1 values at different blocks / force levels. The differences between the L1s of the active and rest periods at each block / force level were examined using paired t tests. The significance level for the differences was chosen at P < 0.05. A linear regression analysis (Pearson correlation) was applied to examine the linearity of the correlation between L1 and the force (indicated by the correlation coefficient r2 with a significance level chosen as P < 0.05).
ACKNOWLEDGEMENTS
This work was partially supported by NIH grants NS-37400 and a Department of Defense grant DAMD17−01−1−0665.
Footnotes
Publisher's Disclaimer: This is a PDF file of an unedited manuscript that has been accepted for publication. As a service to our customers we are providing this early version of the manuscript. The manuscript will undergo copyediting, typesetting, and review of the resulting proof before it is published in its final citable form. Please note that during the production process errors may be discovered which could affect the content, and all legal disclaimers that apply to the journal pertain.
REFERENCES
- Abarbanel HDI. Analysis of Observed Chaotic Data. Spring-Verlag; New York: 1996. Choosing the Dimension of Reconstructed Phase Space. p. 39. Vol., ed.^eds. [Google Scholar]
- Aftanas LI, Lotova NV, Koshkarov VI, Pokrovskaja VL, Popov SA, Makhnev VP. Non-linear analysis of emotion EEG: calculation of Kolmogorov entropy and the principal Lyapunov exponent. Neurosci Lett. 1997;226:13–16. doi: 10.1016/s0304-3940(97)00232-2. [DOI] [PubMed] [Google Scholar]
- Aihara K, Matsumoto G. Chaos, Vol. Princeton University Press; Princeton, NJ: 1986. [Google Scholar]
- Andrzejak RG, Lehnertz K, Mormann F, Rieke C, David P, Elger CE. Indications of nonlinear deterministic and finite-dimensional structures in time series of brain electrical activity: Dependence on recording region and brain state. Physical Review E. 2001;64:061907. doi: 10.1103/PhysRevE.64.061907. [DOI] [PubMed] [Google Scholar]
- Bates JAV. Electrical Activity of the Cortex Accompanying Movement. Journal of Physiology-London. 1951;113:240–257. doi: 10.1113/jphysiol.1951.sp004569. [DOI] [PMC free article] [PubMed] [Google Scholar]
- Bigland-Ritchie B. EMG/force relations and fatigue of human voluntary contractions. Exerc Sport Sci Rev. 1981;9:75–117. [PubMed] [Google Scholar]
- Cadoret G, Smith AM. Comparison of the neuronal activity in the SMA and the ventral cingulate cortex during prehension in the monkey. J Neurophysiol. 1997;77:153–166. doi: 10.1152/jn.1997.77.1.153. [DOI] [PubMed] [Google Scholar]
- Casdagli M, Des Jardins D, Eubank S, Farmer JD, Gibson J, Hunter N, Theiler J, Kim JH, Stringer J. Applied Chaos. Wiley; New York: 1991. Nonlinear modeling of chaotic time series: theory and applications. Vol., ed.^eds. [Google Scholar]
- Crone NE, Miglioretti DL, Gordon B, Sieracki JM, Wilson MT, Uematsu S, Lesser RP. Functional mapping of human sensorimotor cortex with electrocorticographic spectral analysis. I. Alpha and beta event-related desynchronization. Brain. 1998;121(Pt 12):2271–2299. doi: 10.1093/brain/121.12.2271. [DOI] [PubMed] [Google Scholar]
- Dettmers C, Fink GR, Lemon RN, Stephan KM, Passingham RE, Silbersweig D, Holmes A, Ridding MC, Brooks DJ, Frackowiak RS. Relation between cerebral activity and force in the motor areas of the human brain. J Neurophysiol. 1995;74:802–815. doi: 10.1152/jn.1995.74.2.802. [DOI] [PubMed] [Google Scholar]
- Ehrsson HH, Fagergren A, Jonsson T, Westling G, Johansson RS, Forssberg H. Cortical activity in precision- versus power-grip tasks: an fMRI study. J Neurophysiol. 2000;83:528–536. doi: 10.1152/jn.2000.83.1.528. [DOI] [PubMed] [Google Scholar]
- Freeman WJ. Simulation of chaotic EEG patterns with a dynamic model of the olfactory system. Biol Cybern. 1987;56:139–150. doi: 10.1007/BF00317988. [DOI] [PubMed] [Google Scholar]
- Freeman WJ. Evidence from human scalp electroencephalograms of global chaotic itinerancy. Chaos. 2003;13:1067–1077. doi: 10.1063/1.1596553. [DOI] [PubMed] [Google Scholar]
- Gallager RG. Information Theory and Reliable Communication, Vol. John Wiley and Sons; New York, NY: 1968. [Google Scholar]
- Gandevia SC. Spinal and supraspinal factors in human muscle fatigue. Physiol Rev. 2001;81:1725–1789. doi: 10.1152/physrev.2001.81.4.1725. [DOI] [PubMed] [Google Scholar]
- Gibson JF, Farmer JD, Casdagli M, Eubank S. An Analytic Approach to Practical State-Space Reconstruction. Physica D. 1992;57:1–30. [Google Scholar]
- Gonzalez J, Gamundi A, Rial R, Nicolau MC, de Vera L, Pereda E. Nonlinear, fractal, and spectral analysis of the EEG of lizard, Gallotia galloti. Am J Physiol. 1999;277:R86–93. doi: 10.1152/ajpregu.1999.277.1.R86. [DOI] [PubMed] [Google Scholar]
- Hegger R, Kantz H, Schreiber T. Practical implementation of nonlinear time series methods: The TISEAN package. Chaos. 1999;9:413–435. doi: 10.1063/1.166424. [DOI] [PubMed] [Google Scholar]
- Holden AV, Winlow W, Haydon PG. The induction of periodic and chaotic activity in a molluscan neurone. Biol Cybern. 1982;43:169–173. doi: 10.1007/BF00319976. [DOI] [PubMed] [Google Scholar]
- Jasper HH. Report of the Committee on Methods, of Clinical Examination in Electroencephalography. Appendix: the ten-twenty electrode system of the Internation Federation. Electroencephalogr Clin Neurophysiol. 1958;10:370–375. [Google Scholar]
- Jeong J, Kim DJ, Chae JH, Kim SY, Ko HJ, Paik IH. Nonlinear analysis of the EEG of schizophrenics with optimal embedding dimension. Med Eng Phys. 1998a;20:669–676. doi: 10.1016/s1350-4533(98)00078-2. [DOI] [PubMed] [Google Scholar]
- Jeong J, Kim SY, Han SH. Non-linear dynamical analysis of the EEG in Alzheimer's disease with optimal embedding dimension. Electroencephalogr Clin Neurophysiol. 1998b;106:220–228. doi: 10.1016/s0013-4694(97)00079-5. [DOI] [PubMed] [Google Scholar]
- Jin SH, Jeong J, Jeong DG, Kim DJ, Kim SY. Nonlinear dynamics of the EEG separated by independent component analysis after sound and light stimulation. Biol Cybern. 2002;86:395–401. doi: 10.1007/s00422-001-0304-z. [DOI] [PubMed] [Google Scholar]
- Kantz H. A robust method to estimate the maximal Lyapunov exponent of a time series. Phys Lett A. 1994;185:77–87. [Google Scholar]
- Kantz H, Schreiber T. Nonlinear Time Series Analysis, Vol. Cambridge Univerisity Press; Cambridge, United Kingdom: 1997. [Google Scholar]
- Kinoshita H, Oku N, Hashikawa K, Nishimura T. Functional brain areas used for the lifting of objects using a precision grip: a PET study. Brain Res. 2000;857:119–130. doi: 10.1016/s0006-8993(99)02416-6. [DOI] [PubMed] [Google Scholar]
- Konig P, Engel AK. Correlated firing in sensory-motor systems. Curr Opin Neurobiol. 1995;5:511–519. doi: 10.1016/0959-4388(95)80013-1. [DOI] [PubMed] [Google Scholar]
- Kotini A, Anninos P. Detection of non-linearity in schizophrenic patients using magnetoencephalography. Brain Topogr. 2002;15:107–113. doi: 10.1023/a:1021420507901. [DOI] [PubMed] [Google Scholar]
- Lai YC, Harrison MA, Frei MG, Osorio I. Controlled test for predictive power of Lyapunov exponents: their inability to predict epileptic seizures. Chaos. 2004;14:630–642. doi: 10.1063/1.1777831. [DOI] [PubMed] [Google Scholar]
- Liu JZ, Zhang L, Yao B, Yue GH. Accessory hardware for neuromuscular measurements during functional MRI experiments. Magma. 2002;13:164–171. doi: 10.1007/BF02678592. [DOI] [PubMed] [Google Scholar]
- Liu JZ, Yang Q, Yao B, Brown RW, Yue GH. Linear correlation between fractal dimension of EEG signal and handgrip force. Biol Cybern. 2005a;93:131–140. doi: 10.1007/s00422-005-0561-3. [DOI] [PubMed] [Google Scholar]
- Liu JZ, Yao B, Siemionow V, Sahgal V, Wang X, Sun J, Yue GH. Fatigue induces greater brain signal reduction during sustained than preparation phase of maximal voluntary contraction. Brain Res. 2005b;1057:113–126. doi: 10.1016/j.brainres.2005.07.064. [DOI] [PubMed] [Google Scholar]
- Liu JZ, Zhang L, Yao B, Sahgal V, Yue GH. Fatigue induced by intermittent maximal voluntary contractions is associated with significant losses in muscle output but limited reductions in functional MRI-measured brain activation level. Brain Res. 2005c;1040:44–54. doi: 10.1016/j.brainres.2005.01.059. [DOI] [PubMed] [Google Scholar]
- Lutzenberger W, Preissl H, Pulvermuller F. Fractal dimension of electroencephalographic time series and underlying brain processes. Biol Cybern. 1995;73:477–482. doi: 10.1007/BF00201482. [DOI] [PubMed] [Google Scholar]
- Maier MA, Bennett KM, Hepp-Reymond MC, Lemon RN. Contribution of the monkey corticomotoneuronal system to the control of force in precision grip. J Neurophysiol. 1993;69:772–785. doi: 10.1152/jn.1993.69.3.772. [DOI] [PubMed] [Google Scholar]
- Murata A, Gallese V, Luppino G, Kaseda M, Sakata H. Selectivity for the shape, size, and orientation of objects for grasping in neurons of monkey parietal area AIP. J Neurophysiol. 2000;83:2580–2601. doi: 10.1152/jn.2000.83.5.2580. [DOI] [PubMed] [Google Scholar]
- Nishihira Y, Araki H, Ishihara A. Cerebral motor potential preceding grip strength movement. J Sports Med Phys Fitness. 1989;29:297–303. [PubMed] [Google Scholar]
- Palus M. Nonlinearity in normal human EEG: cycles, temporal asymmetry, nonstationarity and randomness, not chaos. Biol Cybern. 1996;75:389–396. doi: 10.1007/s004220050304. [DOI] [PubMed] [Google Scholar]
- Pereda E, Gamundi A, Rial R, Gonzalez J. Non-linear behaviour of human EEG: fractal exponent versus correlation dimension in awake and sleep stages. Neurosci Lett. 1998;250:91–94. doi: 10.1016/s0304-3940(98)00435-2. [DOI] [PubMed] [Google Scholar]
- Perkiomaki JS, Makikallio TH, Huikuri HV. Fractal and complexity measures of heart rate variability. Clin Exp Hypertens. 2005;27:149–158. [PubMed] [Google Scholar]
- Roschke J, Aldenhoff JB. A nonlinear approach to brain function: deterministic chaos and sleep EEG. Sleep. 1992;15:95–101. doi: 10.1093/sleep/15.2.95. [DOI] [PubMed] [Google Scholar]
- Roschke J, Fell J, Beckmann P. The calculation of the first positive Lyapunov exponent in sleep EEG data. Electroencephalogr Clin Neurophysiol. 1993;86:348–352. doi: 10.1016/0013-4694(93)90048-z. [DOI] [PubMed] [Google Scholar]
- Roschke J, Fell J, Beckmann P. Nonlinear analysis of sleep EEG data in schizophrenia: calculation of the principal Lyapunov exponent. Psychiatry Res. 1995;56:257–269. doi: 10.1016/0165-1781(95)02562-b. [DOI] [PubMed] [Google Scholar]
- Rosenberg JR, Amjad AM, Breeze P, Brillinger DR, Halliday DM. The Fourier approach to the identification of functional coupling between neuronal spike trains. Prog Biophys Mol Biol. 1989;53:1–31. doi: 10.1016/0079-6107(89)90004-7. [DOI] [PubMed] [Google Scholar]
- Sabesan S, Narayanan K, Prasad A, Spanias A, Sackellares JC, Iasemidis LD. Predictability of epileptic seizures: a comparative study using Lyapunov exponent and entropy based measures. Biomed Sci Instrum. 2003;39:129–135. [PubMed] [Google Scholar]
- Sakata H, Taira M, Kusunoki M, Murata A, Tanaka Y. The TINS Lecture. The parietal association cortex in depth perception and visual control of hand action. Trends Neurosci. 1997;20:350–357. doi: 10.1016/s0166-2236(97)01067-9. [DOI] [PubMed] [Google Scholar]
- Sarnthein J, Abarbanel HD, Pockberger H. Nonlinear analysis of epileptic activity in rabbit neocortex. Biol Cybern. 1998;78:37–44. doi: 10.1007/s004220050410. [DOI] [PubMed] [Google Scholar]
- Siemionow V, Yue GH, Ranganathan VK, Liu JZ, Sahgal V. Relationship between motor activity-related cortical potential and voluntary muscle activation. Exp Brain Res. 2000;133:303–311. doi: 10.1007/s002210000382. [DOI] [PubMed] [Google Scholar]
- Smith AM, Hepp-Reymond MC, Wyss UR. Relation of activity in precentral cortical neurons to force and rate of force change during isometric contractions of finger muscles. Exp Brain Res. 1975;23:315–332. doi: 10.1007/BF00239743. [DOI] [PubMed] [Google Scholar]
- Stam CJ, Jelles B, Achtereekte HA, van Birgelen JH, Slaets JP. Diagnostic usefulness of linear and nonlinear quantitative EEG analysis in Alzheimer's disease. Clin Electroencephalogr. 1996;27:69–77. doi: 10.1177/155005949602700205. [DOI] [PubMed] [Google Scholar]
- Stam CJ, Pijn JP, Suffczynski P, Lopes da Silva FH. Dynamics of the human alpha rhythm: evidence for non-linearity? Clin Neurophysiol. 1999;110:1801–1813. doi: 10.1016/s1388-2457(99)00099-1. [DOI] [PubMed] [Google Scholar]
- Stam KJ, Tavy DL, Jelles B, Achtereekte HA, Slaets JP, Keunen RW. Non-linear dynamical analysis of multichannel EEG: clinical applications in dementia and Parkinson's disease. Brain Topogr. 1994;7:141–150. doi: 10.1007/BF01186772. [DOI] [PubMed] [Google Scholar]
- Takens F, Rand D, Young LS. Dynamical Systems and Turbulence, Warwick 1980. Springer-Verlag, Springer; Berlin: 1981. Detecting strange attractors in turbulence. p. 366. Vol., ed.^eds. [Google Scholar]
- Thickbroom GW, Phillips BA, Morris I, Byrnes ML, Mastaglia FL. Isometric force-related activity in sensorimotor cortex measured with functional MRI. Exp Brain Res. 1998;121:59–64. doi: 10.1007/s002210050437. [DOI] [PubMed] [Google Scholar]
- Thickbroom GW, Phillips BA, Morris I, Byrnes ML, Sacco P, Mastaglia FL. Differences in functional magnetic resonance imaging of sensorimotor cortex during static and dynamic finger flexion. Exp Brain Res. 1999;126:431–438. doi: 10.1007/s002210050749. [DOI] [PubMed] [Google Scholar]
- Wolf A, Swift JB, Swinney HL, Vastano JA. Determining Lyapunov Exponents from a Time-Series. Physica D. 1985;16:285–317. [Google Scholar]


