Abstract
Using high molecular-weight proteomic analysis, we previously showed that Staphylococcal nuclease domain-containing protein 1 (SND1) is highly expressed in recurrent androgen-insensitive prostate cancer tissues. SND1 is a component of the RNA-induced splicing complex that mediates RNA interference, leading to degradation of specific mRNAs. The objective of this study was to further characterize SND1 expression and to investigate its biological potential in prostate cancer. Radical prostatectomy specimens were obtained from 62 prostate cancer patients. SND1 immunohistochemical staining patterns were evaluated using an in-house polyclonal antibody. We confirmed SND1 mRNA expression in prostate cancer cells using an in situ hybridization technique. To determine the importance of SND1 mRNA, we knocked down SND1 in vitro with small interfering RNA and observed a significant decrease in cell growth. SND1 was expressed in 60 of 62 prostate cancers (97%), appearing in the cytoplasm as small, granular structures; it was also present at high levels in prostate cancer specimens, while in hyperplasia specimens and normal epithelium, it was weakly or negatively expressed. SND1 expression intensity increased with increasing grade and aggressiveness of the cancer. As SND1 mRNA was overexpressed in cancer cells, the growth of these cells was suppressed following SND1 knockdown in vitro, thus representing a promising prostate cancer biomarker and therapeutic target.
Prostate cancer is extremely common in Western countries affecting, one in every six men in their lifetime. Most prostate cancers initially require androgen for growth, and thus androgen-depletion therapy leads to marked tumor regression by apoptosis. This therapy is unfortunately only palliative, and some cancer cells develop the ability to proliferate even in the absence of circulating serum androgen. These cells culminate in what is considered an androgen-independent phenotype. We have previously investigated alterations in expression of several proteins in recurrent androgen-dependent prostate cancer LNCaP cells after androgen suppression by proteomic analysis.1 Staphylococcal nuclease domain-containing protein 1 (SND1), also named Epstein-Barr virus-encoded transcription factor 2 co-activator p100, or Tudor staphylococcal nuclease, was found to exhibit a visually distinct pattern of up-regulation (1.5-fold by densitometric measurement) in androgen-independent cancers, as compared with androgen-dependent cancers in our previous study. This observation prompted us to further investigate the clinical relevance of this particular protein.
SND1 was originally reported in 1995 as a component of the RNA-induced splicing complex that mediates RNA interference in C. elegans, leading to degradation of specific mRNA.2 In mammalian cells, RNA interference occurs subsequent to loading microRNAs (miRs) into RNA-induced splicing complex where they guide mRNA degradation or translation silencing depending on the complementarity of the target.3 Activation of RNA interference pathway based on miR machinery is very important in oncogenesis and cancer development. Volinia et al4 reported that miR array of several solid cancers revealed an almost global up-regulation of miRs as a common feature of oncogenesis in many tissue types. Specifically in prostate adenocarcinoma, 39 of 45 different expressed miRs are up-regulated. An RNase III endonuclease, named dicer, is an essential component of the miR machinery, and its over-expression means activation of RNA interference to degrade target mRNAs. Chiosea et al5 reported that dicer is up-regulated in prostate cancer. They discussed that dicer may play a role in the early steps of prostate cancer development, probably by potentiating an almost miR up-regulation.
Along with dicer, SND1 is also the central component of the miR machinery. Our previous report revealed SND1 was up-regulated in androgen independent phenotype of prostate cancer. As the one of main player of miR machinery, SND1 may engage early carcinogenesis, and further androgen independency. If it is true, SND1 is likely a marker for prostate cancer and may be used in the detection of the aggressive phenotype. To verify this hypothesis, we validated SND1 expression in surgical specimens and compared its expression pattern and association with histological and clinical parameters in prostate cancer to that α-methylacyl-coenzyme A racemase (AMACR). AMACR is a clinically applicant tissue marker protein, which shows high sensitivity for prostate cancer and is useful for a pathologically doubtful case.6
Materials and Methods
Patients and Tissue Samples
From 1993 to 2003, 174 patients with prostate cancer received radical retropubic prostatectomy at the Jikei University Hospital. Ninety-three patents received neoadjuvant hormone therapy. Unfortunately, due to the preservation state of some specimens, 21 patients were excluded from this study. Study approval was granted by the Jikei University Ethics Committee Institutional Review Broad.
Table 1 lists characteristics of the patients. Preoperative prostate specific antigen (PSA) was quantified by Tosoh PSA assay (Tosoh Corporation, Tokyo, Japan). Biochemical failure was defined as two consecutive PSA increases ≥0.2 ng/ml. The date of failure was considered to be the time of the first increase.
Table 1.
Patient Demographics
| No. pts. | 62 |
|---|---|
| Mean age (range) | 65.1 (51–76) |
| Mean PSA (ng/ml, range) | 13.4 (3.69–41.6) |
| No. PSA (ng/ml) (%) | |
| <10.0 | 21 (33.9) |
| 10.0–20.0 | 29 (46.8) |
| >20.0 | 12 (19.4) |
| No. Gleason score (%) | |
| 2–6 | 17 (27.4) |
| 7 | 30 (48.4) |
| 8–10 | 15 (24.2) |
| No. highest Gleason pattern (%) | |
| 1 | 0 (0) |
| 2 | 7 (11.3) |
| 3 | 33 (53.2) |
| 4 | 15 (24.2) |
| 5 | 7 (11.3) |
| No. pathological stage (%) | |
| pT2a | 6 (9.7) |
| pT2b | 32 (51.6) |
| pT3a | 19 (30.6) |
| pT3b | 5 (8.1) |
| No. pos. capsular invasion (%) | 21 (33.9) |
| No. pos. surgical margin (%) | 31 (50.0) |
No. pts, number of patients, PSA, prostate specific antigen, pos., positive.
Morphological Evaluation
All resected specimens were fixed in 10% neutral buffered formalin and embedded in paraffin. Tumors were graded by a single pathologist (H.T.) using the original Gleason grading system.7 Pathological stage was determined by the same pathologist according to the 2002 TNM classification system.8 If high-grade prostatic intraepithelial neoplasia (HGPIN) or hyperplasia presented in the same specimen, the corresponding areas were also marked.
Preparation of Polyclonal Antibody to SND1
The antigen peptide RPASPATETVPAFSERTC corresponds to an internal sequence of SND1 (amino acids 423 to 440, Swiss-Prot; http://br.expasy.org/uniprot/Q7KZF4). The antigen peptide was conjugated to the carrier protein keyhole limpet hemocyanin and used to immunize Japanese White rabbits. The immune response was monitored by enzyme-linked immunosorbent assay and immunoglobulins from high-titer sera were collected with a protein G-immobilized column. The antibody was purified and isolated by affinity purification with a column using immobilized antigen peptide. This antibody was used in the following experiments.
Immunohistochemical Staining
Immunohistochemical (IHC) analysis was performed for the index or largest cancer focus in each surgical specimen. Immunoreactivity of SND1 was compared with that of another commercially available marker, AMACR, for which the rabbit monoclonal antibody P504S (Dako Japan, Tokyo, Japan) was used. Formalin-fixed, paraffin-embedded tissue sections were deparaffinized and rehydrated through a xylene and ethanol series and then treated with 3% hydrogen peroxide for 5 minutes to block endogenous peroxidase activity. Subsequently, slides were washed in distilled water, and then pretreated with citrate buffer solution (pH 6.0) in a microwave at 800 watts power for 10 minutes. After cooling, slides were washed and labeled. Since there was not internal control for adjusting IHC staining, we stained all specimens at the same moment using an automatic staining system; the Ventana Nexus automated stainer with Ventana reagent (Ventana Medical Systems, Inc., Tucson, AZ). The anti-SND1 antibody and P504S were applied at 0.6 mg/ml and a dilution of 1:100, respectively, for 32 minutes at 37°C, and the following detection and visualization procedures were performed according to the manufacture’s protocol using the Ventana 3,3-diaminobenzidine Basic Detection kit (Ventana Medical Systems, Inc.), which includes a universal biotinylated IgG secondary antibody (anti-mouse and anti-rabbit antibodies), avidin horseradish peroxidase, and 3,3-diaminobenzidine. After staining, slides were counterstained with hematoxylin. The specificity of the binding was confirmed by negative staining using rabbit nonimmune serum as a primary antibody.
An IHC score of 1 was assigned for variable or weak cytoplasmic staining, a score of 2 for moderate, apical granular cytoplasmic staining, and a score of 3 for strong cytoplasmic staining. No staining (negative IHC) received a score of 0. The patient’s score was the highest score in the index tumor, which was assigned by a single pathologist (H.T.) without access to clinical information. The IHC score was also blindly marked by another independent researcher (H.K.), and then each result was merged. In the case of different score, the two individuals discussed and concluded on a fixed IHC score. Normal area was chosen from an area far from the cancerous area. If the specimen contained HGPIN or hyperplasia lesions, these were evaluated by the same manner.
In Situ Hybridization
In situ hybridization of SND1 was conducted as previously described.9 Complementary DNA was prepared using 1 μg of total RNA isolated from the cell lysate using Isogen (Nippon Gene Co. Ltd, Tokyo, Japan). Primers used to amplify specific gene products were: SND1 forward, 5′-TCATCAAGATGGTCCTCTCA-3′; and SND1 reverse, 5′-CTTAATACGACTCACTATAGGGTGCAATGTTTTCCCCATTGG-3′. The PCR products were obtained using the One-Step reverse transcription (RT)-PCR kit (QIAGEN Japan, Tokyo, Japan) in accordance with the manufacturer’s protocol. The PCR product of SND1 was transcribed using a digoxigenin RNA labeling kit (Roche Diagnostics, Basel, Switzerland) to produce a complementary RNA probe. After removing paraffin from paraffin-embedded sections with a xylene and ethanol series, the complementary RNA probe was reacted overnight at 50°C. After a standard blocking treatment, anti-rabbit digoxigenin/horseradish peroxidase antibody (Dako Japan, Kyoto, Japan) was reacted for 15 minutes. The antibody-bound SND1 mRNA was then visualized using the GenPoint System (Dako Japan) in accordance with the manufacturer’s protocol.
Cell Lines
The human prostate cancer cell line PC-3 was obtained from the American Type Culture Collection (Rockville, MD). Cells were cultured as a monolayer in Roswell Park Memorial Institute 1640 medium (Invitrogen Japan, Tokyo, Japan) supplemented with 10% fetal bovine serum. Cultures were maintained at 37°C in an atmosphere of humidified air with 5% CO2.
Small Interfering RNA-Expressing Constructs and Knockdown of SND1
We used small interfering RNAs (siRNAs) predesigned by B-Bridge International (Mountain View, CA) to knock down SND1 mRNA. The target sequences for SND1 are 5′-GGGAGAACACCCAGGATAA-3′ (Si-1) and 5′-CAGCAAAGGTCTAGCCACA-3′ (Si-2). PC-3 cells were cultured in a 6-well culture plate at 5 × 10⁵ cells/well. On the following day, the cells were transfected with 0.1 mmol/well of siRNAs using DharmaFECT 2 transfection kit (Dharmacon, Lafayette, CO). As a negative control, cells were treated with an irrelevant siRNA, (5′-ATCCGCGCGATAGTACGTATT-3′, B-Bridge international). Viable cells were counted 72 hours after transfection. The effect of SDN1 knockdown was expressed as percentage of negative control.
Real-Time Quantitative RT-PCR
Interference with SND1 mRNA expression was confirmed by real-time quantitative RT-PCR, which was performed with TaqMan Gene Expression Assay (Applied BioSystems, Werrington, UK). Total RNA was extracted using the Ambion mirVana PARIS kit (Applied BioSystems). Five-hundred ng of total RNA was used for first-strand cDNA synthesis by SuperScript VILO (Invitrogen, Tokyo, Japan). The cDNA (5 ng of the total RNA) and TaqMan real-time primers and probes were used for amplification. A set of primers and a probe for each gene tested was obtained from Applied Biosystems (SND1 assay ID: Hs00205182-m1, β-actin: TaqMan PreDeveloped Assay Reagents). Fluorescence was detected using the ABI PRISM 7300 sequence detection system (Applied Biosystems). The relative mRNA expression level of each gene for each patient was normalized for input RNA against β-actin expression in the sample.
Statistical Analysis
Clinicopathological parameters were divided into groups; age (<70 or ≥70-year-old), PSA (<10, 10 to 20, or >20 ng/ml), Gleason score (2 to 6, 7, or 8 to 10), and pathological stage (pT2 or pT3). The correlation between SND1 or AMACR expression levels and clinicopathological variables was evaluated using the Mann-Whitney U test for comparing between two groups and Kruskal-Wallis test for three or more groups. The probability of biochemical failure was determined using the Kaplan-Meier method. Differences in survival curves were compared using the log-rank test. The Cox proportional hazards regression model was used for multivariate analysis of biochemical failure risk. Student’s t-test was used for comparisons of differences between knocked-down cells and negative controls. A difference was considered statistically significant at P < 0.05. All analyses were performed with StatView 5.0 statistical package (SAS Institute Inc., Cary, NC) except for Student’s t-test, which was performed with Excel 2007 software (Microsoft Corporation, Richmond, WA).
Results
IHC Analysis of SND1 and AMACR
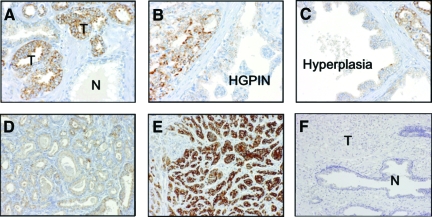
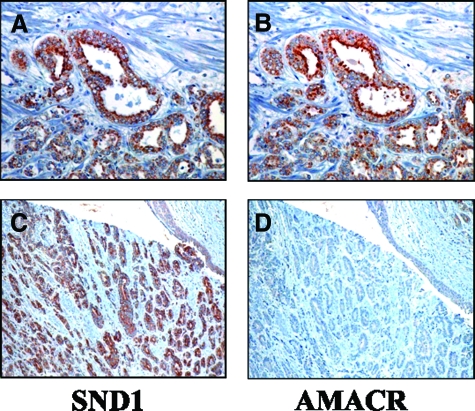
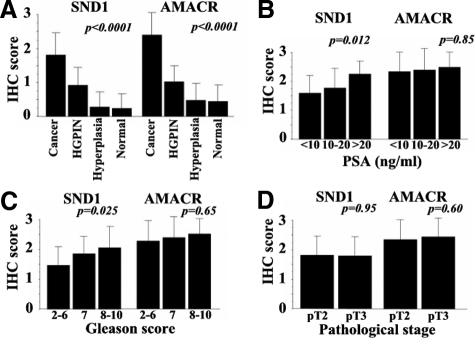
IHC staining revealed SND1 predominantly in the cytoplasm of cancer cells, typically as small granular structures (Figure 1A–F). The expression of AMACR was similar, but some SND1-positive cancer cells did not show AMACR expression (Figure 2A–D). In prostate cancer specimen, SND1 and AMACR expression were detected in 60 (97%) and 62 (100%) of a total 62 cases, respectively. However, both SND1 and AMACR were either weakly or not at all expressed (IHC score 0 to 1) in all benign prostatic glands, including the hyperplastic glands and normal luminal cells. In HGPIN, SND1, and AMACR were detected in 83.3% (35/42) and 90.5% (38/42) of the specimens, respectively, though expression was weak in most cases. Overall, order ranked staining from strong to weak appeared as cancer, HGPIN, and benign (Figure 1). The IHC scores in cancer, HGPIN, hyperplasia, and normal luminal cells were 1.7, 0.93, 0.24, and 0.27, (P < 0.0001 by Kruskal-Wallis tests) for SND1, respectively, and 1.9, 1.0, 0.47, and 0.45, (P < 0.0001 by Kruskal-Wallis tests) for AMACR, respectively (Table 2).
Figure 1.
SND1 expression in cancerous prostate tissue. SND1 was localized in the cytoplasm of cancer cells, but not expressed in normal gland (A). In HGPIN (B) and hyperplasia (C), SND1 expression was negative or weakly positive. Cancer of Gleason pattern 2 was stained weakly (D), whereas Gleason pattern 5 was stained strongly (E). Negative control was not stained both cancer and normal gland (F). T: cancer, N: normal gland.
Figure 2.
The expressions of SND1 and AMACR in prostate cancer. The expression of AMACR was similar to SND1 (A, B), but in some cases, SND1 positive cancer cells (C) did not show AMACR expression (D).
Table 2.
Comparison of IHC Scores between SND1 and AMACR Stratified by Final Diagnosis, PSA, Gleason score, and Pathological Stage for 62 Radical Prostatectomy Specimens
| IHC score | SND1
|
AMACR
|
||||||||||
|---|---|---|---|---|---|---|---|---|---|---|---|---|
| 0 | 1 | 2 | 3 | Mean | P* | 0 | 1 | 2 | 3 | Mean | P* | |
| No. cancer total | 2 | 14 | 40 | 6 | 1.8 | <0.0001 | 0 | 6 | 25 | 31 | 2.4 | <0.0001 |
| No. PSA (ng/ml) | 0.012 | 0.85 | ||||||||||
| <10 | 0 | 9 | 10 | 1 | 1.6 | 0 | 2 | 9 | 9 | 2.4 | ||
| 10<20 | 2 | 5 | 20 | 1 | 1.7 | 0 | 2 | 9 | 9 | 2.4 | ||
| >20 | 0 | 0 | 9 | 3 | 2.3 | 0 | 0 | 6 | 6 | 2.5 | ||
| No. Gleason score | 0.025 | 0.65 | ||||||||||
| 2<6 | 1 | 7 | 9 | 0 | 1.5 | 0 | 2 | 8 | 7 | 2.3 | ||
| 7 | 1 | 4 | 23 | 2 | 1.9 | 0 | 4 | 10 | 16 | 2.4 | ||
| 8<10 | 0 | 3 | 8 | 4 | 2.1 | 0 | 0 | 7 | 8 | 2.5 | ||
| No. pathological stage | 0.95 | 0.60 | ||||||||||
| pT2 | 1 | 8 | 25 | 4 | 1.8 | 0 | 4 | 16 | 18 | 2.4 | ||
| pT3 | 1 | 5 | 16 | 2 | 1.8 | 0 | 2 | 9 | 13 | 2.5 | ||
| No. HGPIN | 7 | 31 | 4 | 0 | 0.93 | 4 | 33 | 5 | 0 | 1.0 | ||
| No. hyperplasia | 37 | 14 | 0 | 0 | 0.24 | 27 | 24 | 0 | 0 | 0.47 | ||
| No. normal gland | 47 | 15 | 0 | 0 | 0.27 | 34 | 28 | 0 | 0 | 0.45 | ||
P value for differences mean score among groups of cancer, HGPIN, hyperplasia and normal gland, and each group of PSA. Gleason scores were assessed using the Kruskal-Wallis test. P value for difference between pT2 and pT3 was assessed using the Mann-Whitney U test.
The intensity of SND1 immunoreactivity showed distinct correlation with Gleason score; more intense immunoreactivity being associated with higher specimen score (p = 0.025; Figure 3A and C, and Table 2). Expression of SND1 was also associated with high PSA but not with pathological T stage (Figure 3, A, B, and D). By contrast, AMACR showed no relationship with any clinicopathological parameters including Gleason score, PSA level, and pathological T stage.
Figure 3.
Relative expression of SND1 and AMACR by IHC score stratified by (A) histological findings including cancer, HGPIN, hyperplasia and normal glands, (B), serum PSA levels, (C) Gleason score, and (D). pathological stage. Column, mean; bars, SD.
SND1 mRNA Expression in Tissues
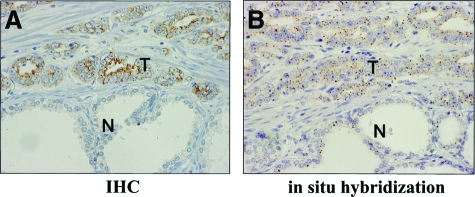
Ten slides were selected randomly for confirmation of SND1 mRNA expression in surgical specimens by in situ hybridization. In all selected slides SND1 protein was found positive in cancer cells and negative to weak in expression in normal luminal cells. The intensity of mRNA signals was very similar to the IHC findings. That is, SND1 mRNA was highly expressed in the cytoplasm of cancer cells but was negative to weak in noncancerous cells (Figure 4, A–B).
Figure 4.
In situ hybridization of a surgical specimen for prostate cancer. A: IHC shows SND1 was highly expressed in cancer cells (T) but almost negative in noncancerous cell (N). B: In situ hybridization shows SND1 mRNA was highly expressed in cancer cells (T) but was almost negative or weakly positive in normal luminal cells (N). IHC, immunohistochemistry.
Knockdown of SND1 by siRNA
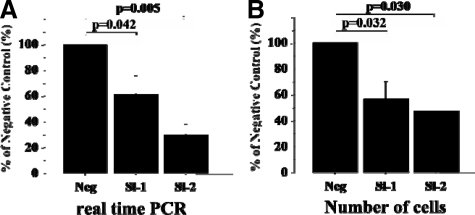
Endogenous expression of SND1 mRNA was knocked down by two types of specifically designed siRNAs (Si-1 and Si-2) in the prostate cancer PC-3 cell line. Real-time quantitative RT-PCR showed Si-1 and Si-2 significantly decreased gene expression of SND1, by 62.1% and 30.0%, respectively, compared with the negative control (p = 0.042 and 0.005, respectively). In PC-3 cells where SND1 had been knocked down by Si-1 or Si-2 growth was significantly suppressed (by 56.7% and 47.3%, respectively) as compared with control cells, (Figure 5A-B; p = 0.032 and 0.030, respectively).
Figure 5.
Effect of knockdown of SND1 mRNA in PC-3 cells. A: Real-time quantitative RT-PCR showed SND1-specified siRNAs (Si-1, Si-2) significantly decreased SND1 gene expression. B: Cell growth of prostate cancer was suppressed comparing to negative control by knockdown with siRNAs. Column, mean; scale bars = SD.
Results of Multivariate Analysis for Biochemical Failure after Surgery
Of 62 patients, 14 were lost during follow-up due to patient noncompliance. No deaths occurred throughout the study. At a median follow-up time from prostatectomy to biochemical failure of 35 months (range, 3 to 113 months) biochemical failure had occurred for 49.1% of these patients. In univariate Kaplan-Meier analysis, primary Gleason grade was associated significantly with biochemical failure (p = 0.047). In an exploratory multivariate analysis that included age, PSA, pathological stage, capsular invasion, surgical margin, primary Gleason grade, SND1 intensity, and AMACR intensity, pathological stage and capsular invasion SND1 had independent prognostic significance. However, high SND1 expression was not an independent predictor for biochemical failure after radical prostatectomy (p = 0.21, Table 3).
Table 3.
Univariate and Multivariate Analysis (Cox Regression Model) for Biochemical Failure
| Variable | HR (95% CI) | P |
|---|---|---|
| Univariate analysis | ||
| pT stage (≥pT3 vs. <pT3) | 1.004 (0.463, 2.175) | 0.99 |
| Primary Gleason grade (≥4 vs. <4) | 2.184 (1.011, 4.721) | 0.047* |
| Gleason score (≥7 vs. <7) | 2.493 (0.926, 6.712) | 0.071 |
| Capsular invasion (positive versus negative) | 1.425 (0.654, 3.107) | 0.37 |
| SND1 IHC score (≥2 vs. <2) | 1.627 (0.612, 4.325) | 0.33 |
| AMACR IHC score (≥3 vs. 3) | 0.761 (0.348, 1.660) | 0.49 |
| Multivariate analysis | ||
| pT stage (≥pT3 vs. <pT3) | 0.283 (0.089, 0.904) | 0.033* |
| Capsular invasion (positive versus negative) | 3.324 (1.031, 10.139) | 0.044* |
| SND1 IHC score (≥2 vs. <2) | 2.228 (0.643, 7.717) | 0.21 |
| AMACR IHC score (≥3 vs. 3) | 0.391 (0.144, 1.059) | 0.065 |
P < 0.05.
Discussion
We have shown evidence for the diagnostic potential of SND1 in prostate surgical specimens equivalent or better than that of AMACR. There have been numerous reports indicating the effectiveness of AMACR for identifying cancer, which have resulted to its use in the clinical setting.10 However, since AMACR staining is unstable and the test shows unsatisfactory specificity, it is considered insufficient for use as an independent tumor diagnostic marker. In cases with difficult pathological diagnosis, an antibody cocktail containing AMACR together with the basal cell markers 34βE12 and p63 is available for cancer confirmation.11 SND1 offers a promising new tissue marker, however its specificity, although better than that of AMACR, is still not sufficient for use as a sole marker. SND1 and AMACR do show different expression in some cases (Figure 2, C–D) and therefore the possibility of SND1 joining the cocktail of pathologically useful tissue markers that includes AMACR, 34βE12, and p63 is favored.
At this time, the Gleason score of biopsy specimens is the most powerful predictor of prostate cancer progression, and is an essential parameter in nomograms for predicting clinically insignificant cancer.12 However, since the Gleason grading system is based solely on glandular architecture, small specimens such as needle biopsy samples often show poor interpathologist reproducibility.13 Moreover, scores are based on the pathologist’s subjective impression and experience. Even in surgical specimens, the scores assigned by trained observers disagree with those previously assigned in over 70% of cases.14 Hence, a new tissue marker that reflects grade of malignancy would contribute significantly to the objective assessment of prostate cancer. We found that prostate cancer cells with higher Gleason score exhibited more intense SND1 expression than did those with lower grades (Figure 3, A and C). It seems reasonable to suppose that SND1 is related with aggressiveness of prostate cancer. To put in clinical language, although some of Gleason 8 to 10 cancers only showed weak expression, SND1 may offer an important role in distinguishing the presence of a more aggressive and clinically significant phenotype. In our study, statistical significance was not observed through multivariate analysis to identify high SND1 expression as an independent predictor of biochemical failure after radical prostatectomy, and this may be attributed to the small sample size used. Since statistical significance was also not found for specimen Gleason score in this study, the small sample size may have contributed to this overall observation of SND1 not being an independent predictor of biochemical failure. Follow-up studies with a larger sample population are necessary to investigate this.
siRNAs specifically knocked down SND1 mRNA and effectively inhibited cell proliferation of PC-3 prostate cancer cells (Figure 5). Reports of this molecule’s function in other settings have recently appeared and may provide insight as to its function in prostate cancer cells. SND1 was previously identified as an enhancer of the transcription activity of Epstein-Barr virus nuclear antigen 2 and also as a protein that is essential for normal growth of B lymphocytes.2 SND1 has four staphylococcal nuclease-like domains (SN-like domains) and a Tudor domain.15 It has been demonstrated to bind with signal transducer and activator of transcription 6 via an SN-like domain, to bind with the large fragment of RNA polymerase II, and to control the basal transcription mechanism of signal transducer and activator of transcription 6 by a bridging function.16 In addition, SND1 binds to c-Myb, a differentiation and growth factor of immature hematopoietic cells and lymphocytes, suggesting involvement in up-regulation of translation.17 Although SND1 is located primarily in the cytoplasm, it can also migrate to the nucleus and has been indicated as possessing the potential to control translation activity.18 Tsuchiya et al19 reported the involvement of SND1 in colon carcinogenesis, with SND1 suppressing the adenomatous polyposis coli protein level via a post-transcriptional mechanism. These authors found no relation to tumor aggressiveness or progression, leading them to suggest possible involvement of SND1 in early-stage carcinogenesis in colon cancer. In prostate cancer, although SND1 could contribute to the RNA degradation observed in RNA interference, the target RNA has not been defined. However, many miRs were up-regulated in prostate cancer, and targets of these miRs include major tumor suppressor genes. For example, let-7 negatively regulates Ras, miR-17-5p, and miR-20a control E2F, and miR-16-1 and miR-15a repress Bcl-2.5 Since the miR machinery including engagement of SND1 in prostate cancer is somewhat of a black box, further studies are warranted.
In conclusion, SND1 may have the potential for identification of the more aggressive and clinically significant prostate cancers.
Acknowledgments
We thank William A. Thomasson, Ph.D. and Ms. Jennifer Locke for expert editorial assistance.
Footnotes
Address reprint requests to Hidetoshi Kuruma, Department of Urology, Jikei University School of Medicine, 3-25-8 Nishi-Shimbashi, Minato-ku, Tokyo, Japan. E-mail: hkuruma@jikei.ac.jp.
Supported by a Grant-in-Aid from the Ministry of Education, Science, Sports and Culture of Japan, a grant from Japanese Foundation for Prostate Research, the Jikei University Research Found, and Kurozumi Medical Foundation.
References
- Kuruma H, Egawa S, Oh-Ishi M, Kodera Y, Satoh M, Chen W, Okusa H, Matsumoto K, Maeda T, Baba S. High molecular mass proteome of androgen-independent prostate cancer. Proteomics. 2005;5:1097–1112. doi: 10.1002/pmic.200401115. [DOI] [PubMed] [Google Scholar]
- Tong X, Drapkin R, Yalamanchili R, Mosialos G, Kieff E. The Epstein-Barr virus nuclear protein 2 acidic domain forms a complex with a novel cellular coactivator that can interact with TFIIE. Mol Cell Biol. 1995;15:4735–4744. doi: 10.1128/mcb.15.9.4735. [DOI] [PMC free article] [PubMed] [Google Scholar]
- Bernstein E, Caudy AA, Hammond SM, Hannon GJ. Role for a bidentate ribonuclease in the initiation step of RNA interference. Nature. 2001;409:363–366. doi: 10.1038/35053110. [DOI] [PubMed] [Google Scholar]
- Volinia S, Calin GA, Liu CG, Ambs S, Cimmino A, Petrocca F, Visone R, Iorio M, Roldo C, Ferracin M, Prueitt RL, Yanaihara N, Lanza G, Scarpa A, Vecchione A, Negrini M, Harris CC, Croce CM. A microRNA expression signature of human solid tumors defines cancer gene targets. Proc Natl Acad Sci USA. 2006;103:2257–2261. doi: 10.1073/pnas.0510565103. [DOI] [PMC free article] [PubMed] [Google Scholar]
- Chiosea S, Jelezcova E, Chandran U, Acquafondata M, McHale T, Sobol RW, Dhir R. Up-regulation of dicer, a component of the MicroRNA machinery, in prostate adenocarcinoma. Am J Pathol. 2006;169:1812–1820. doi: 10.2353/ajpath.2006.060480. [DOI] [PMC free article] [PubMed] [Google Scholar]
- Magi-Galluzzi C, Luo J, Isaacs WB, Hicks JL, de Marzo AM, Epstein JI. Alpha-methylacyl-CoA racemase: a variably sensitive immunohistochemical marker for the diagnosis of small prostate cancer foci on needle biopsy. Am J Surg Pathol. 2003;27:1128–1133. doi: 10.1097/00000478-200308000-00010. [DOI] [PubMed] [Google Scholar]
- Gleason DF. Classification of prostatic carcinomas. Cancer Chemother Rep. 1966;50:125–128. [PubMed] [Google Scholar]
- UICC International Union Sobin LH, Wittekind CH, editors. New York: John Wiley & Sons, Inc; UICC International Union Against Cancer, TNM classification of malignant tumors, (6th ed.) 2002:pp. 184–187. [Google Scholar]
- Tsuchiya B, Sato Y, Montone KT, Nagai T, Kameya T. Four-hour double staining for in situ hybridization and immunohistochemistry. The J Histotechnol. 2000;23:321–325. [Google Scholar]
- Rubin MA, Zhou M, Dhanasekaran SM, Varambally S, Barrette TR, Sanda MG, Pienta KJ, Ghosh D, Chinnaiyan AM. alpha-Methylacyl coenzyme A racemase as a tissue biomarker for prostate cancer. JAMA. 2002;287:1662–1670. doi: 10.1001/jama.287.13.1662. [DOI] [PubMed] [Google Scholar]
- Humphrey PA. Diagnosis of adenocarcinoma in prostate needle biopsy tissue. J Clin Pathol. 2007;60:35–42. doi: 10.1136/jcp.2005.036442. [DOI] [PMC free article] [PubMed] [Google Scholar]
- Epstein JI, Partin AW, Sauvageot J, Walsh PC. Prediction of progression following radical prostatectomy. A multivariate analysis of 721 men with long-term follow-up. Am J Surg Pathol. 1996;20:286–292. doi: 10.1097/00000478-199603000-00004. [DOI] [PubMed] [Google Scholar]
- Steinberg DM, Sauvageot J, Piantadosi S, Epstein JI. Correlation of prostate needle biopsy and radical prostatectomy Gleason grade in academic and community settings. Am J Surg Pathol. 1997;21:566–576. doi: 10.1097/00000478-199705000-00010. [DOI] [PubMed] [Google Scholar]
- Montironi R, Mazzuccheli R, Scarpelli M, Lopez-Beltran A, Fellegara G, Algaba F. Gleason grading of prostate cancer in needle biopsies or radical prostatectomy specimens: contemporary approach, current clinical significance and sources of pathology discrepancies. BJU Int. 2005;95:1146–1152. doi: 10.1111/j.1464-410X.2005.05540.x. [DOI] [PubMed] [Google Scholar]
- Callebaut I, Mornon JP. The human EBNA-2 coactivator p100: multidomain organization and relationship to the staphylococcal nuclease fold and to the tudor protein involved in Drosophila melanogaster development. Biochem J. 1997;321:125–132. doi: 10.1042/bj3210125. [DOI] [PMC free article] [PubMed] [Google Scholar]
- Yang J, Aittomäki S, Pesu M, Carter K, Saarinen J, Kalkkinen N, Kieff E, Silvennoinen O. Identification of p100 as a coactivator for STAT6 that bridges STAT6 with RNA polymerase II. EMBO J. 2002;21:4950–4958. doi: 10.1093/emboj/cdf463. [DOI] [PMC free article] [PubMed] [Google Scholar]
- Leverson JD, Koskinen PJ, Orrico FC, Rainio EM, Jalkanen KJ, Dash AB, Eisenman RN, Ness SA. Pim-1 kinase and p100 cooperate to enhance c-Myb activity. Mol Cell. 1998;2:417–425. doi: 10.1016/s1097-2765(00)80141-0. [DOI] [PubMed] [Google Scholar]
- Ness SA. Myb binding proteins: regulators and cohorts in transformation. Oncogene. 1999;18:3039–3046. doi: 10.1038/sj.onc.1202726. [DOI] [PubMed] [Google Scholar]
- Tsuchiya N, Ochiai M, Nakashima K, Ubagai T, Sugimura T, Nakagama H. SND1, a component of RNA-induced silencing complex, is up-regulated in human colon cancers and implicated in early stage colon carcinogenesis. Cancer Res. 2007;67:9568–9576. doi: 10.1158/0008-5472.CAN-06-2707. [DOI] [PubMed] [Google Scholar]


