

Abstract
The ability to maintain cognitive function during aging is a complex process subject to genetic and environmental influences. Alzheimer’s disease (AD) is the most common disorder causing cognitive decline among the elderly. Among those with AD, there is broad variation in the relationship between AD neuropathology and clinical manifestations of dementia. Differences in expression of genes involved in neural processing pathways may contribute to individual differences in maintenance of cognitive function.
We performed whole genome expression profiling of RNA obtained from frontal cortex of clinically non-demented and AD subjects to identify genes associated with brain aging and cognitive decline. Genetic mapping information and biological function annotation were incorporated to highlight genes of particular interest. The candidate genes identified in this study were compared with those from two other studies in different tissues to identify common underlying transcriptional profiles. In addition to confirming sweeping transcriptomal differences documented in previous studies of cognitive decline, we present new evidence for up-regulation of actin-related processes and down-regulation of translation, RNA processing and localization, and vesicle-mediated transport in individuals with cognitive decline.
Keywords: Cognitive reserve, cognitive decline, Alzheimer’s disease, healthy brain aging, gene expression profiling, synaptic plasticity, Intersectin 1
1. Introduction
Finding the genes involved in a complex phenotype such as healthy brain aging is challenging due to the biological complexity of the underlying genetic and environmental components. A primary challenge is presented by the heterogeneity of the phenotype itself. Individuals exhibit broad variation in the ability to maintain cognitive function during the aging process. Clinically significant cognitive decline in the elderly is most commonly caused by Alzheimer’s disease (AD). Diagnostic neuropathological features of AD include extracellular amyloid plaques and intracellular neurofibrillary tangles (NFTs). However, there is considerable neuropathological heterogeneity across individuals with clinical AD and individuals with no clinical signs of dementia, making division into “cases” and “controls” based on neuropathology problematic. In particular, there is tremendous variability in the relationship between the amount and location of AD neuropathology in the brain and the clinical manifestation of AD symptoms [61]. Individuals without loss of cognitive function may tolerate high levels of brain tissue injury presumptively indexed by amyloid plaques and NFTs, while others demonstrate loss of cognition with similar or even lower levels of lesion burden. These differences in protection from the effects of AD neuropathology may be due to genetic differences at several levels including the expression of gene products.
According to cognitive reserve theory, individuals differ in their capacity to maintain normative cognitive function and, accordingly, those with greater capacity are better equipped to delay or circumvent the damaging effects of brain lesions that in other less equipped individuals, lead to clinical manifestations of AD. The theory postulates that this natural variability across individuals is due to differences in neural processing mechanisms [32]. The physiological basis of this mechanism is unknown, although it is likely to reflect environmental as well as genetic factors [36,58]. Genetic variations can contribute to individual differences in normal cognitive function. Interaction between these genetic differences and environmental factors over the lifespan can amplify variation in cognitive function later in life.
There is growing evidence that variation in the quantity of a gene product, rather than simply presence or absence of product, can be responsible for the subtle effects of complex traits [21,30,62]. Several recent studies have shown that variation in gene expression is heritable [12,46,72] and can be mapped as a quantitative trait [46]. We suggest that differences in expression of genes in neural processing pathways are responsible for differences in the maintenance of cognitive function, and at least in part account for an important component of cognitive reserve.
To address this assertion, we performed whole genome expression profiling on a set of well-characterized, clinically non-demented and AD subjects in order to identify genes, or gene pathways, that contribute to cognitive decline. Subjects were stratified into four groups based on cognitive status prior to death (non-demented or AD) and neuropathological status defined by three categories of NFT burden (Braak stage I/II, III/IV, and V/VI) (Figure 1A). Non-demented subjects were represented in all three Braak-stage categories, whereas AD subjects were represented only in Braak stage V/VI. We designed three comparisons to test three hypotheses (Figure 1B). In the first comparison, we postulated that all non-demented subjects, taken as a whole (Groups 1, 2 and 3), would exhibit different gene expression profiles compared to AD subjects (Group 4), irrespective of NFT burden. We refer to this as the Extreme Cognitive Phenotypes Hypothesis (Hypothesis I). In the second comparison, we proposed that individuals with lower NFT burden (Braak stage I/II and III/IV, Groups 1 and 2) would display different expression profiles than those with higher NFT burden (Braak stage V/VI, Groups 3 and 4), irrespective of cognitive ability. We refer to this as the Neuropathologic Process Hypothesis (Hypothesis II). In the third comparison, we postulated that expression profiles in non-demented subjects with a high NFT burden (Group 3) would differ from those in AD subjects with similar NFT pathology (Group 4). We refer to this as the Cognitive Reserve Hypothesis (Hypothesis III).
Figure 1. Subject Comparisons.

A) Subjects were separated into four groups based on Braak stage and cognitive health. B) Two separate ANOVA comparisons performed. I. Extreme Cognitive Phenotypes were assessed by combining all non-demented subjects compared to AD subjects; II. Neuropathological Process was assessed by comparing low Braak stage subjects with high Braak stage subjects regardless of cognitive ability; III. Cognitive Reserve was assessed using Vector projection comparing non-demented, Braak V/VI subjects with AD subjects.
We interpret our gene expression results in the context of prior evidence from genetic linkage studies and biological function annotations to identify possible candidate susceptibility genes. Furthermore, since genes that are differentially expressed across tissues involved in AD pathology would provide valuable insight into common underlying genetic mechanisms in brain aging, we compared genes identified in this study, using frontal cortex, with genes identified in two other expression studies using hippocampus [8] and entorhinal cortex [20] . Genes that were differentially expressed across the three studies, emphasizing common themes of pathology underlying dementia, are key candidates for further studies of genetic risk factors for cognitive decline.
2. Materials and methods
2.1 Patient and control samples
Postmortem human brain tissue comprised primarily of gray matter from frontal cortex was obtained from the neuropathology core of the NIA-Layton Aging and Alzheimer’s Disease Center, Oregon Health & Sciences University (OHSU). All subjects were characterized based on specific clinical and neuropathologic criteria [43] through studies performed by the NIA-Layton Aging and Alzheimer’s Disease Center. An extensive collection of clinical data, including cognitive and functional measures, and neuropathologic data was available for all subjects. Testing included annual cognitive, functional and neuropsychological examinations. At autopsy, portions of the brain were frozen at −80°C and the remainder was prepared for histological examination by fixation in 10% formalin. All subjects were scored for neuritic amyloid plaques and neurofibrillary tangles according to NIA-Reagan criteria [1,43].
All subjects met the following minimal criteria for study inclusion: post-mortem interval < 24 hours, neurological examination within one year of death, Caucasian, non-detectable cancer metastases, and minimal degradation of brain-derived RNA for microarray analysis (see below). AD subjects were also required to have age at onset > 70 years and a clinical diagnosis of Probable AD. AD subjects with a coexisting neuropathologic diagnosis of Parkinson’s disease, Lewy Body Dementia or Frontotemporal Dementia were excluded from the study. Non-AD subjects were required to have a clinical diagnosis of “non-demented”, a CDR score of 0 and a Mini-Mental State Examination score (MMSE) > 25 (Table 1). Braak stage [9] was used to further define all subjects with respect to severity of neurofibrillary tangle burden (Figure 1A). The study sample comprised fourteen subjects (7 male, 7 female). Average age at death was similar across all groups (89.7 - 93.6 years). Non-demented subjects had an average MMSE score of 28.4; AD subjects had an average MMSE score of 14.4 (Table 1).
Table 1.
Subject Description
| Non-demented | AD | |||
|---|---|---|---|---|
| Braak | I/II | III/IV | V/VI | V/VI |
| Age | 93.03 ± 12.19 | 90.85 ± 0.21 | 93.57 ± 1.59 | 89.74 ± 4.33 |
| MMSE | 28.0 ± 2.0 | 29.0 ± 1.41 | 28.33 ± 1.15 | 14.40 ± 6.99 |
| Clinical DX | ND n=3 |
ND n=3 |
ND n=3 |
PRAD n=5 |
Subjects were assigned to four groups based on Braak stage scoring (see Methods). MMSE, Minimental Status Exam; Clinical DX, clinical diagnosis; ND, non-demented; Braak, Braak stage; n, number of subjects.
2.2 RNA isolation and hybridization
Approximately 500 mg of fresh frozen brain tissue from each individual was processed for total RNA using the RNeasy kit (Qiagen Inc., Valencia, CA). RNA quality was assessed by UV absorbance measurement and electrophoresis on RNA NanoChips using the 2100 Bioanalyzer (Agilent, Palo Alto, CA). Samples were considered acceptable for labeling and further processing if UV260/280 ratios were greater than 1.7 and Bioanalyzer profiles showed minimal degradation. For determination of degradation status, Bioanalyzer profiles were referenced to a simultaneously processed control of high quality RNA whose profile correlated with good performance on an Affymetrix GeneChip array (Gene Microarray Shared Resource, OHSU).
Two ug of total RNA from each subject was amplified and labeled using the AMC one cycle cDNA, Affy IVT amplification/labeling protocol following manufacturer’s instructions (Affymetrix Inc., Santa Clara, CA). Labeled targets were hybridized with Affymetrix GeneChip HG-U133 Plus 2.0 arrays. These arrays contain 47,000 transcripts spanning the entire human transcriptome. Sample labeling and array hybridizations and processing were performed in the Affymetrix Microarray Core, Gene Microarray Shared Resource, OHSU.
2.3 Realtime RT-PCR
Confirmation of array results was performed using TaqMan chemistry in qRT-PCR. Phenotypic heterogeneity as well as RNA quality profoundly effect gene expression levels. Two additional non-demented subjects, conforming to the same rigorous phenotypic criteria, were included with the original set of subjects, in order to substitute for two non-demented subjects for which RNA had degraded in the interim between the microarray analysis and the validation procedure. Polyadenylated mRNA from the total RNA isolated from frontal cortex was reverse transcribed (Transcriptor RT, Roche Diagnostics Corp, IN) using oligo dT primers (Invitrogen, CA). Specific primers corresponding to the short form of ITSN1 (Hs00495035_g1, Applied Biosystems, TX) were combined with cDNA and dNTPs in a master mix (FastStart DNA Master Hybrid Probes, Roche Diagnostics Corp, IN) and amplified by PCR in a SmartCycler (Cepheid, CA). Human mRNA (Ambion, Inc, Tx ), treated in the same manner was used as the control sample. Because standard housekeeping genes displayed variable expression levels across sample groups, qRT-PCR reference genes were chosen from the results of the HG-U133 Plus 2.0 arrays. Two different genes (POL2RF, RTN2) were chosen based on their lack of differential expression across groups and for their relative levels of expression similar to ITSN1 in the non-demented group. Samples were run in triplicate and the efficiency for each reaction was determined based on linear regression analysis of the exponential phase of the reaction [55]. Relative gene expression of ITSN1 to each reference gene was calculated using the efficiencies and crossing threshold (Ct) of each reaction [52]:
2.4 Statistical analysis
An overview of the entire analytical work flow is provided in Figure 2. Statistical analyses were performed in the R v2.0.1 system for statistical computation ([68], http://www.R-project.org). Packages included in the Bioconductor v1.6 suite of analysis tools for genomic data [24] were utilized for specific analyses, as well as custom scripts.
Figure 2. Analytical Work Flow.

Raw data files were preprocessed and normalized using two different methods. Each data set was analyzed separately by ANOVA (Hypotheses I & II) and Vector Projection (Hypothesis III). Transcripts differentially expressed (DE) in both data sets (q-value < 0.1) were combined into one data set for downstream analysis. DE transcripts were analyzed by χ2 for overrepresentation in categories of interest (chromosome location, known AD linkage regions and Gene Ontology Biological Process categories). Concordance of DE transcripts with two previous studies was investigated.
Hybridized arrays were rigorously evaluated for quality using the Affy package v1.5.8 [23] of the Bioconductor project. Computer-generated graphs of the hybridization intensities across the chips allowed a visual assessment of the consistency of the hybridization reaction. Model-based normalization procedures were used to correct for systematic biases. Scatter plots [19] were used to compare the shapes of the distributions before and after normalization. Post-normalization residual plots were used to assess the model fit across all arrays.
Systematic errors cause technical variation which reduces the power of an array experiment to elucidate true biological variation. To minimize the impact of this variation on data analysis and biological interpretations [29], we used two different low level analysis approaches. Each data set was analyzed separately, allowing us to compare the impact of the low level routines on the downstream analysis. The Robust Multi-chip Analysis (RMA) [29] is a model-based pre-processing algorithm used to correct for probe-level differences. RMA in the Affy package was performed on log-transformed hybridization intensities using RMA background correction, quantile normalization and median polish as a summary statistic. The Variance Stabilization and Calibration (VSN) [28] algorithm of the Affy package is a model-based normalization algorithm that specifically transforms the data such that the variance is independent of the mean intensity. The VSN algorithm was performed on intensity values and summarized using the median polish algorithm.
RMA and VSN processed data sets were analyzed to identify putative differentially expressed genes using Analysis of Variance (ANOVA) with the Linear Models for Microarray data analysis package (LIMMA v1.8.10) [63] of the Bioconductor project. Individual linear models were fitted for each transcript across the groups. The first two hypotheses were formally tested as planned comparisons within this framework.
Because each transcript is tested separately, and given the large number of transcripts on the array, the false positive error rate increases dramatically. Therefore, the q-value statistic [65], a minimum measure of the False Discovery Rate (FDR), was used to correct for multiple testing. The FDR is the number of predicted false positive results out of all significant tests. This measures the significance of each gene, taking into account that thousands of genes are being tested. Q-values were calculated from p-values generated in the LIMMA analysis using the QVALUE package v1.1 for R [65].
For each analysis, the final list of putative differentially expressed genes was defined as those probe sets with a q-value < 0.10 that occurred in both the RMA and VSN normalized data sets, in order to balance statistical rigor with maximal identification of candidate genes and given the discovery framework of this study.
It is noted that in the original experimental design, all three hypotheses were to be formally tested. However, during the QA/QC process for sample quality and hybridization, the loss of samples resulted in the third contrast being underpowered, leading to a different statistical approach for this comparison. Vector Projection is a dimension reduction technique for the rapid identification of genes with particular patterns of expression across groups (Terry Speed, Department of Statistics, University of California, Berkley, and Genetics and Bioinformatics, Walter and Eliza Hall Institute Australia; and Ingrid Lonnstedt, Department of Mathematics, Uppsala University, personal communication to S. McWeeney, [59]). It is useful as an initial exploratory data analysis tool, particularly when limited sample sizes preclude formal trend analysis, as was the case with Hypothesis III. Each gene has a vector of its normalized expression values across time. These values are projected onto the space spanned by the pattern of interest (vector of coefficients or weightings for group). In this case, the pattern of interest was a contrasting expression pattern between Cognitive Reserve (CR) and the other groups (i.e., identify genes up-regulated in CR and down-regulated in the other groups, or vice versa). Projection scores in the extreme tails of the normal Quantile-Quantile (QQ-plot) were used to identify transcripts with the best fit to the pattern of interest. The significance level was set at 0.1 for q-values in all expression analyses due to the gene discovery framework of this study
2.5 Determination of biological significance
All transcripts on the array were annotated for gene name, function, and chromosome location using NetAffx (http://www.affymetrix.com/analysis/index.affx, NCBI build 35). These annotations were then used for subsequent downstream analysis. For overrepresentation analyses (linkage, chromosome bands, GO), all significance levels were set at 0.05.
Transcripts that were differentially expressed in non-demented versus AD subjects (Hypothesis I) were analyzed for overrepresentation in specific chromosome regions in two ways. First, transcripts were annotated for cytogenetic bands and a χ2 test of independence was performed to determine if there was evidence for association of transcript expression and cytogenetic band location. Secondly, transcripts were examined for their presence in a chromosomal region known to be linked or associated with AD from previous studies. Concordant linkage/association regions were identified [6]. The number of differentially expressed transcripts located in these regions was compared to the number of transcripts in these regions on the Affymetrix HGU133 Plus 2 GeneChip array, using a one-tailed Fisher’s exact test to determine if the number of differentially expressed transcripts located in each region was greater than that expected by chance.
Differentially expressed genes identified by ANOVA (q-value < 0.1) were assigned to Biological Process categories of the Gene Ontology (GO) Consortium (http://www.geneontology.org/ August, 2005). The GO is an international effort to define genes and their products using a controlled vocabulary. We used GOSTAT [3] to assess representation of differentially expressed genes in GO Biological Process categories. Identification of pertinent pathways depends on the availability of annotations mapped to the probe set. Differentially expressed genes were compared to all genes on the HG-U133Plus2 GeneChip array, using a 2 × 2 contingency table and counting the number of appearances of each category for differentially expressed genes versus reference genes. The probability that differentially expressed genes fall within a category more often than what would be expected by chance was calculated by χ2 (Fisher’s Exact test if the counts within a category are below 5). FDR was used to correct for multiple testing by controlling for interdependencies among the categories [4] given the hierarchical nature of the GO Ontology.
The Kyoto Encyclopedia of Genes and Genomes (KEGG) database (http://www.genome.jp/kegg/, September, 2005) was used to classify differentially regulated genes into canonical pathways for biological interpretation. Transcripts were annotated for their presence in a KEGG pathway and the significance of the number of genes differentially expressed in each pathway was determined by a one-tailed Fisher’s Exact Test.
2.6 Identification of genes in common across tissues
Comparison of our study with two previously published gene profiling experiments [8,20] was used to identify genes that would reveal common pathophysiological mechanisms. First, differential gene expression related to cognitive decline was determined by combining transcripts differentially regulated in the comparisons of AD versus non-demented subjects in hippocampus [8], entorhinal cortex [20] and frontal cortex (this study). Because Blalock, et al [8] used the Affymetrix HG_U133A GeneChip array, we used a subset of data from the other two studies that corresponded to the Probe IDs found on the Affymetrix HG_U133A GeneChip. Significance was set at p < 0.1 for each data set and the intersection of Affymetrix Probe Ids was defined as the set of transcripts in common. It is noted that we cite p-values rather than q-values for this component as that is what was reported by the other studies. Because there are often multiple transcripts mapping to one gene on the GeneChip array, we also generated a data set of the intersection of differentially expressed genes in common among the three experiments using the annotated gene symbol. Secondly, we compared the transcripts involved in NFT formation (Hypothesis II) with the differentially expressed transcripts obtained by Dunckley et al. [20] from neurons without NFTs from AD subjects versus adjacent neurons with NFTs. The final data set of transcripts involved in NFT formation was defined to be the intersection of Affymetrix HG_U133Plus2 Probe IDs differentially expressed in both data sets.
3. Results
Putative differentially expressed transcripts were identified based on Hypothesis I (extreme cognitive phenotypes) and Hypothesis II (NFT formation) in order to identify genes involved in different, but overlapping, features of age-related pathological processes. Particular attention was focused on differentially expressed genes in chromosomal regions shown to be linked or associated with AD in previous studies [59]. In addition, we used the Gene Ontology (GO) Biological Process categories to identify cellular events influenced by the differentially expressed genes associated with cognitive decline. For the probe sets identified in our analyses, only a subset had available GO annotations (Table 2). The overall level of available gene annotation was 32% of the unique genes annotated for GO Biological Process terms. Subsequent analyses are dependent on these annotations.
Table 2.
Number of differentially expressed genes for each analysisa
| Up Regulated | Down regulated | |||||
|---|---|---|---|---|---|---|
| Cognitive Differences |
NFT Formation |
Cognitive Reserve |
Cognitive Differences |
NFT Formation |
Cognitive Reserve |
|
| Probe IDsb | 3703 | 249 | 50 | 4643 | 279 | 31 |
| Unique Genes | 3664 | 249 | 48 | 4522 | 277 | 14 |
| Annotated Genes | 849 (23%) | 41 (16%) | 23 (47%) | 1771 (39%) | 117 (42%) | 7 (50%) |
| GO IDs | 4227 | 209 | 99 | 8211 | 520 | 44 |
| Unique GO IDs | 965 | 134 | 74 | 1544 | 271 | 41 |
Gene Ontology (GO) Biological process category annotations for the differentially expressed genes in each analysis.
Probe IDs, the number of Affymetrix Probe IDs that were differentially expressed in each analysis; Unique genes, the number of unique genes corresponding to the Probe IDs; Annotated Genes, the number of unique genes that have annotations associated with them in the GO database; GO IDs, the number of appearances of GO IDs associated with the annotated genes; Unique GO IDs, the number of unique GO IDs associated with the annotated genes. Numbers in paratheses indicate the percentage of unique genes that have associated GO annotations.
3.1 Extreme cognitive phenotypes
We identified 8346 transcripts, representing 5096 genes, that were differentially expressed (q < 0.1) between non-demented and AD subjects (Hypothesis 1, Figure 1B) (Supplemental Table 1). Cytogenetic band annotations were available for 6857 transcripts, of which 339 (4.9%) were located in regions with higher numbers of differentially expressed transcripts than expected by chance (p < 0.05, Supplemental Table 2). Ten cytogenetic bands contained more differentially regulated transcripts than would be expected by chance (p < 0.05, Supplemental Table 2).
All 8346 differentially expressed transcripts were annotated for location in a genomic region shown previously to be linked or associated with AD [6] (Supplemental Table 1). Of the total 8346, 873 transcripts were located within the sixteen linkage regions (Table 3). Of the transcripts up-regulated in AD, 264 are located in linkage regions. The most significant up-regulated transcript (35776_at) is the short form of Intersectin 1 (ITSN1), located in linkage region 21q22.1-q22.2. Affymetrix probe sets allow comparison of specific alternative transcripts in differential gene expression. For this gene, a different probe set interrogating the short form is also significantly up-regulated (209297_at, q = 0.01) but the long form is not differentially expressed (q = 0.25). These results were confirmed by qRT-PCR (Supplemental Figure 1) where the short form of ITSN1 is up-regulated in AD relative to two different reference genes (p = 0.009 and p= 0.025). The long form was not differentially expressed (data not shown). The most significant down-regulated transcript, ATP6V1G2, is also located in a linkage region, 6p21.3.
Table 3.
Differentially expressed transcripts located in genomic regions linked to Alzheimer’s diseasea
| # of transcripts |
|||
|---|---|---|---|
| Linkage Regions | # DEb | # on chipc | p-valued |
| 1p36 | 106 | 808 | 0.99 |
| 1q23-31 | 78 | 511 | 0.70 |
| 2p23-24 | 49 | 285 | 0.43 |
| 4q35 | 15 | 84 | 0.44 |
| 5p13-15 | 64 | 325 | 0.12 |
| 6p21 | 92 | 750 | 0.99 |
| 6q15-16 | 27 | 112 | 0.05 |
| 6q25-27 | 46 | 280 | 0.55 |
| 9p21 | 11 | 67 | 0.56 |
| 9q22 | 26 | 219 | 0.96 |
| 10q21-22 | 55 | 319 | 0.42 |
| 10q25 | 22 | 120 | 0.37 |
| 12p11-12 | 30 | 219 | 0.86 |
| 19q13 | 144 | 1256 | 1.00 |
| 21q21-22 | 66 | 499 | 0.96 |
| Xp11-21 | 42 | 321 | 0.94 |
Linkage regions are reproduced from Bertram and Tanzi [6]. Transcripts differentially expressed (DE) between non-demented and AD subjects (hypothesis I) were compared for overrepresentation in linkage regions.
DE, number of transcripts differentially expressed at q < 0.1 by ANOVA that are located in the linkage region
Number of transcripts on the chip that are located in the linkage region
p-values are from Fisher’s Exact test comparing transcripts DE at q < 0.1 to all transcripts on the Affymetrix HGU133Plus2 GeneChip in each linkage region.
Cognitive decline, represented by AD subjects in our analysis, reveals a massive restructuring of cellular physiology (Table 4). Many of the most significant up-regulated categories are related to regulation of cellular functions. Categories related to transcription and its regulation, including chromatin modification, are among the most highly represented. Transcripts for actin-related processes and phosphate transport are also up-regulated.
Table 4.
Biological process categories significantly overrepresented in Cognitive Differences Hypothesis (non-demented vs. AD)
| A. up regulated in AD | |||
|---|---|---|---|
| Category | # genes DEa | # genes on chipb |
FDRc |
| regulation of cellular physiological process | 208 | 2252 | 3.21E-05 |
| regulation of biological process | 231 | 2578 | 3.21E-05 |
| regulation of cellular process | 215 | 2365 | 3.21E-05 |
| regulation of physiological process | 214 | 2376 | 6.34E-05 |
| regulation of transcription, DNA dependent | 149 | 1533 | 6.35E-05 |
| regulation of transcription | 154 | 1598 | 6.35E-05 |
| regulation of nucleic acid metabolism | 155 | 1620 | 8.39E-05 |
| regulation of cellular metabolism | 157 | 1650 | 8.94E-05 |
| transcription | 159 | 1684 | 0.000115 |
| transcription, DNA-dependent | 151 | 1587 | 0.000137 |
| regulation of metabolism | 159 | 1733 | 0.000752 |
| negative regulation of cellular physiological process | 48 | 384 | 0.0011 |
| actin filament-based process | 17 | 88 | 0.00146 |
| negative regulation of physiological process | 49 | 412 | 0.00451 |
| negative regulation of cellular process | 49 | 416 | 0.0059 |
| chromatin modification | 16 | 87 | 0.00717 |
| actin cytoskeleton organization and biogenesis | 16 | 77 | 0.0114 |
| negative regulation of biological process | 51 | 456 | 0.0189 |
| phosphate transport | 14 | 78 | 0.0363 |
| nucleic acid metabolism | 205 | 2502 | 0.0418 |
| B. Down regulated in AD | |||
|---|---|---|---|
| Category | # genes | # genes on chip |
FDR |
| coenzyme metabolism | 65 | 124 | 1.69E-32 |
| cofactor metabolism | 70 | 145 | 1.42E-30 |
| oxidative phosphorylation | 41 | 65 | 2.47E-27 |
| coenzyme biosynthesis | 41 | 81 | 1.25E-18 |
| cofactor biosynthesis | 45 | 96 | 6.15E-18 |
| biosynthesis | 217 | 919 | 3.27E-17 |
| ribonucleotide biosynthesis | 34 | 69 | 1.76E-14 |
| nucleoside phosphate metabolism | 25 | 42 | 1.76E-14 |
| ATP biosynthesis | 25 | 42 | 1.76E-14 |
| ATP coupled proton transport | 23 | 38 | 1.30E-13 |
| energy coupled proton transport, down electrochemical gradient |
23 | 38 | 1.30E-13 |
| ribonucleotide metabolism | 34 | 72 | 1.58E-13 |
| ATP metabolism | 25 | 44 | 1.76E-13 |
| group transfer coenzyme metabolism | 28 | 54 | 4.57E-13 |
| ribonucleotide triphosphate biosynthesis | 27 | 51 | 4.57E-13 |
| purine ribonucleotide triphosphate biosynthesis | 27 | 51 | 4.57E-13 |
| purine nucleoside triphosphate biosynthesis | 27 | 51 | 4.57E-13 |
| nucleoside triphosphate metabolism | 27 | 52 | 1.27E-12 |
| generation of precursor metabolites and energy | 128 | 504 | 1.33E-12 |
| intracellular transport | 114 | 433 | 1.63E-12 |
| cellular biosynthesis | 183 | 807 | 2.29E-12 |
| ribonucleoside triphosphate metabolism | 27 | 53 | 2.55E-12 |
| purine ribonucleoside triphosphate metabolism | 27 | 53 | 2.55E-12 |
| purine nucleoside triphosphate metabolism | 27 | 53 | 2.55E-12 |
| purine ribonucleotide biosynthesis | 30 | 64 | 7.52E-12 |
| purine nucleotide biosynthesis | 31 | 68 | 1.18E-11 |
| nucleoside triphosphate metabolism | 27 | 55 | 1.59E-11 |
| establishment of protein localization | 108 | 417 | 2.77E-11 |
| purine ribonucleotide metabolism | 30 | 66 | 3.22E-11 |
| purine nucleotide metabolism | 31 | 70 | 4.56E-11 |
| purine nucleotide metabolism | 107 | 415 | 4.80E-11 |
| protein transport | 42 | 113 | 1.10E-10 |
| nucleotide biosynthesis | 108 | 425 | 1.23E-10 |
| hydrogen transport | 29 | 65 | 1.86E-10 |
| proton transport | 28 | 64 | 1.19E-09 |
| nucleotide metabolism | 51 | 159 | 2.90E-09 |
| intracellular protein transport | 74 | 271 | 7.39E-09 |
| aerobic respiration | 18 | 27 | 5.76E-08 |
| cellular respiration | 18 | 29 | 3.12E-07 |
| ATP synthesis coupled electron transport | 16 | 25 | 1.28E-06 |
| metabolism | 933 | 6083 | 1.75E-06 |
| translation | 42 | 138 | 1.75E-06 |
| RNA metabolism | 82 | 340 | 1.75E-06 |
| ATP synthesis coupled electron transport | 15 | 23 | 2.41E-06 |
| acety-CoA metabolism | 15 | 24 | 5.36E-06 |
| main pathways of carbohydrate metabolism | 29 | 84 | 5.82E-06 |
| energy derivation by oxidation of organic compounds | 38 | 127 | 1.61E-05 |
| tricarboxylic acid cycle | 13 | 20 | 2.10E-05 |
| acety-CoA catabolism | 13 | 20 | 2.10E-05 |
| coenzyme catabolism | 13 | 20 | 2.10E-05 |
| cofactor catabolism | 14 | 23 | 2.23E-05 |
| secretory pathway | 35 | 116 | 3.75E-05 |
| cellular metabolism | 869 | 5712 | 6.16E-05 |
| macromolecule metabolism | 462 | 2830 | 9.62E-05 |
| RNA processing | 63 | 266 | 0.000178 |
| secretion | 40 | 146 | 0.000178 |
| protein folding | 49 | 192 | 0.000189 |
| mitochondrial electron transport, NADH to ubiquinone |
12 | 20 | 0.000191 |
| mRNA metabolism | 44 | 167 | 0.000211 |
| cellular macromolecule metabolism | 436 | 2674 | 0.000251 |
| cellular physiological process | 1164 | 7955 | 0.000273 |
| protein biosynthesis | 95 | 455 | 0.000434 |
| RNA splicing, via transesterif | 26 | 83 | 0.000452 |
| nuclear mRNA splicing, via spliceosome | 26 | 83 | 0.000452 |
| RNA splicing, via transesterif | 26 | 83 | 0.000452 |
| electron transport | 70 | 312 | 0.000476 |
| establishment of localization | 305 | 1803 | 0.000597 |
| mRNA processing | 39 | 147 | 0.000626 |
| transport | 304 | 1801 | 0.000739 |
| localization | 305 | 1810 | 0.000823 |
| RNA splicing | 31 | 111 | 0.00151 |
| protein targeting | 31 | 111 | 0.00151 |
| biopolymer metabolism | 235 | 1361 | 0.00199 |
| macromolecule biosynthesis | 102 | 513 | 0.00205 |
| Golgi vesicle transport | 16 | 44 | 0.00229 |
| protein-mitochondrial targeting | 10 | 18 | 0.00292 |
| sterol biosynthesis | 12 | 25 | 0.00316 |
| primary metabolism | 815 | 5466 | 0.00606 |
| protein metabolism | 400 | 2514 | 0.00833 |
| mitochondrial organization and biogenesis | 8 | 14 | 0.0141 |
| translational initiation | 16 | 49 | 0.0175 |
| cellular protein metabolism | 394 | 2496 | 0.0193 |
| inner mitochondrial membrane organization and biogenesis |
5 | 6 | 0.0206 |
| mitochondrial inner membrane protein import | 5 | 6 | 0.0206 |
| regulated secretory pathway | 8 | 15 | 0.0248 |
| quinone cofactor metabolism | 4 | 4 | 0.0275 |
| quinone cofactor biosynthesis | 4 | 4 | 0.0275 |
| ubiquinone biosynthesis | 4 | 4 | 0.0275 |
| ubiquinone metabolism | 4 | 4 | 0.0275 |
| lipid biosynthesis | 39 | 170 | 0.036 |
the number of differentially expressed genes (q< 0.1 by ANOVA) that are members of the category
the number of genes on the Affymetrix GeneChip that are members of the category
the FDR values are from χ2 analysis corrected for multiple testing (see methods)
Widespread down-regulation occurs in energy pathways and nucleic acid-related categories. Additionally, secretory pathways, RNA-related categories including splicing and mRNA processing, many pathways related to protein metabolism including folding, localization, targeting, transport and translation are down-regulated. Transcripts from genes involved in mitochondrial physiology are also down-regulated.
We utilized the KEGG database to place the differentially regulated genes into canonical pathways (Table 5). Of the 5096 differentially expressed genes, 226 were found to be clustered at levels greater than what would be expected by chance in 14 KEGG pathways. Of these, nearly half (45.5%) are involved in energy metabolism (oxidative phosphorylation, ATP synthesis, carbon fixation and CO2 fixation). An additional 18% are involved in genetic information processing (transcription, translation and protein degradation). Carbohydrate (12.8%), amino acid (9.7%) and lipid (2.2%) metabolism are also represented. The percent of differentially expressed genes in each pathway (% abundance) varies from 37.2% - 71.4%. The pathway with the greatest percentage of differentially expressed genes (synthesis and degradation of ketone bodies) has the lowest number of total genes in the pathway. The pathway containing the greatest number of differentially expressed transcripts (50.7%) was oxidative phosphorylation.
Table 5.
Canonical Pathways involved in healthy aging
| Pathway | # genesa |
# genes in pathwayb |
p-valuec | % Ad |
|---|---|---|---|---|
| Oxidative phosphorylation | 66 | 130 | 0.000 | 50.769 |
| Proteasome | 20 | 31 | 0.000 | 64.516 |
| ATP synthesis | 22 | 40 | 0.000 | 55.000 |
| Infection | 18 | 41 | 0.009 | 43.902 |
| Citrate cycle (TCA cycle) | 12 | 25 | 0.014 | 48.000 |
| Synthesis and degradation of ketone bodies | 5 | 7 | 0.015 | 71.429 |
| RNA polymerase | 11 | 23 | 0.019 | 47.826 |
| Carbon fixation | 10 | 22 | 0.037 | 45.455 |
| Phenylalanine | 6 | 11 | 0.041 | 54.545 |
| Butanoate metabolism | 17 | 44 | 0.044 | 38.636 |
| Amyotrophic lateral sclerosis (ALS) | 8 | 17 | 0.049 | 47.059 |
| Reductive carboxylate cycle (CO2 fixation) | 5 | 9 | 0.056 | 55.556 |
| Valine | 16 | 43 | 0.068 | 37.209 |
| Aminoacyl-tRNA biosynthesis | 10 | 25 | 0.088 | 40.000 |
the number of differentially expressed genes (q < 0.1 by ANOVA) that are members of the pathway
the total number of genes in the pathway
p-values are from a one-tailed Fisher’s Exact Test (see methods)
% abundance of differentially expressed genes in that pathway
3.2 Neurofibrillary tangle formation
We identified 528 transcripts, representing 492 genes, which were differentially expressed (q < 0.1) between subjects with low NFT pathology and those with high NFT levels (Hypothesis II, Figure 1B) (Supplemental Table 3). Of these, 98.9% were also differentially regulated in the Extreme Cognitive Phenotypes comparison. The six genes unique to Hypothesis II are close to the 0.1 threshold for significance (data not shown). A total of 49 transcripts were located in linked regions (Supplemental Table 3).
Overrepresentation in GO Biological Process categories reflected the dependence on current annotation. Specifically, the significant categories were dominated by a small number of well studied genes with pleiotropic effects (data not shown).
3.3 Cognitive reserve
Vector projection analysis allowed initial determination of putative candidate genes involved in cognitive reserve. Eleven transcripts, all located outside known AD linkage regions, were identified as possible candidates (Table 6). Of these, only one (GSTT1, involved in glutathione metabolism) was also differentially regulated in the Extreme Cognitive Phenotypes comparison. All other genes are unique to the Cognitive Reserve analysis.
Table 6.
Transcripts with maximum Differences between Group 3 (non-demented with high Braak score) and other Groups
| A. Transcripts with an increased transcript in non-demented, high Braak stage subjects. | |||
|---|---|---|---|
| Probe ID | Gene | Symbol | chromosome location |
| 207369_at | bombesin-like receptor 3 hypothetical gene supported by AK096952; |
BRS3 | Xq26-q28 |
| 226558_at | AK126241; BC068588 | LOC441057 | 4p16.3 |
| 238774_at | Hypothetical protein LOC284058 | LOC284058 | 17q21.31 |
| 201909_at | ribosomal protein S4, Y-linked 1 | RPS4Y1 | Yp11.3 |
| B. Transcripts with a decreased transcript in non-demented, high Braak stage subjects. | |||
|---|---|---|---|
| 203815_at | glutathione S-transferase theta 1 | GSTT1 | 22q11.23 |
| 224588_at | |||
| 227671_at | |||
| 203096_s_at | Rap guanine nucleotide exchange factor (GEF) 2 | RAPGEF2 | 4q32.1 |
| 221728_x_at | |||
| 202917_s_at | S100 calcium binding protein A8 (calgranulin A) | S100A8 | 1q21 |
| 213479_at | neuronal pentraxin II | NPTX2 | 7q21.3-q22.1 |
3.4 Identification of common themes related to cognitive decline
We compared genes identified in this study, using frontal cortex, with genes identified in two other expression studies using hippocampus and entorhinal cortex. Blalock et al [8] compared hippocampal gene expression in non-demented and AD subjects stratified by severity of disease as measured by NFT count and MMSE scores. Dunckley et a l [20] used laser capture microdissection (LCM) to obtain RNA from neurons in entorhinal cortex, and then compared gene expression patterns in NFT-containing neurons and adjacent NFT-free neurons in AD subjects. Neurons without NFTs were also obtained from non-demented subjects for comparison.
In order to identify genes common to the underlying process of cognitive decline, we combined the data sets across the three different tissues (Table 7A and Table 8). Pairwise comparisons for all transcripts on the HG_U133A GeneChip array showed similar concordance with our data and either of the other data sets. Concordance rates among any two data sets varied between 7.1% and 20.8%. A total of 174 transcripts were concordant (FDR 10%) across all three data sets. More stringent criteria (FDR 5%) resulted in a loss of 30% of those transcripts. The overall concordance rate for differentially-regulated transcripts across all three data sets ranged from 1.0% - 3.9%. Of the 18 transcripts located in linkage regions (Table 8), six are involved in intracellular transport (ITSN1, ATP6V1G2, SYNJ1, SYNCRIP, DIRAS2) and three are related to mitochondria (ATP5J, ATP5C1, MRPS10). GO category analysis of the entire concordant transcript IDs demonstrated that the most significantly overrepresented GO category for up-regulated genes was signal transduction (data not shown). Down-regulated transcripts were most notably overrepresented in energy pathways and carbohydrate metabolism (data not shown). If the differentially expressed genes are mapped to gene symbol ID, the number of genes common to all three data sets increases (8.1-36.6%, FDR 10%) (Table 7B and Supplemental Table 4).
Table 7.
Concordance Rates per data set for Affymetrix HG_U133A GeneChip array.a
| A. Intersection using Probe ID | ||||
|---|---|---|---|---|
| 10% FDR | 5% FDR | |||
| UP | DN | UP | DN | |
| Blalockb | 104 (8.4%) | 493 (13.7%) | 55 (9.4%) | 392 (16.7%) |
| Dunckley | 252 (20.4%) | 733 (20.4%) | 117 (19.9%) | 488 (20.8%) |
| Blalock/Dunckley | 451 (10.1%) | 239 (8.4%) | 254 (7.1%) | 141 (10.0%) |
| all 3 data sets | 33 (2.6%) | 141 (3.9%) | 6 (1.0%) | 54 (2.3%) |
| B. Intersection using Gene Symbol | ||
|---|---|---|
| 10% FDR | ||
| UP | DN | |
| Blalockb | 258 (35.5%) | 610 (27.5%) |
| Dunckley | 195 (26.8%) | 812 (36.6%) |
| Blalock/Dunckley | 762 (21.7%) | 554 (14.0%) |
| all 3 data sets | 59 (8.1%) | 274 (12.3%) |
Concordance was determined for each pair of data sets by measuring the intersection of transcripts significantly differentially regulated at 10% and 5% FDR. The number and percentage of transcripts concordant in each comparison is given.
The concordance of each data set with our results, between Blalock, et al and Dunckley, et al, and the concordance among all three data sets is presented.
Table 8.
Transcripts differentially expressed in non-demented versus demented that are common to all data sets.a
| Upregulated in AD | ||||
|---|---|---|---|---|
| Probe ID | Symbol | chromosome locationb |
p-value Blalock et al |
p-value Dunckley et al |
| 35776_at | ITSN1 | 21q22.1-q22.2 | 0.05 | 0.00 |
| 201502_s_at | NFKBIA | 14q13 | 0.01 | 0.00 |
| 202273_at | PDGFRB | 5q31-q32 | 0.07 | 0.00 |
| 201125_s_at | ITGB5 | 3q21.2 | 0.00 | 0.02 |
| 202861_at | PER1 | 17p13.1-17p12 | 0.04 | 0.00 |
| 210473_s_at | GPR125 | 4p15.31 | 0.07 | 0.01 |
| 203685_at | BCL2 | 18q21.33, 18q21.3 | 0.00 | 0.07 |
| CHKB /// | ||||
| 210069_at | CPT1B | 22q13.33 | 0.02 | 0.06 |
| 206766_at | ITGA10 | 1q21 | 0.08 | 0.00 |
| 221527_s_at | PARD3 | 10p11.22-p11.21 | 0.02 | 0.04 |
| 212346_s_at | MXD4 | 4p16.3 | 0.08 | 0.02 |
| 213044_at | ROCK1 | 18q11.1 | 0.10 | 0.03 |
| 203505_at | ABCA1 | 9q31.1 | 0.01 | 0.01 |
| 36829_at | PER1 | 17p13.1-17p12 | 0.03 | 0.00 |
| 217937_s_at | HDAC7A | 12q13.1 | 0.08 | 0.00 |
| 214594_x_at | ATP8B1 | 18q21-q22, 18q21.31 |
0.06 | 0.00 |
| DKFZP586A05 | ||||
| 209703_x_at | 22 | 12q13.12 | 0.04 | 0.00 |
| 205168_at | DDR2 | 1q12-q23 | 0.00 | 0.04 |
| DKFZP434A01 | ||||
| 221191_at | 31 | 7q11.23-q21.1 | 0.02 | 0.02 |
| 203080_s_at | BAZ2B | 2q23-q24 | 0.07 | 0.04 |
| PRKX /// | ||||
| 204060_s_at | PRKY | Xp22.3 , Yp11.2 | 0.00 | 0.01 |
| RHOQ /// | ||||
| 212122_at | LOC284988 | 2p21 , 2q21.1 | 0.00 | 0.03 |
| 209370_s_at | SH3BP2 | 4p16.3 | 0.02 | 0.06 |
| 202724_s_at | FOXO1A | 13q14.1 | 0.00 | 0.01 |
| 205111_s_at | PLCE1 | 10q23 | 0.03 | 0.00 |
| 205288_at | CDC14A | 1p21 | 0.03 | 0.00 |
| 204061_at | PRKX | Xp22.3 | 0.02 | 0.00 |
| 202933_s_at | YES1 | 18p11.31-p11.21 | 0.02 | 0.03 |
| 209108_at | TM4SF6 | Xq22 | 0.01 | 0.00 |
| Downregulated in AD | ||||
|---|---|---|---|---|
| Probe ID | Symbol | chromosome location |
p-value Blalock et al |
p-value Dunckley et al |
| 214762_at | ATP6V1G2 | 6p21.3 | 0.01 | 0.02 |
| 221020_s_at | MFTC | 8q22.3 | 0.06 | 0.00 |
| 210976_s_at | PFKM | 12q13.3 | 0.02 | 0.04 |
| 219443_at | C20orf13 | 20p12.1 | 0.07 | 0.01 |
| 203889_at | SGNE1 | 15q13-q14 | 0.05 | 0.09 |
| 202325_s_at | ATP5J | 21q21.1 | 0.09 | 0.03 |
| 201304_at | NDUFA5 | 7q32 | 0.01 | 0.09 |
| 204675_at | SRD5A1 | 5p15 | 0.08 | 0.00 |
| 222005_s_at | GNG3 | 11p11 | 0.03 | 0.00 |
| 200720_s_at | ACTR1A | 10q24.32 | 0.06 | 0.00 |
| 208934_s_at | LGALS8 | 1q42-q43 | 0.02 | 0.01 |
| 218291_at | MAPBPIP | 1q22 | 0.02 | 0.06 |
| 206290_s_at | RGS7 | 1q43 | 0.01 | 0.00 |
| 206489_s_at | DLGAP1 | 18p11.3 | 0.03 | 0.01 |
| 218488_at | EIF2B3 | 1p34.1 | 0.03 | 0.02 |
| 213849_s_at | PPP2R2B | 5q31-5q32 | 0.01 | 0.02 |
| 215161_at | CAMK1G | 1q32-q41 | 0.00 | 0.04 |
| 204471_at | GAP43 | 3q13.1-q13.2 | 0.03 | 0.00 |
| 200039_s_at | PSMB2 | 1p34.2 | 0.03 | 0.01 |
| 213011_s_at | TPI1 | 12p13 | 0.02 | 0.02 |
| 206055_s_at | SNRPA1 | 15q26.3 | 0.07 | 0.09 |
| 209583_s_at | CD200 | 3q12-q13 | 0.03 | 0.08 |
| 203218_at | MAPK9 | 5q35 | 0.09 | 0.09 |
| 211023_at | PDHB | 3p21.1-p14.2 | 0.00 | 0.02 |
| 210027_s_at | APEX1 | 14q11.2-q12 | 0.02 | 0.03 |
| 221471_at | TDE1 | 20q13.1-13.3 | 0.02 | 0.01 |
| 218332_at | BEX1 | Xq21-q23 | 0.06 | 0.00 |
| 213666_at | 6-Sep | Xq24 | 0.00 | 0.03 |
| 210014_x_at | IDH3B | 20p13 | 0.04 | 0.03 |
| 201569_s_at | CGI-51 | 22q13.31 | 0.07 | 0.00 |
| 211276_at | TCEAL2 | Xq22.1-q22.3 | 0.02 | 0.00 |
| 202634_at | POLR2K | 8q22.2 | 0.02 | 0.01 |
| 207142_at | KCNJ3 | 2q24.1 | 0.10 | 0.08 |
| 221482_s_at | ARPP-19 | 15q21.2 | 0.05 | 0.06 |
| 206342_x_at | IDS | Xq28 | 0.10 | 0.00 |
| 200822_x_at | TPI1 | 12p13 | 0.04 | 0.03 |
| 212990_at | SYNJ1 | 21q22.2 | 0.06 | 0.02 |
| 208870_x_at | ATP5C1 | 10p15.1 | 0.03 | 0.08 |
| 200613_at | AP2M1 | 3q28 | 0.03 | 0.00 |
| 218193_s_at | GOLT1B | 12p12.1 | 0.08 | 0.00 |
| 217948_at | DKFZP564B147 | Xq26.3 | 0.02 | 0.02 |
| 202961_s_at | ATP5J2 | 7q22.1 | 0.10 | 0.02 |
| 202279_at | C14orf2 | 14q32.33 | 0.01 | 0.00 |
| 218404_at | SNX10 | 7p15.2 | 0.02 | 0.02 |
| 204744_s_at | IARS | 9q21 | 0.05 | 0.04 |
| 202596_at | ENSA | 1q21.2 | 0.00 | 0.09 |
| 209075_s_at | NIFUN | 12q24.1 | 0.03 | 0.08 |
| 205549_at | PCP4 | 21q22.2 | 0.01 | 0.01 |
| 218813_s_at | SH3GLB2 | 9q34 | 0.07 | 0.01 |
| 208308_s_at | GPI | 19q13.1 | 0.09 | 0.05 |
| 208745_at | ATP5L | 11q23.3 | 0.04 | 0.04 |
| 200001_at | CAPNS1 | 19q13.12 | 0.10 | 0.07 |
| 208906_at | BSCL2 | 11q12-q13.5 | 0.08 | 0.08 |
| 206089_at | NELL1 | 11p15.2-p15.1 | 0.00 | 0.08 |
| 205711_x_at | ATP5C1 | 10p15.1 | 0.01 | 0.02 |
| 219196_at | SCG3 | 15q21 | 0.04 | 0.05 |
| 209025_s_at | SYNCRIP | 6q14-q15 | 0.00 | 0.00 |
| 212826_s_at | SLC25A6 | Xp22.32 and Yp | 0.01 | 0.01 |
| 209482_at | POP7 | 7q22 | 0.04 | 0.08 |
| 211698_at | CRI1 | 15q21.1-q21.2 | 0.01 | 0.10 |
| 201849_at | BNIP3 | 10q26.3 | 0.03 | 0.00 |
| 201797_s_at | VARS2 | 6p21.3 | 0.04 | 0.07 |
| 205899_at | CCNA1 | 13q12.3-q13 | 0.08 | 0.07 |
| 201662_s_at | ACSL3 | 2q34-q35 | 0.04 | 0.02 |
| 209056_s_at | CDC5L | 6p21 | 0.01 | 0.02 |
| 201524_x_at | UBE2N | 12q22 | 0.01 | 0.04 |
| 219619_at | DIRAS2 | 9q22.2 | 0.04 | 0.06 |
| 206233_at | B4GALT6 | 18q11 | 0.05 | 0.00 |
| 213333_at | MDH2 | 7p12.3-q11.2 | 0.02 | 0.09 |
| 203079_s_at | CUL2 | 10p11.21 | 0.02 | 0.03 |
| 213902_at | ASAH1 | 8p22-p21.3 | 0.04 | 0.01 |
| 201400_at | PSMB3 | 17q12 | 0.02 | 0.01 |
| 215691_x_at | C1orf41 | 1p32.1-p33 | 0.01 | 0.00 |
| 217773_s_at | NDUFA4 | 7p21.3 | 0.01 | 0.05 |
| 201568_at | QP-C | 5q31.1 | 0.06 | 0.02 |
| 206857_s_at | FKBP1B | 2p23.3 | 0.08 | 0.00 |
| 214436_at | FBXL2 | 3p23 | 0.03 | 0.01 |
| 208977_x_at | TUBB2 | 6p25 | 0.03 | 0.06 |
| 200650_s_at | LDHA | 11p15.4 | 0.01 | 0.00 |
| 216120_s_at | ATP2B2 | 3p25.3 | 0.01 | 0.00 |
| 212296_at | PSMD14 | 2q24.2 | 0.07 | 0.00 |
| 221437_s_at | MRPS15 | 1p35-p34.1 | 0.09 | 0.01 |
| 201381_x_at | CACYBP | 1q24-q25 | 0.07 | 0.00 |
| 206381_at | SCN2A2 | 2q23-q24 | 0.09 | 0.04 |
| 209849_s_at | RAD51C | 17q22-q23 | 0.00 | 0.03 |
| 206949_s_at | RUSC1 | 1q21-q22 | 0.03 | 0.00 |
| 208975_s_at | KPNB1 | 17q21.32 | 0.04 | 0.08 |
| 210406_s_at | RAB6A /// | 11q13.3 , 2q31 | 0.01 | 0.01 |
| RAB6C | ||||
| 200027_at | NARS | 18q21.2-q21.3 | 0.03 | 0.00 |
| 209914_s_at | NRXN1 | 2p16.3 | 0.08 | 0.02 |
| 214005_at | GGCX | 2p12 | 0.06 | 0.00 |
| 201597_at | COX7A2 | 6q12 | 0.05 | 0.00 |
| 213366_x_at | ATP5C1 | 10p15.1 | 0.01 | 0.02 |
| 219073_s_at | OSBPL10 | 3p22.3 | 0.00 | 0.00 |
| 208905_at | CYCS | 7p15.3 | 0.03 | 0.00 |
| 217801_at | ATP5E | 20q13.32 | 0.03 | 0.05 |
| 202309_at | MTHFD1 | 14q24 | 0.00 | 0.00 |
| 203894_at | TUBG2 | 17q21 | 0.00 | 0.02 |
| 209877_at | SNCG | 10q23.2-q23.3 | 0.02 | 0.09 |
| 216903_s_at | CBARA1 | 10q22.1 | 0.09 | 0.01 |
| 202260_s_at | STXBP1 | 9q34.1 | 0.08 | 0.00 |
| 201837_s_at | STAF65(gamma) | 2pter-p25.1 | 0.00 | 0.00 |
| 218226_s_at | NDUFB4 | 3q13.33 | 0.06 | 0.00 |
| 207081_s_at | PIK4CA | 22q11.21 | 0.02 | 0.07 |
| 209142_s_at | UBE2G1 | 1q42, 17p13.2 | 0.07 | 0.00 |
| 220045_at | NEUROD6 | 7p14.3 | 0.01 | 0.02 |
| 202090_s_at | UQCR | 19p13.3 | 0.03 | 0.00 |
| 200734_s_at | ARF3 | 12q13 | 0.01 | 0.00 |
| 213726_x_at | TUBB2 | 6p25 | 0.02 | 0.04 |
| 201047_x_at | RAB6A | 11q13.3 | 0.06 | 0.07 |
| 204141_at | TUBB2 | 6p25 | 0.02 | 0.00 |
| 210016_at | MYT1L | 2p25.3 | 0.01 | 0.03 |
| 208936_x_at | LGALS8 | 1q42-q43 | 0.01 | 0.00 |
| 205691_at | SYNGR3 | 16p13 | 0.01 | 0.00 |
| 203001_s_at | STMN2 | 8q21.13 | 0.09 | 0.00 |
| 218732_at | Bit1 | 17q23.2 | 0.10 | 0.05 |
| 205113_at | NEF3 | 8p21 | 0.01 | 0.05 |
| 218106_s_at | MRPS10 | 6p21.1-p12.1 | 0.06 | 0.05 |
| 203846_at | TRIM32 | 9q33.1 | 0.01 | 0.00 |
| 209001_s_at | ANAPC13 | 3q22.1 | 0.02 | 0.00 |
| 203797_at | VSNL1 | 2p24.3 | 0.01 | 0.07 |
| 203303_at | TCTE1L | Xp21 | 0.05 | 0.00 |
| 211071_s_at | AF1Q | 1q21 | 0.09 | 0.00 |
| 204247_s_at | CDK5 | 7q36 | 0.01 | 0.04 |
| 221288_at | GPR22 | 7q22-q31.1 | 0.01 | 0.07 |
| 201434_at | TTC1 | 5q32-q33.2 | 0.03 | 0.00 |
| 212976_at | TA-LRRP | 1p22.2 | 0.03 | 0.07 |
| 203667_at | TBCA | 5q14.1 | 0.01 | 0.05 |
| 200625_s_at | CAP1 | 1p34.2 | 0.02 | 0.00 |
| 218467_at | TNFSF5IP1 | 18p11.21 | 0.02 | 0.01 |
| 204465_s_at | INA | 10q24.33 | 0.01 | 0.00 |
| 202754_at | R3HDM | 2q21.3 | 0.02 | 0.01 |
| 215518_at | STXBP5L | 3q13.33 | 0.05 | 0.00 |
| 222125_s_at | PH-4 | 3p21.31 | 0.02 | 0.02 |
| 206051_at | ELAVL4 | 1p34 | 0.09 | 0.03 |
| 202336_s_at | PAM | 5q14-q21 | 0.10 | 0.00 |
| 202022_at | ALDOC | 17cen-q12 | 0.02 | 0.08 |
| 201980_s_at | RSU1 | 10p13 | 0.01 | 0.01 |
| 211069_s_at | SUMO1 | 2q33 | 0.05 | 0.08 |
| 201527_at | ATP6V1F | 7q32 | 0.06 | 0.05 |
Differentially expressed transcripts are q < 0.1 from ANOVA
Values in bold are chromosomal regions linked to AD
Dunckley et al [20] compared neurons with and without NFTs in AD subjects in order to investigate NFT formation. We compared low Braak stage subjects with high Braak stage subjects regardless of cognitive function for the same purpose. Transcripts differentially expressed in both data sets showed 39 (9.8%) concordant transcripts (Supplemental Table 5). Most are down-regulated in subjects with higher numbers of tangles (74.3%).
4. Discussion
Results of our human transcriptome profiling confirm many of the sweeping transcriptional differences associated with cognitive decline that have been previously documented, and implicate genes involved in transcriptional regulation, energy pathways, ion homeostasis dysregulation, apoptosis, and synaptic activity [8,14,20,37,73]. In addition, our results reveal significant up-regulation of actin-related processes and down-regulation of translation, RNA processing and localization, and vesicle mediated transport (Tables 4 and 5). This study identifies candidate genes, located in linkage regions, which had not been previously implicated in cognitive decline.
One difficulty with microarray results is that, because biochemical networks connect multiple physiological processes, a plausible biological mechanism for the implication of many genes can often be suggested. This is compounded when studying a complex trait impacting multiple cellular functions. We found that interpreting gene expression results in the context of genetic mapping studies and functional annotation allowed a more informed approach to identifying candidate genes in brain aging.
4.1 Extreme cognitive differences
We localized differentially expressed genes in healthy aging versus cognitive decline with reference to cytogenetic band annotations. In 14 genomic regions, more transcripts were differentially expressed than would be expected by chance (Supplemental Table 2), indicating possible co-regulation of genes in these regions by trans-acting factors. We identified functional changes of genes located in known AD linkage regions through differences in expression to identify cis-acting DNA polymorphisms. AD linkage regions did not overlap with the 14 genomic regions, indicating that the greater number of genes located within linkage regions was not coordinately regulated by trans-acting factors. The majority (87%) of transcripts were not found in linkage regions. However, differentially regulated genes located within the known AD linkage regions may contain cis-acting DNA polymorphisms that affect their gene expression and contribute to the linkage signal. Our results identified 873 possible candidate transcripts.
Biological annotation of these transcripts revealed that a number of these genes are involved in synaptic dysfunction, which has been shown to be an early process in cognitive decline. Synapse loss correlates positively with cognitive decline and indeed may occur prior to clinical signs [60]. Enlarged endosomes appear early in the course of AD pathology and are not present in healthy aging [11]. While many synapse-specific genes and vesicle-mediated transport genes are generally down-regulated in our study, we have identified a significantly up-regulated transcript, ITSN1, which is located in linkage region 21q22 (Supplemental Table 1). ITSN1 has not been studied in cognitive decline, although it has been postulated that ITSN1 might affect APP processing [48] and vesicular trafficking in AD [33]. Analysis of the other published data sets also identified ITSN1 as consistently up-regulated (Supplemental Table 4).
ITSN1 is a scaffold protein involved in synaptic vesicle recycling [42] and caveolae internalization [53]. Overexpression of ITSN1 blocks clathrin-mediated endocytosis [54], internalization of caveolae [53] and Ras activation [69] (Figure 3). Inhibition of endocytosis has been shown to increase soluble APP alpha release [10,13,57]. The fundamental significance of ITSN1 is its role in linking the endocytic machinery at the synapse with both the actin cytoskeleton and signal transduction pathways. Signaling pathways are regulated through ITSN1 binding of SOS and activation of RAS [69] and Elk1 activation through a RAS-independent process involving JNK[45]. Rho/Ras signaling is related to actin cytoskeleton through the protein kinase ROCK1 [38] that is also up-regulated in AD brain tissue (Supplemental Tables 1 and 4). The consistent findings across expression studies and the functional consequences of its overexpression provide compelling evidence for a central role for ITSN1 in the pathogenic mechanisms of cognitive decline.
Figure. 3. Altered metabolism due to increased expression of Intersectin1.
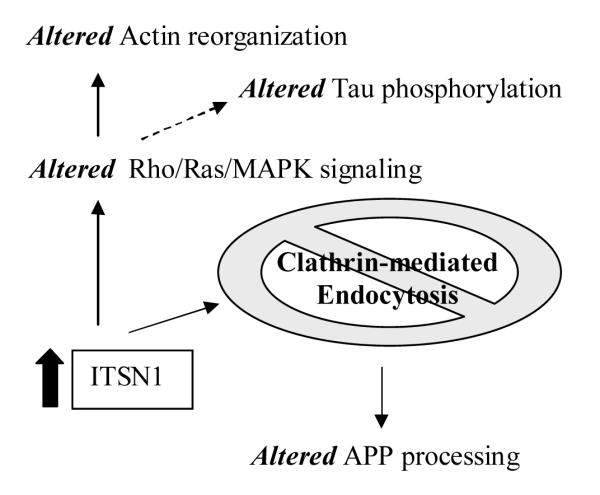
Solid arrows are direct consequences of higher levels of ITSN1 in published reports. Dashed arrow refers to the downstream effects of the MAPK signaling cascade on the phosphorylation of Tau.
Down-regulated transcripts include many genes involved in synaptic function (Supplemental Table 1) including synaptojanin 1 (SYNJ1) located in linkage region 21q22.2. The most significantly down-regulated transcript across all brain tissues is ATP6V1G2 (Supplemental Tables 1 and 4) located in linkage region 6p21.3. ATP6V1G2 is a membrane bound vacuolar-type ATPase that maintains the acidity of lysosomal vesicles [67]. Luminal acidification by V-ATPases is required for proper intracellular vesicle sorting and degradation of endocytosed proteins. The relationship of ATP6V1G2 to the regulation of synaptic vesicle recycling or brain aging is unknown.
In addition to appropriate retrograde transport of endosomes, synaptic plasticity is also dependent on the anterograde transport and localization of specific mRNA transcripts to the synapse. Protein synthesis occurring at the synapse is considered to be a fundamental part of healthy synaptic function. Dysregulation of microtubule subunits and molecular motors is seen in cognitive decline (Supplemental Table 1) and down-regulation of all aspects of RNA function and transport is widespread in cognitive decline (Table 4). Two transcripts related to proper mRNA localization and translation at the synapse are located in linked regions. Synaptotagmin binding, cytoplasmic RNA interacting protein (SYNCRIP, 6q14-15 ) is a component of mRNA granules [2] binding mRNA and ensuring proper anterograde transport [31]. SYNCRIP interacts with various isoforms of the membrane-bound synaptotagmin [44]. Molecular motor trafficking on microtubules is postulated to be blocked by protein aggregates [56]. Failure of protein aggregates to be degraded through ubiquitin-mediated proteolysis has been shown to occur in AD [17,35] and local protein degradation through the ubiquitin-proteosome pathway has been shown to affect synaptic plasticity [25]. Many transcripts involved in this pathway are down-regulated in cognitive decline (Supplemental Table 1). A recent study suggests that cell death due to polyglutamine protein aggregates can be reduced by overexpression of RNA binding protein 3 (RBM3) [34]. RBM3 and its related gene CIRBP are down regulated in AD (Supplemental Table 1). These proteins are involved in response to stress [71]. RBM3 is located in a linkage region (Xp11.2) and has recently been shown to decrease microRNA (miRNA) levels with a parallel increase in protein synthesis [18]. MicroRNAs are small, highly conserved RNA molecules that regulate the expression of messenger RNA by binding to the 3′-untranslated regions (3′-UTR). Each miRNA is thought to regulate multiple genes and miRNA regulation is thought to influence many diverse cellular processes [41]. The contribution of miRNA regulation to cognitive decline is unknown, although miRNAs are postulated to be involved in processes related to synaptic plasticity [40].
4.2 NFT formation
NFT formation precedes cognitive decline and is correlated with severity of dementia in AD [7]. We identified a subset of genes that were differentially regulated in non-demented versus AD subjects (Hypothesis I) and subjects with low versus high tangle burden (Hypothesis II) (Supplemental Table 3). Overall, fewer transcripts were related to NFT formation and these had higher q-values than transcripts identified in the comparison of Extreme Cognitive Phenotypes (Supplemental Tables 1 and 3). This relationship is evident in other gene profiling experiments in which more transcripts were correlated with cognitive scores than NFTs [8] and more transcripts were differentially expressed in non-demented versus AD neurons than in AD non-NFT neurons versus AD NFT neurons [20]. Genes identified in this comparison may be more relevant to initial stages of brain pathology during NFT formation.
4.3 Cognitive reserve
Discovery of genes involved in individual brain capacity to tolerate, or circumvent, neuropathologic damage during aging would increase our ability to predict risk of dementia and determine risk-reducing factors. Non-demented individuals with heavy NFT burden may have more versatile neuronal processing mechanisms than individuals who develop dementia [64]. Although the limited sample size precluded statistical analyses, exploratory data analysis uncovered several genes with different patterns of expression in these subjects (Table 6).
Non-demented individuals with high Braak scores (Group 3) exhibited increased expression of a ribosomal structural gene (RPS4Y1) and the neuropeptide receptor bombesin-like receptor 3 (BRS3), compared with non-demented subjects with lower Braak scores (Groups 1 and 2) and AD subjects (Group 4). Bombesin-like neuropeptides are a family of G-protein-coupled receptors that have pleiotropic physiological effects, such as increasing hypertension and insulin secretion, stimulating gastric secretion, and modulating smooth muscle contraction [49]. Mice lacking BRS3 show mild obesity associated with hypertension, impairment of glucose tolerance and insulin resistance[50]. Dysregulated glucose metabolism has been shown to occur in AD pathology[16,47]. Our results suggest the possibility that individual protection of brain tissue from the pathological effects of NFTs results from regulation of protein synthesis and glucose metabolism.
Of the genes that show lower expression in Group 3 subjects, one has been previously studied in AD. Glutathione S-transferase theta 1 (GSTT1) is involved in detoxification of environmental toxins, but its role in susceptibility to AD is inconclusive [5,66]. Two genes are possibly involved in inflammatory processes. S100A8 is a subunit of Calprotectin, a calcium- and zinc-binding protein up-regulated in many inflammatory conditions[26]. Neuronal pentraxin II (NPTX2) is postulated to be involved in uptake of pro-inflammatory molecules[27]. Rat NPTX2 is regulated by synaptic activity and promotes neuronal migration [70]. Rap guanine nucleotide exchange factor 2 (RAPGEF2) is also involved in synaptic physiology through binding to a synaptic scaffold protein, and is hypothesized to link synaptic plasma membrane vesicles with RAS signal transduction [51]. These results further illustrate the central roles of anti-inflammatory processes and regulation of synaptic activity in maintaining healthy neuronal function. Additional experiments with larger sample sizes will be required to confirm the role of these genes in protection from brain tissue damage.
4.4 Genes common to the pathological process across all tissues
Determination of concordance across three transcriptomal studies allowed us to identify 174 transcripts common to cognitive decline across entorhinal cortex, hippocampus and frontal cortex. Synaptic plasticity—related genes are dysregulated in all three tissues. Likewise, down-regulation of energy pathways and ubiquitin-mediated protein degradation is widespread. Genes that function in these pathways are likely to be important in processes underlying the development of AD pathology. It is important to note that differentially expressed transcripts unique to each study may be the result of tissue specificity or non-biological differences in study design. Continued comparisons across studies and tissues will allow us to further elucidate the underlying genetic mechanisms of cognitive decline.
4.5 General considerations for transcriptomal studies
Central to the interpretation of biological significance of a particular differentially expressed transcript is the quality of the annotations obtained from publicly available databases. Often, complete annotation is not available for all of the transcripts interrogated. The annotation that does exist is dynamic and constantly updated. Finally, while it is transcripts that are interrogated on the array, it is common practice to map these transcripts to a gene index (such as Unigene ID). There can often be a loss of information in such a mapping, as it ignores differences at the transcript level. A case in point highlighted in this study is ITSN1, which is commonly found in two isoforms, a short form and a long form. Additionally, over 19 alternatively spliced forms have been identified. Affymetrix GeneChip arrays target both the short and long forms of ITSN1. In all three data sets, it was the short form only (Probe ID 35776_at) that was differentially expressed. This finding was confirmed with qRT-PCR. In the analysis of the microarray data, transcripts for the same gene are often seen as technical replicates, rather than biological variants, such that any gene with discordant ProbeSets is discarded from further analysis. This results in failure to detect unique isoforms and transcripts that may play a key role in the biological process under study.
This highlights an important aspect of the dynamic and complex nature of the annotation process that may not always be appreciated. There has been a great deal of recent debate concerning the reliability of microarray gene expression on the same samples across different platforms [22,39]. A key point that is often missed is that in order to compare the arrays, individual transcripts are mapped to gene indices, due to the fact that different transcripts are interrogated on different platforms. There is an inherent loss of information in this mapping as alternate transcripts (each potentially with different expression patterns) are all mapped to the same gene identifier. Attempting to determine concordance based on gene annotation (such as gene symbol, name or Unigene ID) can be misleading and give overestimates of discordance, as described above.
Validation studies of microarrays using qRT-PCR also can suffer from overestimates of discordance between the arrays and the RT-PCR when primers are not designed to the same targets as the array. Strong correlations are seen between qRT-PCR and microarray results when the same transcript targets are tested [15]. This is clearly demonstrated by ITSN1 in this study, where only one transcript variant is differentially expressed, making primer design even more critical. These issues need to be considered in design of new studies and meta-analysis of existing data.
5. Summary
We have described a gene profiling approach to dissecting the complex phenotypes involved in brain aging. Comparison of our results with two previously published studies using a comparable microarray platform revealed common pathways underlying cognitive decline in three different brain tissues. Novel genes in pathways previously recognized as crucial to healthy brain aging have been identified. Dysregulated genes that are both involved in known AD critical pathways and located in linkage/association regions represent potential candidates for gene association studies.
Supplementary Material
ACKNOWLEDGEMENTS
The Layton Aging and Alzheimer’s Disease Center, NIH grants P30AG08017 and M01RR034 (JK), P3005411 (TM), Medical Research Foundation of Oregon Grant #0418 (PK), Department of Veteran’s Affairs Merit Review Award (JK). Microarray assays were performed in the Affymetrix Microarray Core of the OHSU Gene Microarray Shared Resource.
Disclosure of funding. Dr. Harrington has a significant financial interest in Affymetrix, Inc. This potential conflict of interest has been reviewed and a management plan approved by the OHSU Conflict of Interest in Research Committee has been implemented.
Footnotes
Publisher's Disclaimer: This is a PDF file of an unedited manuscript that has been accepted for publication. As a service to our customers we are providing this early version of the manuscript. The manuscript will undergo copyediting, typesetting, and review of the resulting proof before it is published in its final citable form. Please note that during the production process errors may be discovered which could affect the content, and all legal disclaimers that apply to the journal pertain.
Literature
- [1].Consensus recommendations for the postmortem diagnosis of Alzheimer’s disease. The National Institute on Aging, and Reagan Institute Working Group on Diagnostic Criteria for the Neuropathological Assessment of Alzheimer’s Disease. Neurobiol Aging. 1997;18(4 Supp):S1–2. [PubMed] [Google Scholar]
- [2].Bannai H, Fukatsu K, Mizutani A, Natsume T, Iemura S, Ikegami T, Inoue T, Mikoshiba K. An RNA-interacting protein, SYNCRIP (heterogeneous nuclear ribonuclear protein Q1/NSAP1) is a component of mRNA granule transported with inositol 1,4,5-trisphosphate receptor type 1 mRNA in neuronal dendrites. J Biol Chem. 2004;279(51):53427–34. doi: 10.1074/jbc.M409732200. [DOI] [PubMed] [Google Scholar]
- [3].Beissbarth T, Speed TP. GOstat: find statistically overrepresented Gene Ontologies within a group of genes. Bioinformatics. 2004;20(9):1464–5. doi: 10.1093/bioinformatics/bth088. [DOI] [PubMed] [Google Scholar]
- [4].Benjamini Y, Yekutieli D. The Control of the False Discovery Rate in Multiple Testing under Dependency. The Annal of Statistics. 2001;29(4):1165–88. [Google Scholar]
- [5].Bernardini S, Bellincampi L, Ballerini S, Federici G, Iori R, Trequattrini A, Ciappi F, Baldinetti F, Bossu P, Caltagirone C, Spalletta G. Glutathione S-transferase P1 *C allelic variant increases susceptibility for late-onset Alzheimer disease: association study and relationship with apolipoprotein E epsilon4 allele. Clin Chem. 2005;51(6):944–51. doi: 10.1373/clinchem.2004.045955. [DOI] [PubMed] [Google Scholar]
- [6].Bertram L, Tanzi RE. Alzheimer’s disease: one disorder, too many genes? Human Molecular Genetics. 2004;13 Spec No 1:R135–41. doi: 10.1093/hmg/ddh077. [DOI] [PubMed] [Google Scholar]
- [7].Bierer LM, Hof PR, Purohit DP, Carlin L, Schmeidler J, Davis KL, Perl DP. Neocortical neurofibrillary tangles correlate with dementia severity in Alzheimer’s disease. Arch Neurol. 1995;52(1):81–8. doi: 10.1001/archneur.1995.00540250089017. [DOI] [PubMed] [Google Scholar]
- [8].Blalock EM, Geddes JW, Chen KC, Porter NM, Markesbery WR, Landfield PW. Incipient Alzheimer’s disease: microarray correlation analyses reveal major transcriptional and tumor Suppressor responses. Proc Natl Acad Sci USA. 2004;101(7):2173–8. doi: 10.1073/pnas.0308512100. [DOI] [PMC free article] [PubMed] [Google Scholar]
- [9].Braak H, Braak E. Argyrophilic grain disease: frequency of occurrence in different age categories and neuropathological diagnostic criteria. J Neural Transm. 1998;105(89):801–19. doi: 10.1007/s007020050096. [DOI] [PubMed] [Google Scholar]
- [10].Carey RM, Balcz BA, Lopez-Coviella I, Slack BE. Inhibition of dynamin-dependent endocytosis increases shedding of the amyloid precursor protein ectodomain and reduces generation of amyloid beta protein. BMC Cell Biol. 2005;6:30. doi: 10.1186/1471-2121-6-30. [DOI] [PMC free article] [PubMed] [Google Scholar]
- [11].Cataldo AM, Peterhoff CM, Troncoso JC, Gomez-Isla T, Hyman BT, Nixon RA. Endocytic pathway abnormalities precede amyloid beta deposition in sporadic Alzheimer’s disease and Down syndrome: differential effects of APOE genotype and presenilin mutations. Am J Pathol. 2000;157(1):277–86. doi: 10.1016/s0002-9440(10)64538-5. [DOI] [PMC free article] [PubMed] [Google Scholar]
- [12].Cheung VG, Jen KY, Weber T, Morley M, Devlin JL, Ewens KG, Spielman RS. Genetics of quantitative variation in human gene expression. Cold Spring Harb Symp Quant Biol. 2003;68:403–7. doi: 10.1101/sqb.2003.68.403. [DOI] [PubMed] [Google Scholar]
- [13].Chyung JH, Selkoe DJ. Inhibition of receptor-mediated endocytosis demonstrates generation of amyloid beta-protein at the cell surface. J Biol Chem. 2003;278(51):51035–43. doi: 10.1074/jbc.M304989200. [DOI] [PubMed] [Google Scholar]
- [14].Colangelo V, Schurr J, Ball MJ, Pelaez RP, Bazan NG, Lukiw WJ. Gene expression profiling of 12633 genes in Alzheimer hippocampal CA1: transcription and neurotrophic factor down-regulation and up-regulation of apoptotic and pro-inflammatory signaling. J Neurosci Res. 2002;70(3):462–73. doi: 10.1002/jnr.10351. [DOI] [PubMed] [Google Scholar]
- [15].Dallas PB, Gottardo NG, Firth MJ, Beesley AH, Hoffmann K, Terry PA, Freitas JR, Boag JM, Cummings AJ, Kees UR. Gene expression levels assessed by oligonucleotide microarray analysis and quantitative real-time RT-PCR -- how well do they correlate? BMC Genomics. 2005;6(1):59. doi: 10.1186/1471-2164-6-59. [DOI] [PMC free article] [PubMed] [Google Scholar]
- [16].de la Monte SM, Wands JR. Review of insulin and insulin-like growth factor expression, signaling, and malfunction in the central nervous system: relevance to Alzheimer’s disease. J Alzheimers Dis. 2005;7(1):45–61. doi: 10.3233/jad-2005-7106. [DOI] [PubMed] [Google Scholar]
- [17].Dimakopoulos AC. Protein aggregation in Alzheimer’s disease and other neuropathological disorders. Curr Alzheimer Res. 2005;2(1):19–28. doi: 10.2174/1567205052772795. [DOI] [PubMed] [Google Scholar]
- [18].Dresios J, Aschrafi A, Owens GC, Vanderklish PW, Edelman GM, Mauro VP. Cold stress-induced protein Rbm3 binds 60S ribosomal subunits, alters microRNA levels, and enhances global protein synthesis. Proc Natl Acad Sci U S A. 2005;102(6):1865–70. doi: 10.1073/pnas.0409764102. [DOI] [PMC free article] [PubMed] [Google Scholar]
- [19].Dudoit S, Yang Y, Callow M, Speed T. Statistical methods for identifying differentially expressed genes in replicated cDNA microarray experiments. Statistica Sinica. 2002;12:111–39. [Google Scholar]
- [20].Dunckley T, Beach TG, Ramsey KE, Grover A, Mastroeni D, Walker DG, Lafleur BJ, Coon KD, Brown KM, Caselli R, Kukull W, Higdon R, McKeel D, Morris JC, Hulette C, Schmechel D, Reiman EM, Rogers J, Stephan DA. Gene expression correlates of neurofibrillary tangles in Alzheimer’s disease. Neurobiol Aging. 2005 doi: 10.1016/j.neurobiolaging.2005.08.013. [DOI] [PMC free article] [PubMed] [Google Scholar]
- [21].Farrall M. Quantitative genetic variation: a post-modern view. Hum Mol Genet. 2004;13(Supp 1):R1–7. doi: 10.1093/hmg/ddh084. [DOI] [PubMed] [Google Scholar]
- [22].Fathallah-Shaykh HM. Microarrays: applications and pitfalls. Arch Neurol. 2005;62(11):1669–72. doi: 10.1001/archneur.62.11.1669. [DOI] [PubMed] [Google Scholar]
- [23].Gautier L, Cope L, Bolstad BM, Irizarry RA. affy--analysis of Affymetrix GeneChip data at the probe level. Bioinformatics. 2004;20(3):307–15. doi: 10.1093/bioinformatics/btg405. [DOI] [PubMed] [Google Scholar]
- [24].Gentleman RC, Carey VJ, Bates DM, Bolstad B, Dettling M, Dudoit S, Ellis B, Gautier L, Ge Y, Gentry J, Hornik K, Hothorn T, Huber W, Iacus S, Irizarry R, Leisch F, Li C, Maechler M, Rossini AJ, Sawitzki G, Smith C, Smyth G, Tierney L, Yang JY, Zhang J. Bioconductor: open software development for computational biology and bioinformatics. Genome Biol. 2004;5(10):R80. doi: 10.1186/gb-2004-5-10-r80. [DOI] [PMC free article] [PubMed] [Google Scholar]
- [25].Hegde AN. Ubiquitin-proteasome-mediated local protein degradation and synaptic plasticity. Prog Neurobiol. 2004;73(5):311–57. doi: 10.1016/j.pneurobio.2004.05.005. [DOI] [PubMed] [Google Scholar]
- [26].Hermani A, De Servi B, Medunjanin S, Tessier PA, Mayer D. S100A8 and S100A9 activate MAP kinase and NF-kappaB signaling pathways and trigger translocation of RAGE in human prostate cancer cells. Exp Cell Res. 2006;312(2):184–97. doi: 10.1016/j.yexcr.2005.10.013. [DOI] [PubMed] [Google Scholar]
- [27].Hsu YC, Perin MS. Human neuronal pentraxin II (NPTX2): conservation, genomic structure, and chromosomal localization. Genomics. 1995;28(2):220–7. doi: 10.1006/geno.1995.1134. [DOI] [PubMed] [Google Scholar]
- [28].Huber W, von Heydebreck A, Sultmann H, Poustka A, Vingron M. Variance stabilization applied to microarray data calibration and to the quantification of differential expression. Bioinformatics. 2002;18(Supp 1):S96–104. doi: 10.1093/bioinformatics/18.suppl_1.s96. [DOI] [PubMed] [Google Scholar]
- [29].Irizarry RA, Bolstad BM, Collin F, Cope LM, Hobbs B, Speed TP. Summaries of Affymetrix GeneChip probe level data. Nucleic Acids Res. 2003;31(4):e15. doi: 10.1093/nar/gng015. [DOI] [PMC free article] [PubMed] [Google Scholar]
- [30].Jais PH. How frequent is altered gene expression among susceptibility genes to human complex disorders? Genet Med. 2005;7(2):83–96. doi: 10.1097/01.gim.0000153665.55420.c3. [DOI] [PubMed] [Google Scholar]
- [31].Kanai Y, Dohmae N, Hirokawa N. Kinesin transports RNA: isolation and characterization of an RNA-transporting granule. Neuron. 2004;43(4):513–25. doi: 10.1016/j.neuron.2004.07.022. [DOI] [PubMed] [Google Scholar]
- [32].Katzman R, Terry R, DeTeresa R, Brown T, Davies P, Fuld P, Renbing X, Peck A. Clinical, pathological, and neurochemical changes in dementia: a subgroup with preserved mental status and numerous neocortical plaques. Ann Neurol. 1988;23(2):138–44. doi: 10.1002/ana.410230206. [DOI] [PubMed] [Google Scholar]
- [33].Keating DJ, Chen C, Pritchard MA. Alzheimer’s disease and endocytic dysfunction: Clues from the Down syndrome-related proteins, DSCR1 and ITSN1. Ageing Res Rev. 2006 doi: 10.1016/j.arr.2005.11.001. [DOI] [PubMed] [Google Scholar]
- [34].Kita H, Carmichael J, Swartz J, Muro S, Wyttenbach A, Matsubara K, Rubinsztein DC, Kato K. Modulation of polyglutamine-induced cell death by genes identified by expression profiling. Hum Mol Genet. 2002;11(19):2279–87. doi: 10.1093/hmg/11.19.2279. [DOI] [PubMed] [Google Scholar]
- [35].Layfield R, Lowe J, Bedford L. The ubiquitin-proteasome system and neurodegenerative disorders. Essays Biochem. 2005;41:157–71. doi: 10.1042/EB0410157. [DOI] [PubMed] [Google Scholar]
- [36].Lee JH. Genetic evidence for cognitive reserve: variations in memory and related cognitive functions. J Clin Exp Neuropsychol. 2003;25(5):594–613. doi: 10.1076/jcen.25.5.594.14582. [DOI] [PubMed] [Google Scholar]
- [37].Loring JF, Wen X, Lee JM, Seilhamer J, Somogyi R. A gene expression profile of Alzheimer’s disease. DNA Cell Biol. 2001;20(11):683–95. doi: 10.1089/10445490152717541. [DOI] [PubMed] [Google Scholar]
- [38].Maekawa M, Ishizaki T, Boku S, Watanabe N, Fujita A, Iwamatsu A, Obinata T, Ohashi K, Mizuno K, Narumiya S. Signaling from Rho to the actin cytoskeleton through protein kinases ROCK and LIM-kinase. Science. 1999;285(5429):895–8. doi: 10.1126/science.285.5429.895. [DOI] [PubMed] [Google Scholar]
- [39].Marshall E. Getting the noise out of gene arrays. Science. 2004;306(5696):630–1. doi: 10.1126/science.306.5696.630. [DOI] [PubMed] [Google Scholar]
- [40].Martin KC, Kosik KS. Synaptic tagging -- who’s it? Nat Rev Neurosci. 2002;3(10):813–20. doi: 10.1038/nrn942. [DOI] [PubMed] [Google Scholar]
- [41].Mattick JS, Makunin IV. Small regulatory RNAs in mammals. Hum Mol Genet. 2005;14 Spec No 1:R121–32. doi: 10.1093/hmg/ddi101. [DOI] [PubMed] [Google Scholar]
- [42].McPherson PS, Kay BK, Hussain NK. Signaling on the endocytic pathway. Traffic. 2001;2(6):375–84. doi: 10.1034/j.1600-0854.2001.002006375.x. [DOI] [PubMed] [Google Scholar]
- [43].Mirra SS, Heyman A, McKeel D, Sumi SM, Crain BJ, Brownlee LM, Vogel FS, Hughes JP, van Belle G, Berg L. The Consortium to Establish a Registry for Alzheimer’s Disease (CERAD). Part II. Standardization of the neuropathologic assessment of Alzheimer’s disease. Neurology. 1991;41(4):479–86. doi: 10.1212/wnl.41.4.479. [DOI] [PubMed] [Google Scholar]
- [44].Mizutani A, Fukuda M, Ibata K, Shiraishi Y, Mikoshiba K. SYNCRIP, a cytoplasmic counterpart of heterogeneous nuclear ribonucleoprotein R, interacts with ubiquitous synaptotagmin isoforms. J Biol Chem. 2000;275(13):9823–31. doi: 10.1074/jbc.275.13.9823. [DOI] [PubMed] [Google Scholar]
- [45].Mohney RP, Das M, Bivona TG, Hanes R, Adams AG, Philips MR, O’Bryan JP. Intersectin activates Ras but stimulates transcription through an independent pathway involving JNK. J Biol Chem. 2003;278(47):47038–45. doi: 10.1074/jbc.M303895200. [DOI] [PubMed] [Google Scholar]
- [46].Morley M, Molony CM, Weber TM, Devlin JL, Ewens KG, Spielman RS, Cheung VG. Genetic analysis of genome-wide variation in human gene expression. Nature. 2004;430(7001):743–7. doi: 10.1038/nature02797. [DOI] [PMC free article] [PubMed] [Google Scholar]
- [47].Mosconi L. Brain glucose metabolism in the early and specific diagnosis of Alzheimer’s disease. FDG-PET studies in MCI and AD. Eur J Nucl Med Mol Imaging. 2005;32(4):486–510. doi: 10.1007/s00259-005-1762-7. [DOI] [PubMed] [Google Scholar]
- [48].O’Bryan JP, Mohney RP, Oldham CE. Mitogenesis and endocytosis: What’s at the INTERSECTIoN? Oncogene. 2001;20(44):6300–8. doi: 10.1038/sj.onc.1204773. [DOI] [PubMed] [Google Scholar]
- [49].Ohki-Hamazaki H, Iwabuchi M, Maekawa F. Development and function of bombesin-like peptides and their receptors. Int J Dev Biol. 2005;49(23):293–300. doi: 10.1387/ijdb.041954ho. [DOI] [PubMed] [Google Scholar]
- [50].Ohki-Hamazaki H, Watase K, Yamamoto K, Ogura H, Yamano M, Yamada K, Maeno H, Imaki J, Kikuyama S, Wada E, Wada K. Mice lacking bombesin receptor subtype-3 develop metabolic defects and obesity. Nature. 1997;390(6656):165–9. doi: 10.1038/36568. [DOI] [PubMed] [Google Scholar]
- [51].Ohtsuka T, Hata Y, Ide N, Yasuda T, Inoue E, Inoue T, Mizoguchi A, Takai Y. nRap GEP: a novel neural GDP/GTP exchange protein for rap1 small G protein that interacts with synaptic scaffolding molecule (S-SCAM) Biochem Biophys Res Commun. 1999;265(1):38–44. doi: 10.1006/bbrc.1999.1619. [DOI] [PubMed] [Google Scholar]
- [52].Pfaffl MW. A new mathematical model for relative quantification in real-time RT-PCR. Nucleic Acids Res. 2001;29(9):e45. doi: 10.1093/nar/29.9.e45. [DOI] [PMC free article] [PubMed] [Google Scholar]
- [53].Predescu SA, Predescu DN, Timblin BK, Stan RV, Malik AB. Intersectin regulates fission and internalization of caveolae in endothelial cells. Mol Biol Cell. 2003;14(12):4997–5010. doi: 10.1091/mbc.E03-01-0041. [DOI] [PMC free article] [PubMed] [Google Scholar]
- [54].Pucharcos C, Estivill X, de la Luna S. Intersectin 2, a new multimodular protein involved in clathrin-mediated endocytosis. FEBS Lett. 2000;478(12):43–51. doi: 10.1016/s0014-5793(00)01793-2. [DOI] [PubMed] [Google Scholar]
- [55].Ramakers C, Ruijter JM, Deprez RH, Moorman AF. Assumption-free analysis of quantitative real-time polymerase chain reaction (PCR) data. Neurosci Lett. 2003;339(1):62–6. doi: 10.1016/s0304-3940(02)01423-4. [DOI] [PubMed] [Google Scholar]
- [56].Salehi A, Delcroix JD, Swaab DF. Alzheimer’s disease and NGF signaling. J Neural Transm. 2004;111(3):323–45. doi: 10.1007/s00702-003-0091-x. [DOI] [PubMed] [Google Scholar]
- [57].Savdie C, Ferguson SS, Vincent JP, Beaudet A, Stroh T. Cell-type-specific pathways of neurotensin endocytosis. Cell Tissue Res. 2005:1–17. doi: 10.1007/s00441-005-0102-3. [DOI] [PubMed] [Google Scholar]
- [58].Scarmeas N, Stern Y. Cognitive reserve: implications for diagnosis and prevention of Alzheimer’s disease. Curr Neurol Neurosci Rep. 2004;4(5):374–80. doi: 10.1007/s11910-004-0084-7. [DOI] [PMC free article] [PubMed] [Google Scholar]
- [59].Scearce LM, Brestelli JE, McWeeney SK, Lee CS, Mazzarelli J, Pinney DF, Pizarro A, Stoeckert CJ, Jr., Clifton SW, Permutt MA, Brown J, Melton DA, Kaestner KH. Functional genomics of the endocrine pancreas: the pancreas clone set and PancChip, new resources for diabetes research. Diabetes. 2002;51(7):1997–2004. doi: 10.2337/diabetes.51.7.1997. [DOI] [PubMed] [Google Scholar]
- [60].Scheff SW, Price DA, Schmitt FA, Mufson EJ. Hippocampal synaptic loss in early Alzheimer’s disease and mild cognitive impairment. Neurobiol Aging. 2005 doi: 10.1016/j.neurobiolaging.2005.09.012. [DOI] [PubMed] [Google Scholar]
- [61].Schmitt FA, Davis DG, Wekstein DR, Smith CD, Ashford JW, Markesbery WR. “Preclinical” AD revisited: neuropathology of cognitively normal older adults. Neurology. 2000;55(3):370–6. doi: 10.1212/wnl.55.3.370. [DOI] [PubMed] [Google Scholar]
- [62].Singleton A, Myers A, Hardy J. The law of mass action applied to neurodegenerative disease: a hypothesis concerning the etiology and pathogenesis of complex diseases. Hum Mol Genet. 2004;13 Spec No 1:R123–6. doi: 10.1093/hmg/ddh093. [DOI] [PubMed] [Google Scholar]
- [63].Smyth G. Linear models and empirical bayes methods for assessing differential expression in microarray experiments. Statistical Applications in Genetics and Molecular Biology. 2004;3(1):1–23. doi: 10.2202/1544-6115.1027. [DOI] [PubMed] [Google Scholar]
- [64].Stern Y. What is cognitive reserve? Theory and research application of the reserve concept. J Int Neuropsychol Soc. 2002;8(3):448–60. [PubMed] [Google Scholar]
- [65].Storey JD, Tibshirani R. Statistical significance for genomewide studies. Proc Natl Acad Sci U S A. 2003;100(16):9440–5. doi: 10.1073/pnas.1530509100. [DOI] [PMC free article] [PubMed] [Google Scholar]
- [66].Stroombergen MC, Waring RH. Determination of glutathione S-transferase mu and theta polymorphisms in neurological disease. Hum Exp Toxicol. 1999;18(3):141–5. doi: 10.1177/096032719901800302. [DOI] [PubMed] [Google Scholar]
- [67].Sun-Wada GH, Wada Y, Futai M. Diverse and essential roles of mammalian vacuolar-type proton pump ATPase: toward the physiological understanding of inside acidic compartments. Biochim Biophys Acta. 2004;1658(12):106–14. doi: 10.1016/j.bbabio.2004.04.013. [DOI] [PubMed] [Google Scholar]
- [68].Team RDC. R: A Language and Environment for Statistical Computing. R Foundation for Statistical Computing. 2005 < http://www.R-project.org>.
- [69].Tong XK, Hussain NK, Adams AG, O’Bryan JP, McPherson PS. Intersectin can regulate the Ras/MAP kinase pathway independent of its role in endocytosis. J Biol Chem. 2000;275(38):29894–9. doi: 10.1074/jbc.M004096200. [DOI] [PubMed] [Google Scholar]
- [70].Tsui CC, Copeland NG, Gilbert DJ, Jenkins NA, Barnes C, Worley PF. Narp, a novel member of the pentraxin family, promotes neurite outgrowth and is dynamically regulated by neuronal activity. J Neurosci. 1996;16(8):2463–78. doi: 10.1523/JNEUROSCI.16-08-02463.1996. [DOI] [PMC free article] [PubMed] [Google Scholar]
- [71].Wellmann S, Buhrer C, Moderegger E, Zelmer A, Kirschner R, Koehne P, Fujita J, Seeger K. Oxygen-regulated expression of the RNA-binding proteins RBM3 and CIRP by a HIF-1-independent mechanism. J Cell Sci. 2004;117(Pt 9):1785–94. doi: 10.1242/jcs.01026. [DOI] [PubMed] [Google Scholar]
- [72].Yan H, Yuan W, Velculescu VE, Vogelstein B, Kinzler KW. Allelic variation in human gene expression. Science. 2002;297(5584):1143. doi: 10.1126/science.1072545. [DOI] [PubMed] [Google Scholar]
- [73].Yao PJ, Zhu M, Pyun EI, Brooks AI, Therianos S, Meyers VE, Coleman PD. Defects in expression of genes related to synaptic vesicle trafficking in frontal cortex of Alzheimer’s disease. Neurobiol Dis. 2003;12(2):97–109. doi: 10.1016/s0969-9961(02)00009-8. [DOI] [PubMed] [Google Scholar]
Associated Data
This section collects any data citations, data availability statements, or supplementary materials included in this article.