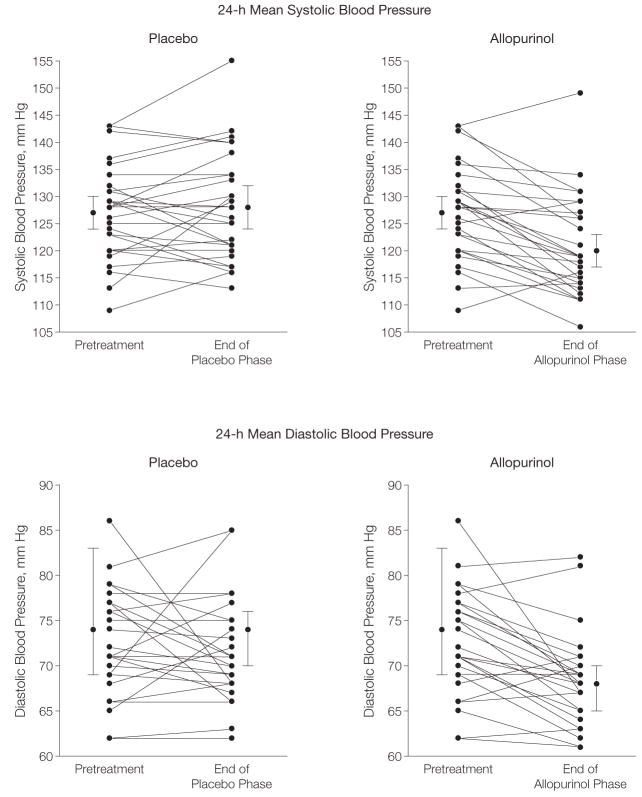
Figure 2.
Blood Pressure Response of Adolescents to Allopurinol and Placebo
Fifteen individuals received allopurinol first and 15 received placebo first but the x-axis is defined by treatment arm rather than time for clarity. Each panel shows the data for all 30 participants. Because of overlap in the blood pressure values and change in blood pressure, 30 distinct points and lines are not visible on each diagram. Data points with error bars are overall mean (95% confidence interval) values.

