

Abstract
Analysis of cellular 7,8-dihydro-8-oxo-2′-deoxyguanosine (8-oxo-dGuo) as a biomarker of oxidative DNA damage has been fraught with numerous methodological problems. This is primarily due to artifactual oxidation of dGuo that occurs during DNA isolation and hydrolysis. Therefore, it has become necessary to rely on using the comet assay, which is not necessarily specific for 8-oxo-dGuo. A highly specific and sensitive method based on immunoaffinity purification and stable isotope dilution liquid chromatography (LC)-multiple reaction monitoring (MRM)/mass spectrometry (MS) that avoids artifact formation has now been developed. Cellular DNA was isolated using cold DNAzol (a proprietary product that contains guanidine thiocyanate) instead of chaotropic- or phenol-based methodology. Chelex-treated buffers were used to prevent Fenton chemistry-mediated generation of reactive oxygen species (ROS) and artifactual oxidation of DNA bases. Deferoxamine was also added to all buffers in order to complex any residual transition metal ions remaining after Chelex treatment. The LC-MRM/MS method was used to determine that the basal 8-oxo-dGuo level in DNA from human bronchoalveolar H358 cells was 2.2 ± 0.4 8-oxo-dGuo/107 dGuo (mean ± standard deviation) or 5.5 ± 1.0 8-oxo-dGuo/108 nucleotides. Similar levels were observed in human lung adenocarcinoma A549 cells, mouse hepatoma Hepa-1c1c7 cells, and human HeLa cervical epithelial adenocarcinoma cells. These values are an order of magnitude lower than is typically reported for basal 8-oxo-dGuo levels in DNA as determined by other MS- or chromatography-based assays. H358 cells were treated with increasing concentrations of potassium bromate (KBrO3) as a positive control or with the methylating agent methyl methanesulfonate (MMS) as a negative control. A linear dose−response for 8-oxo-dGuo formation (r2 = 0.962) was obtained with increasing concentrations of KBrO3 in the range of 0.05 mM to 2.50 mM. In contrast, no 8-oxo-dGuo was observed in H358 cell DNA after treatment with MMS. At low levels of oxidative DNA damage, there was an excellent correlation between a comet assay that measured DNA single strand breaks (SSBs) after treatment with human 8-oxo-guanine glycosylase-1 (hOGG1) when compared with 8-oxo-dGuo in the DNA as measured by the stable isotope dilution LC-MRM/MS method. Availability of the new LC-MRM/MS assay made it possible to show that the benzo[a]pyrene (B[a]P)-derived quinone, B[a]P-7,8-dione, could induce 8-oxo-dGuo formation in H358 cells. This most likely occurred through redox cycling between B[a]P-7,8-dione and B[a]P-7,8-catechol with concomitant generation of DNA damaging ROS. In keeping with this concept, inhibition of catechol-O-methyl transferase (COMT)-mediated detoxification of B[a]P-7,8-catechol with Ro 410961 caused increased 8-oxo-dGuo formation in the H358 cell DNA.
Introduction
Elevated levels of oxidatively damaged DNA have been measured in numerous diseases including Alzheimer’s disease (1), Parkinson’s disease (2), autoimmune diseases (3), cardiovascular diseases (4−6), and cancer (7−9). It has been suggested that such damage plays an important role in the etiology of these diseases (10,11). Oxidative DNA damage is also increased through exposure to environmental chemicals (12,13). In addition, there is some evidence of a link between ingestion of antioxidants and reduced oxidative damage to DNA (14). 8-oxo-dGuo1 is by far the most extensively studied lesion that arises as a consequence of oxidative DNA damage (5,11,15).
Unfortunately, it is extremely easy to induce artifactual formation of 8-oxo-dGuo in cellular DNA during the isolation and hydrolysis procedures that are commonly used (5,16). Therefore, a number of studies have been conducted to address the problem of quantifying 8-oxo-dGuo in DNA including the important contributions of the Cadet group (17,18) and the European Standards Committee on Oxidative DNA Damage (19−25). The comet assay has predicted that basal endogenous concentrations of 8-oxo-dGuo in cellular DNA should be at the level of 3−5 molecules of 8-oxo-dGuo/107 dGuo (25). Unfortunately, physicochemical methods developed to analyze 8-oxo-dGuo have consistently obtained values that are almost an order of magnitude higher at 34−37 molecules of 8-oxo-dGuo/107 dGuo (25). These elevated values were obtained even when highly specific and sensitive methodology based on immunoaffinity purification and stable isotope dilution LC-MS was used (26), which suggests that artifactual formation of 8-oxo-dGuo might occur during DNA isolation and hydrolysis (5,16). Significant advances have been made to the comet assay by introducing the use of hOGG1 to specifically remove 8-oxo-dGuo from the DNA so that it is now possible to reliably measure basal cellular oxidative DNA damage (27). hOGG1 is known to excise both 8-oxo-dGuo as 8-oxo-Gua (7,8-dihydro-8-oxo-guanine) producing a single strand break. It will also remove formamidopyrimidine-dGuo (FAPY-dGuo) derived to yield a single strand break. Unfortunately, a linear dose−response to KBrO3-induced oxidative DNA damage was not obtained even with this significantly improved method (27). This implies that lesions other than 8-oxo-dGuo can be detected by the comet assay even when the assay is used in combination with the selective hOGG1 enzyme.
We have developed an immunoaffinity purification stable isotope dilution LC-MRM/MS assay for the analysis of 8-oxo-dGuo in cellular DNA. This methodology provides the ultimate in sensitivity and specificity that can be attained using physicochemical methodology for the analysis of endogenously generated lesions in DNA (28). Unfortunately, when this assay was used with conventional DNA isolation procedures, basal levels of 8-oxo-dGuo were similar to those described previously (26). Artifactual generation of 8-oxo-dGuo was reduced when cellular DNA was isolated using commercially available DNAzol (which contains high concentrations of guanidine thiocyanate) (29) instead of chaotropic- (30,31) or phenol-based (32) extraction methodology. Chelex-treated water was used to reduce transition metal ion contamination in the buffers that were used (33), and deferoxamine was added to complex any residual transition metal ions that were present. This prevented Fenton chemistry-mediated generation of ROS and artifactual oxidation of DNA bases (5,16). Levels of 8-oxo-dGuo obtained when using these precautions were then similar to those obtained previously using the comet assay (27). The assay was then employed to quantify 8-oxo-dGuo in human lung bronchoalveolar H358 cells treated with the redox-active B[a]P-7,8-dione, a reaction product of aldo-keto reductase (AKR)-mediated polycyclic aromatic hydrocarbon (PAH)-trans-dihydrodiol activation (34).
Materials and Methods
Chemicals and Materials
8-Oxo-dGuo, dGuo, deferoxamine methanesulfonate, TEMPO (2,2,6,6-tetramethylpiperidin-1-oxyl), shrimp alkaline phosphatase (SAP), dimethylsulfoxide (DMSO), MMS, KBrO3, Dulbecco’s phosphate buffered saline (PBS), ascorbic acid, cupric chloride, and hydrogen peroxide were obtained from Sigma-Aldrich (St. Louis, MO). [15N5]-2′-deoxyguanosine triphosphate (dGTP) was purchased from Cambridge Isotope Laboratories Inc. (Andover, MA). Bovine pancreas deoxyribonuclease 1 (DNase 1) was obtained from Calbiochem (San Diego, CA), phosphodiesterase 1 was purchased from Worthington (Lakewood, NJ), and 3-(N-morpholino)propanesulfonic acid (MOPS) was from Fluka Biochemika (Milwaukee, WI). Chelex 100 resin was purchased from Bio-Rad (Hercules, CA). CNBr-activated Sepharose 4B was obtained from Amersham Pharmacia Biotech (Piscataway, NJ). Kontes Flex polystyrene columns (5.0 × 1.0 cm) were obtained from Fisher Scientific (Pittsburgh, PA). Costar Spin-X centrifuge filter tubes (0.22 μm, nylon) and HPLC grade solvents were purchased from Fisher Scientific (Pittsburgh, PA). The 8-oxo-dGuo monoclonal antibody (mAb) 4E9 was purchased from Trevigen Inc. (Gaithersburg, MD). Chelex-mediated removal of transition metal ions was assessed by monitoring the absorbance of solutions at 260 nm for 2 h. This enabled the detection of >10 nM transition metal ions (33).
LC
Purification of [15N5]-8-oxo-dGuo and DNA base analysis were performed using a Hitachi HPLC system equipped with an L-2130 pump, an L-2200 autosampler, and an L-2450 diode array detector (systems 1 and 2). LC-MS analysis of 8-oxo-dGuo was performed using an Agilent 1100 series HPLC pump (Agilent Technologies, Santa Clara, CA) (system 3). LC system 1 utilized a YMC ODS-AQ C18 column (250 × 10 mm internal diameter (i.d.), 5 μm), and system 2 employed a Phenomenex Luna C18 (2) column (250 × 4.6 mm i.d.; 5 μm) with a guard column cartridge (C18; 4 × 3.0 mm i.d.). LC system 3 used a Phenomenex Luna C18(2) (150 × 2 mm i.d.; 3 μm) with a C18 guard column cartridge (4 × 2 mm i.d.). For LC systems 1 and 2, solvent A was water, and solvent B was acetonitrile. The linear gradient for system 1 was 6% B at time 0 min, 6% B at time 3 min, 12% B at 9 min, 12% B at 12 min, 6% B at 15 min, and 6% B at 25 min with a flow of 2.5 mL/min. The linear gradient for system 2 was 5% B at 0 min, 15% B at 12 min, 80% B at 14 min, 80% B at 20 min, 5% B at 22 min, and 5% B at 30 min with a flow rate of 0.8 mL/min. For system 3, the mobile phase consisted of water with 0.02% formic acid as solvent A and acetonitrile as solvent B. The linear gradient for system 3 was as follows: 2% B at 0 min, 15% B at 15 min, 15% B at 16 min, 2% B at 17 min, and 2% B at 27 min with a flow rate of 0.2 mL/min.
LC-MS
Analyses were conducted using an API 4000 (Applied Biosystems/MDS Sciex, Foster City) equipped with positive electrospray ionization (ESI), CTC autosampler (CTC Analytics, Switzerland), and Analyst 1.4.1 software. Samples were maintained at 5 °C on the autosampler, and injections of 50 μL were made. The column effluent was diverted to waste for the first 5 min and the last 12 min of the analysis to prevent extraneous material from entering the mass spectrometer. The API 4000 operating conditions were as follows: compressed air as curtain gas (17 psi) and nitrogen as nebulizing (35 psi), heater (10 psi), and collision-induced dissociation (CID) gas (6 psi). The ESI probe temperature was 450 °C, the declustering potential was 46 V, the entrance potential was 10 V, the collision energy was 19 eV, and the collision exit potential was 30 V. MRM was conducted by using the m/z 284 (MH+) → m/z 168 [MH+-2′-deoxyribose+H] transition for 8-oxo-dGuo and m/z 289 (MH+) → m/z 173 [MH+-2′-deoxyribose+H] transition for [15N5]-8-oxo-dGuo.
Synthesis of [15N5]-8-Oxo-dGuo
A solution of 15N5-dGTP (2 mg, 3.6 μmmol) in 200 μL of water was added to a solution (2 mL) of 10 mM MOPS, 100 mM NaCl (pH 7.0) buffer, and 250 units of E. coli alkaline phosphatase. The reaction mixture was then incubated at 37 °C for 1 h. [15N5]-dGuo was purified on LC system 1. The fractions containing [15N5]-dGuo were collected, pooled, and evaporated to dryness to furnish pure [15N5]-dGuo (776 μg, 73% yield). A solution of [15N5]-dGuo (100 μg, 0.366 μmol) in water (400 μL) was added to an aqueous solution made from 2 M ascorbic acid (26 μL), 0.2 M cupric chloride (2.6 μL), and 30% hydrogen peroxide (52 μL). The reaction mixture was vortex-mixed, placed on ice for 15 min, and then purified using LC system 1. The identity and isotopic purity of the [15N5]-8-oxo-dGuo was confirmed by LC-tandem MS (MS/MS) analysis.
Cell Culture
Human bronchoalveolar H358 cells, human lung adenocarcinoma A549 cells, human cervical adenocarcinoma HeLa cells, and Mouse hepatoma Hepa-1c1c7 cells were obtained from the American type Culture Collection (ATCC #s CRL-5807, CCL-185, CCL-2, and CRL-2026, respectively). H358 cells were cultured and maintained in RPMI 1640 nutrient mixture, A549, and Hepa-1c1c7 cells were cultured and maintained in DMEM medium with 10% fetal bovine serum, 1% l-glutamine, and 100 units/mL of penicillin/streptomycin. HeLa cells were cultured in Eagle’s minimum essential medium (EMEM) with 10% fetal bovine serum, 1% l-glutamine, and 100 units/mL of penicillin/streptomycin. All cells were incubated at 37 °C in a humidified atmosphere containing 5% CO2 and were passaged every 3 days at a 1:5 dilution.
Determination of Basal 8-Oxo-dGuo Concentrations
H358, A549, HeLa, or Hepa1c1c7 cells were allowed to come to ∼40−50% confluence, the RPMI or DMEM media were removed. Cells (typically 106) were washed with Dulbecco’s PBS (5 mL) then transferred with 400 μL of Dulbecco’s PBS buffer containing proteinase K (80 μg) to a 2 mL centrifuge tube. They were then diluted to 2 mL with RPMI, centrifuged at 100g, and the supernatant removed. The cell pellet was resuspended in 100 μL of RPMI media followed by either the DNAzol reagent (900 μL) or the Wako lysis solution (900 μL). The DNAzol reagent uses a novel proprietary guanidine−detergent lysing solution that hydrolyzes RNA and allows the selective precipitation of DNA from cell lysates (29). For the DNAzol method, the suspension was incubated for 10 min at room temperature, and isopropanol (400 μL) was added. The tube was shaken by hand for 3−4 min, left standing at room temperature for 10 min, and centrifuged at 2,400g for 10 min. The supernatant was removed, 75% aqueous ethanol (1 mL) was added, centrifuged 2,400g, and the supernatant again removed. Another aliquot of 75% aqueous ethanol (1 mL) was added, the tube was shaken by hand for 3−4 min, and then cooled at − 80 °C overnight. For the Wako method, the 2 mL centrifuge tube was shaken by hand for 5 min and then centrifuged at 2,400g for 10 min. The supernatant was removed, and another portion of the Wako lysis solution (1 mL) was added. The tube was shaken again by hand for 5 min and centrifuged at 2,400g for 10 min. After removing the supernatant, the pellet was resuspended in 200 μL of Wako enzyme solution followed by 10 μL of Wako protease solution, which were mixed by inversion of the tubes by hand for 3−4 min. The mixture was incubated for 1 h at 37 °C. The sodium iodide solution (300 μL) together with isopropanol (500 μL) were then added and shaken by hand for 5 min, left at room temperature for 10 min, and then centrifuged at 2,400g for 10 min. The supernatant was removed, 75% ethanol (1 mL) was added, and centrifuged for 10 min at 2,400g. After removal of the supernatant, another portion of 75% ethanol (1 mL) was added and the tube kept at −80 °C overnight. For both the DNAzol and Wako methods, DNA was isolated by centrifugation of the cold 75% ethanol solutions at 2,400g for 10 min, removal of the supernatant, and allowing to air-dry for 2 min. The DNA was then immediately hydrolyzed as described below.
DMSO, KBrO3, and MMS Treatment of H358 cells
Cells were allowed to come to ∼40−50% confluence. The RPMI media was removed; cells were washed with 10 mL of Hank’s balanced salt solution (HBSS) and resuspended in HBSS (10 mL). They were then treated with KBrO3 in increasing concentrations from 0.05 mM to 2.50 mM in Dulbecco’s PBS or MMS in increasing concentrations from 5 μM to 20 μM dissolved in DMSO (final DMSO concentration of 2%). The H358 cells were also treated with PBS (control) or DMSO (0.01% to 2.00%). Cells (typically 106) were incubated for 3 h, the HBSS was removed, they were washed with Dulbecco’s PBS (5 mL), and transferred to a 2 mL centrifuge tube in 400 μL of Dulbecco’s PBS buffer containing proteinase K (80 μg). Cells were then diluted to 2 mL with RPMI media and a portion of the cell suspension was used for the comet assay (20 μL). The remainder was centrifuged at 100g, the supernatant removed, and the cell pellet resuspended in 100 μL of RPMI media followed by 900 μL of DNAzol reagent, the DNA isolated as described above, and hydrolyzed as described below.
B[a]P-7,8-dione Treatment of the H358 Cells
Cells (typically 106) were resuspended in HBSS as described above and then treated with 20 μM B[a]P-7,8-dione (Scheme 1) dissolved in DMSO (final concentration 1%) or DMSO vehicle alone (final concentration 1%) for 9 h. Cells were also pretreated with COMT inhibitor Ro 410961 (3 μM) dissolved in 40% ethanol (final ethanol concentration 0.04%). The cells were incubated for 30 min and treated either with 20 μM B[a]P-7,8-dione dissolved in DMSO (final concentration 1%) or with DMSO vehicle alone (final concentration 1%) and the cells incubated for a further 9 h. Cells were then harvested as described above. The DNA was isolated, hydrolyzed, purified, and analyzed for 8-oxo-dGuo by stable isotope dilution LC-MRM/MS as described below.
Scheme 1. B[a]P-7,8-dione-Mediated Formation of 8-Oxo-dGuo in H358 Cells.

DNA Hydrolysis and Purification
DNA pellets (obtained as described above) were dissolved in 300 μL of Chelex-treated 10 mM MOPS containing 100 mM MgCl2 at pH 7.0 and 0.1 mM deferoxamine. The internal standard [15N5]-8-oxo-dGuo (0.76 ng) was added and enzymatic hydrolysis initiated by the addition of 556 units of DNase 1 followed by incubation for 90 min at 37 °C. At the end of the incubation, 30 μL of 0.2 M Chelex-treated glycine buffer (pH 10) was added together with phosphodiesterase I (100 units/mL in Chelex-treated water) and 10 μL of 500 mM MgCl2. Samples were then incubated for a further 2 h at 37 °C before adding the SAP solution (6 units, 6 μL). The samples were incubated for an additional 90 min at 37 °C. Finally, the samples were filtered through Costar 0.22 μM nylon filters. A portion of each sample (250 μL) was subjected to immunoaffinity purification, and the remaining sample was used for normal base analysis on LC system 2.
Immunoaffinity Column Preparation
The columns were prepared by minor modifications to the previously published method of Singh et al. (26). CNBr-activated Sepharose 4B gel (0.7 g) was suspended in 45 mL of 1 mM HCl in a 50 mL Falcon tube and gently shaken for 15 min on a rocking platform. The suspended gel was centrifuged for 5 min at 3,210g using a Beckman GS-6KR centrifuge (Cambridge Scientific, Cambridge, MA) and the supernatant discarded. The gel was washed four times using 45 mL of 1 mM HCl by gentle shaking for 15 min followed by centrifugation for 5 min at 3,210g and removal of the supernatant. Contents of the Falcon tube were transferred to a 1 × 5 cm polystyrene column in which the bed-volume was supported by a 1 cm hydrophobic plastic diffusion disk (Fisher Scientific, Pittsburgh, PA). The column was then allowed to drain in order to remove the buffer. A solution of the 8-oxo-dGuo mAb 4E9 (100 μg) in PBS with 0.01% sodium azide as preservative (1 mL) was diluted with 900 μL of coupling buffer (0.1 M NaHCO3 and 0.5 M NaCl, pH 8.3). The mAb solution was added to washed CNBr activated Sepharose 4B gel in a polystyrene column and shaken overnight at 4 °C. Excess mAb was removed by washing five times with 1.0 mL of coupling buffer, and the gel was allowed to stand in 4.0 mL of 0.1 M Tris-HCl buffer (pH 8.0) for 2 h at room temperature. It was then washed three times with 5 mL of 0.1 M sodium acetate buffer containing 0.5 M NaCl (pH 4.0) followed by 5 mL of 0.1 M Tris-HCl buffer containing 0.5 M NaCl (pH 8.0). Finally, 2.0 mL of loading buffer (0.05 M sodium phosphate buffer containing 0.02% sodium azide, pH 7.4) was added to the column. The columns were stored at 4 °C until used.
Immunoaffinity Purification of 8-Oxo-dGuo
Hydrolyzed DNA from ∼1 × 10⁶ cells (250 μL) was diluted to 1.0 mL with loading buffer and applied to the immunoaffinity column at room temperature. The column was washed with 5.0 mL of loading buffer followed by washing with 5.0 mL of water. The 8-oxo-dGuo was eluted with 5.0 mL of water/methanol (1:1). The sample was evaporated to dryness at room temperature under nitrogen and the residue dissolved in 200 μL of Chelex-treated HPLC grade water.
Regeneration of Immunoaffinity Columns
The columns were regenerated for future use by washing with 5.0 mL of HPLC grade water followed by 5.0 mL of loading buffer. They were stored in 2.0 mL of loading buffer at 4 °C. They were used up to 10 times, and the presence of any carry-over of endogenous 8-oxo-dGuo was determined by analyzing the internal standard alone. Any carry-over would have been observed by an increase in the signal for endogenous 8-oxo-dGuo.
DNA Base Analysis
Calibration curves were prepared using different concentrations of dGuo (5.0, 10.0, 20.0, 50.0, and 100.0 μg/mL) using system 2 with an injection volume of 10 μL. Calibration curves were calculated from a linear regression analysis of LC peak areas of standard samples. A portion of the digested DNA sample was subjected to the same LC procedure, and normal dGuo levels were calculated by interpolation from the calibration curve.
Accuracy and Precision
Standard curves were prepared in the range of 0.01 ng to 5.00 ng/sample (0.01, 0.05, 0.10, 0.25, 0.50, 1.0, 2.0, and 5.0 ng) and analyzed either directly or after immunopurification of each standard. Quality control (QC) samples (n = 5) were prepared for the lower limit of quantitation QC (LLQC, 0.01 ng), lower QC (LQC, 0.10 ng), middle QC (MQC, 0.50 ng), and high QC (HQC, 1.00 ng) of 8-oxo-dGuo. Control digested H358 cell DNA from 106 cells was added to each QC sample and a blank control buffer sample together with [15N5]-8-oxo-dGuo internal standard (0.76 ng). Samples were then immunopurified as described above. The 8-oxo-dGuo concentrations in control DNA and QC samples (to which control DNA had been added) were determined by LC-MRM/MS. The mean amount of 8-oxo-dGuo present in the control H358 cell DNA (n = 5) was then subtracted from the QC samples in order to obtain the accuracy values. Accuracy was calculated as the percentage deviation from the theoretical concentration. Within day precision values were calculated as the coefficient of variation (CV) from the ratio of the relative standard deviation (SD) to the appropriate mean value expressed as a percentage for five replicates.
Comet Assay
A suspension of approximately 7,500 cells (15 μL) was gently mixed with 85 μL of 0.7% low melting point agarose and was directly added to a slide precoated with 0.9% normal melting point agarose. The cell mixture was then layered by spreading it with a coverslip and allowed to gel on the iced plate for 5 min. After removal of the coverslip, a second layer of agarose gel was added to cover the surface of the cell-embedded agarose layer by using the same coverslip. The coverslip was removed, and the slide was immersed in cell lysis solution [2.5 M NaCl, 0.1 M Na2-EDTA, 1% Na-sarcosinate, 10 mM Tris-HCl (pH 10.0), 10% DMSO, and 1% Triton X-100] for 1 h. At the end of lysis, the slide was thoroughly rinsed three times by changing to the hOGG1 enzyme buffer (40 mM HEPES, 0.1 M KCl, 0.5 mM Na2-EDTA, and 0.2 mg/mL bovine serum albumin, pH 8.0) at room temperature. The hOGG1 glycosylase enzyme (0.08 units, 60 μL) was added to the gel on the slide, and the gel was covered with a coverslip. The slide was incubated under a humidified conditions for 20 min at 37 °C. After incubation, the coverslip was removed, and the slide was immersed in cold alkali lysis buffer (1 mM Na2-EDTA and 0.3 M NaOH, pH > 12.0) for 20 min to allow DNA unwinding. The slide was then subjected to room temperature electrophoresis at 25 V and 300 mA for 20 min at room temperature in a horizontal electrophoresis chamber. It was then removed and immersed in neutralizing buffer (0.4 M Tris-HCl, pH 7.4), and finally stained with 80 μL of ethidium bromide (2 μg/mL in PBS) (27). The amount of DNA damage was determined by visual scoring according to tail intensity using a minor modification of the method described by Angelis et al. (35). The comet assay was calibrated using increasing concentrations of H2O2 to yield different levels of strand breaks in H358 cells. Nucleoids were examined at 200× magnification using an epifluorescence microscope (Nikon Eclipse E600) equipped with an excitation filter of 535 to 550 nm and a barrier filter 590 to 650 nm. To quantify the amount of DNA damage, 100 comets from each slide (3 slides per measurement) were then scored as belonging to one of the five classes according to the tail intensity of the comet and given a value of 0, 1, 2, 3, or 4 (undamaged, 0; slightly damaged, 1; moderately damaged, 2; severely damaged, 3; and very severely damaged, 4). The total score for 100 comets was divided by a factor of 5 to yield an arbitrary value ranging from 0 (if the counted 100 comets were all undamaged) to 80 (if the counted 100 comets were all severely damaged). Cells were then exposed to concentrations of the artificial oxidant KBrO3 (as described below) rather than H2O2 as the artificial oxidant in order to prevent exposure to peroxyl and hydroxyl radicals, which could have produced additional DNA lesions.
Results
Purity of [15N5]-8-Oxo-dGuo
The identity and purity of [15N5]-8-oxo-dGuo was confirmed by LC-MS/MS. The amount of unlabeled 8-oxo-dGuo was found to be <0.02%.
Quantification of 8-Oxo-dGuo
Calibration curves were obtained by plotting the ratio of the peak areas of 8-oxo-dGuo to the internal standard ([15N5]-8-oxo-dGuo) against known amounts of 8-oxo-dGuo in the range of 0.01 ng to 5.00 ng/sample. A linear regression line (y = 0.431x + 0.017; r2 = 0.9993) obtained from unextracted standards was identical to the regression line (y = 0.480x + 0.021; r2 = 0.9996) obtained after immunopurification. Amounts of 8-oxo-dGuo in the study samples were determined by interpolation from the regression line of the standard curve. The amount of endogenous 8-oxo-dGuo in the DNA of unstimulated H358 cells was 0.036 ± 0.004 ng/106 cells. The lower limit of quantitation of 8-oxo-dGuo added to the H358 cells (as defined by better than 20% precision and accuracy between 80% and 120%) was 0.01 ng/106 cells (n = 5) after subtraction of the endogenous 8-oxo-dGuo (0.036 ng; n = 5). This corresponded to 1.1 8-oxo-dGuo/107 dGuo. Accuracies for the quantification of LQC (0.10 ng/106 cells, n = 5), MQC (0.50 ng/106 cells, n = 5), and HQC (1.00 ng/106 cells, n = 5) were between 91.9% and 106.8% after the subtraction of endogenous 8-oxo-dGuo. The precision values were better than ±10% (Table 1).
Table 1. Validation of the 8-Oxo-dGuo Assay in the H358 Cell DNA Hydrolysatea.
| QC | LLQC | LQC | MQC | HQC |
|---|---|---|---|---|
| QC amount (ng) | 0.010 | 0.100 | 0.500 | 1.000 |
| mean (ng) | 0.009 | 0.092 | 0.466 | 1.068 |
| CV (%) | 19.4 | 8.5 | 3.3 | 9.5 |
| accuracy (%) | 90.0 | 91.9 | 93.2 | 106.9 |
The endogenous 8 oxo-dGuo (0.036 ng) was subtracted in order to obtain the accuracy for each QC sample (n = 5).
DNA Extraction Methods
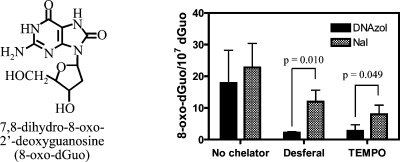
DNA was extracted from H358 cells by two different methods, the NaI method (Wako Kit) and the cold DNAzol method. DNA dissolved very quickly when the NaI method was used. In contrast, extensive pipetting was required with the DNAzol method in order to dissolve the DNA. However, hydrolysis proceeded with equal efficiency for both methods. Results are presented as means ± SD. The cold DNAzol method gave slightly lower 8-oxo-dGuo levels of 17.9 ± 6.0 8-oxo-dGuo/107 dGuo) than the NaI method (22.8 ± 4.4 8-oxo-dGuo/107 dGuo) (Figure 1). In the presence of deferoxamine (0.1 mM), artifactual formation of 8-oxo-dGuo was reduced considerably for both methods (Figure 1). However, the DNAzol method was significantly better (p = 0.010) (Figure 1). Similar results were observed with the addition of TEMPO (p = 0.049, Figure 1). A typical LC-MRM/MS chromatogram from the analysis of 8-oxo-dGuo in H358 cells containing 2.8 8-oxo-dGuo/107 dGuo obtained by the DNAzol/deferoxamine method is shown in Figure 2.
Figure 1.

Formation of 8-oxo-dGuo in human bronchoalveolar H358 cell DNA using different isolation and hydrolysis methods. DNAzol isolation is shown as solid bars and NaI as slanted striped bars. Analyses were conducted by immunoaffinity purification and stable isotope dilution LC-MRM/MS analysis of 8-oxo-dGuo in H358 cell hydrolysate (106 cells) using Chelex-treated buffers in the absence or presence of deferoxamine or TEMPO chelators. Data are presented as means ± SD (error bars) from triplicate samples. P values were determined by an unpaired Student’s t-test.
Figure 2.

Immunoaffinity purification coupled with stable isotope dilution LC-MRM/MS analysis of 8-oxo-dGuo isolated from H358 cell DNA using the DNAzol method with deferoxamine to chelate transition metal ions. The upper panel shows the MRM chromatogram for endogenous 8-oxo-dGuo (2.8 8-oxo-dGuo/107 dGuo), and the lower panel shows the internal standard’s chromatogram.
8-Oxo-dGuo levels in H358, A549, Hepa-1c1c7, and HeLa Cells
The basal 8-oxo-dGuo level in DNA from human bronchoalveolar H358 cells was 2.2 ± 0.4 8-oxo-dGuo/107 dGuo (mean ± SD) or 5.5 ± 1.0 8-oxo-dGuo/108 nucleotides. Similar levels were observed in human lung adenocarcinoma A549 cells, mouse hepatoma Hepa-1c1c7 cells, and human HeLa cervical epithelial adenocarcinoma cells (Table 2).
Table 2. Basal 8-Oxo-dGuo Levels in H358, A549, Hepa-1c1c7, and HeLa Cellsa.
| 8-oxo-dGuo/107 dGuo |
||||
|---|---|---|---|---|
| H358 cells | A549 cells | Hepa1c1c7 cells | HeLa cells | |
| mean | 2.22 | 4.50 | 7.00 | 4.67 |
| SD | 0.37 | 1.72 | 0.99 | 1.05 |
Analyses were conducted in triplicate.
Analysis of 8-Oxo-dGuo in H358 Cells by LC-MRM/MS after DMSO, KBrO3, or MMS Treatment
There was a linear increase of 8-oxo-dGuo concentration in the H358 cellular DNA when the cells were treated with increasing concentrations of DMSO in the range of 0.01% to 2% for 3 h (Figure 3; r2 = 0.996). When DMSO reached a concentration of 2%, there was 23.0 ± 5.4 8-oxo-dGuo/107 dGuo present in the H358 cell DNA. There was also a linear increase in 8-oxo-dGuo levels when the cells were treated with increasing concentrations of KBrO3 in the range of 0.05 mM to 2.50 mM (Figure 4; r2 = 0.962). At 2.50 mM KBrO3, there was 562.2 ± 3.2 8-oxo-dGuo/107 dGuo present in the DNA (Figure 4). Conversely, the alkylating agent MMS showed no increase in 8-oxo-dGuo levels in the range of 5 μM to 20 μM (Figure 5). MMS was dissolved in DMSO to give a final concentration of 2% DMSO in the cell media. Absolute 8-oxo-dGuo levels in the DNA of cells treated with 20 μM MMS (23.0 ± 3.2/107 dGuo, Figure 5) were not significantly different from the cells treated with the DMSO vehicle alone (Figure 3).
Figure 3.

Linear relationship between DMSO treatment and 8-oxo-dGuo formation. DMSO-mediated 8-oxo-dGuo formation in H358 cells was determined by LC-MRM/MS. Data are presented as means ± SD (error bars) from duplicate samples.
Figure 4.

Linear relationship between KBrO3 treatment and 8-oxo-dGuo formation. KBrO3-mediated 8-oxo-dGuo formation in H358 cells was determined by LC-MRM/MS. Data are presented as means ± SD (error bars or within symbols) from duplicate samples.
Figure 5.

MMS-mediated 8-oxo-dGuo formation in H358 cells as determined by LC-MRM/MS (●), comet assay with hOGG1 (◼), or comet assay without hOGG1 (▼). Data are presented as means ± SD (error bars or within symbols) from duplicate samples.
Analysis of 8-Oxo-dGuo in H358 Cells by the Comet Assay after KBrO3 or MMS Treatment
H358 cells were analyzed for comet tail intensities before and after incubation with hOGG1. Tail intensity values were then converted to SSBs (arbitrary units) as described above. Addition of the vehicle used to dissolve KBrO3 (PBS) resulted in SSBs that were close to the limit of detection in the absence (9.9 ± 2.1) or presence of hOGG1 (10.5 ± 0.1) (Figure 6). There was a gradual increase in SSBs in the absence of hOGG1 with increasing concentrations of KBrO3 to a maximum of 22.2 ± 0.3 (Figure 6). In the presence of hOGG1, there was a much greater (nonlinear) increase in SSBs with increasing KBrO3 concentrations to a plateau of 78.1 ± 1.1 at 2.50 mM KBrO3 (Figure 6). Addition of the vehicle used to dissolve MMS (2% DMSO) caused a very slight increase in SSBs in the absence of hOGG1 (12.1 ± 2.3) (Figure 5) when compared with that in the PBS vehicle (9.9 ± 2.1) (Figure 6). A further slight increase in SSBs was observed with the DMSO vehicle (14.0 ± 2.2) if hOGG1 was added when compared with that in PBS (10.5 ± 0.1) or with the absence of hOGG1 (9.9 ± 2.1). A slight increase in SSBs was detected by the comet assay with increasing concentrations of MMS. However, no difference was observed in SSB levels when the assay was performed in the presence or absence of hOGG1 (Figure 5). SSBs were maximal with 20 μM MMS at 24.7 ± 0.1 in the absence of hOGG1 and at 23.6 ± 0.4 in the presence of hOGG1.
Figure 6.

KBrO3-mediated 8-oxo-dGuo formation in H358 cells as determined by the comet assay with hOGG1 (◼) or the comet assay without hOGG1 (▼). Data are presented as means ± SD (error bars or within symbols) from duplicate samples.
Analysis of 8-Oxo-dGuo in H358 Cells by LC-MRM/MS after B[a]P-7,8-dione Treatment
There was a significant increase (p = 0.002) in the amount of 8-oxo-dGuo after treatment of H358 cells with B[a]P-7,8-dione (25.8 ± 3.1 /107 dGuo) when compared with that in the vehicle control (10.0 ± 2.0/107 dGuo) as shown in Figure 7. Treatment of the cells with the COMT inhibitor Ro 410961 (3 μM) caused no increase in 8-oxo-dGuo (9.3 ± 0.4 /107 dGuo). However, the addition of Ro 410961 (3 μM) together with B[a]P-7,8-dione (20 μM) caused a significant increase in 8-oxo-dGuo to 39.6 ± 1.9/107 dGuo when compared with that in B[a]P-7,8-dione alone (p = 0.003, Figure 7).
Figure 7.

Analysis of 8-oxo-dGuo in H358 cells by LC-MRM/MS after treatment with PBS (right slanted stripes), 1% DMSO vehicle (open), B[a]P-7,8-dione (left slanted stripes), 3 μM COMT inhibitor Ro 410961 (shaded), and 3 μM Ro 410961 + 20 μM B[a]P-7,8-dione (basket weave). Data are presented as means ± SD (error bars) from triplicate samples. P values were determined by an unpaired Student’s t-test.
Discussion
ROS are generated during normal cellular metabolism and are detoxified by a suite of antioxidant enzymes including superoxide dismutases (SODs), catalases, glutathione (GSH) peroxidases, and thioredoxins (36−38) as well as by dietary antioxidants (39). There is always a potential for ROS to evade detoxification and cause oxidative damage to cellular DNA (10) as well as to the trinucleotide precursors of DNA (40). Oxidative stress-mediated generation of ROS can result from inflammation (41) and viral and bacterial infections (41) as well as from the metabolism of endogenous molecules such as estrogens (42), drugs such as etoposide (43), and environmental chemicals such as B[a]P (44). 8-oxo-dGuo is by far the most studied lesion that arises through ROS-mediated oxidative damage to DNA (10).
Three base excision repair (BER) enzymes, human MutY homologue (hMutY) (45), hOGG1 (46), and hOGG2 (47), are involved in the repair of 8-oxo-dGuo-derived lesions in DNA, whereas the hydrolase enzyme MTH1 removes 8-oxo-dGuo from the trinucleotide pool (48). It is conceivable that these repair pathways could be overwhelmed by chronic oxidative stress leading to inactivating mutations in tumor suppressor genes such as p53 (49) or activating mutations in protooncogenes such as Ras (50). It is noteworthy that polymorphisms in two of the BER enzymes involved in the repair of oxidative DNA damage are associated with increased cancer risk (51). Germline mutations predispose individuals to hMutY-associated polyposis (MAP), an autosomal recessive disorder characterized by multiple colorectal adenomas and carcinomas (52). hMutY is a DNA glycosylase, which removes adenines mispaired opposite 8-oxo-dGuo in double-stranded DNA (53). This mispairing can arise from either misincorporation of 8-oxo-dGTP opposite adenine in the template strand or misincorporation of dATP opposite unrepaired 8-oxo-dGuo in the template strand during DNA synthesis (54,55). It has been proposed that a failure to correct this mispairing of bases gives rise to the characteristic signature of G → T transversion mutations found in MAP-associated tumors and nonsmall cell lung carcinoma (52). There are also a number of reports that associate mutations in hOGG1 (which excises 8-oxo-guanine from DNA) with increased susceptibility to cancer (56). It has been suggested that the homozygous Cys326/Cys326 hOGG1 genotype might be a biomarker of disease susceptibility (57). Clearly, additional functional and epidemiologic studies are required in order to further clarify the potential relationship between hOGG1 polymorphisms and cancer (46). However, such studies will be critically dependent upon the availability of methodology that can accurately quantify 8-oxo-dGuo (24).
The analysis of 8-oxo-dGuo in cellular DNA using physicochemical methods first requires the isolation and hydrolysis of the DNA. This can result in the artifactual oxidation of a small number of dGuo bases, which results in significantly elevated 8-oxo-dGuo values when compared to that in the comet assay (25). Use of DNAzol instead of the chaotropic agent NaI, coupled with Chelex-treated buffers and deferoxamine to complex any residual transition metal ions, was found to eliminate artifactual oxidation of DNA during isolation and hydrolysis from human bronchoalveolar H358 cells (Figure 1). In a typical experiment designed to examine basal 8-oxo-dGuo, there is a 107 excess of dGuo when compared with 8-oxo-dGuo after hydrolysis of the DNA. Oxidation of 0.00005% of the dGuo would have had a significant impact on the amount of 8-oxo-dGuo. Therefore, we reasoned that it was essential to remove the dGuo as rapidly and as efficiently as possible using immunoaffinity purification. This was coupled with stable isotope dilution LC-MRM/MS to provide maximal specificity (Figure 2). The lower limit of quantitation of 8-oxo-dGuo added to the H358 cell hydrolysate was 0.01 ng/106 cells, which corresponded to 1.1 8-oxo-dGuo/107 dGuo. Rigorous validation of the assay was conducted through analysis of QC samples prepared by adding known amounts of 8-oxo-dGuo to the H358 cell hydrolysate (Table 1). Availability of this new validated assay has made it possible to routinely analyze endogenous concentrations of 8-oxo-dGuo in cellular DNA. Typical levels of 2.2 ± 0.4 8-oxo-dGuo/107 dGuo or 5.5 ± 1.0 8-oxo-dGuo/108 nucleotides were observed in unstimulated resting H358 cells (Figure 1). This is similar to the levels found in other cell types using the comet assay (25). Furthermore, three other cell types were shown to have basal 8-oxo-dGuo concentrations in the same range (Table 2).
A number of previous studies have examined the effects of different methods for the prevention artifactual formation of 8-oxo-dGuo during isolation and hydrolysis of DNA (17,18,30,31,58,59). However, the studies reporting levels of 8-oxo-dGuo similar to those obtained in the present study employed LC-electrochemical detection (17,18,58). Therefore, the characterization of 8-oxo-dGuo relied solely upon the retention time on LC, and therefore, the signal could have arisen from other electrochemically active endogenous compounds with a similar retention time. Furthermore, no corrections were made for recovery of the 8-oxo-dGuo through the isolation procedure at these low levels. The LC-MS method described in the present study used a heavy isotopically labeled internal standard, and therefore, no corrections for recovery through isolation and analysis of the 8-oxo-dGuo were required. The specificity of the LC-MRM/MS method relied upon three parameters: the analyte had to exhibit the same retention time as the internal standard, have the correct molecular mass, and give rise to the correct product ion. No other analytical technique can attain this level of specificity. A recent LC-MRM/MS method, which employed an online solid phase extraction procedure, has reported 8-oxo-dGuo levels in mouse liver DNA that were an order of magnitude higher than those found in the present study (48.0 ± 3.0 8-oxo-dGuo/107 dGuo) (59) and similar to those obtained in previous LC-MS methods (19−25).
KBrO3 is known to induce oxidative DNA damage; paradoxically, the oxidation is GSH-dependent (60). It is thought that the GSH first reduces BrO3 to BrO2, which then abstracts one electron from dGuo to generate a radical cation that adds a molecule of water at C-8 and leads to the formation of 8-oxo-dGuo (61). Thus, KBrO3 provides a way to specifically generate 8-oxo-dGuo in cellular DNA. Unfortunately, a nonlinear response of 8-oxo-dGuo to increasing concentrations of KBrO3 was observed with the comet/hOGG1 assay in H358 cells (Figure 6). This nonlinear response, which was observed previously by Smith et al. (27), makes it difficult to accurately assess the role of oxidative stress in causing oxidative DNA damage. The lowest concentration of KBrO3 that was used (50 μM) caused an almost 4-fold increase over the basal level of 8-oxo-dGuo to 16.9 8-oxo-dGuo/107 dGuo. Furthermore, a linear increase in 8-oxo-dGuo concentrations was observed over the concentration range of KBrO3 that was used (Figure 4). In contrast, at higher concentrations of KBrO3, the comet method did not provide a linear dose−response. Furthermore, there was no cell lethality during short-term incubations.
Availability of this new stable isotope dilution LC-MS assay has made it possible for first time to assess the effects of several exogenous compounds on cellular oxidative DNA damage. Surprisingly, DMSO, which is often used to solubilize exogenously added chemicals, caused oxidative DNA damage to the H358 cells. There was a linear response in 8-oxo-dGuo formation to increasing amounts of DMSO up to a final concentration of 2% (Figure 3). At low concentrations, DMSO is also known to induce membrane thinning and to increase the fluidity of the membrane’s hydrophobic core (62). At higher concentrations, DMSO induces transient water pores into the membrane. Therefore, it is conceivable that this could disrupt mitochondrial membranes causing ROS release and generation of oxidative DNA damage. DMSO is known to scavenge hydroxyl radicals (63,64), which would actually reduce oxidative DNA damage. However, if the 8-oxo-dGuo arose through the formation of singlet oxygen and endoperoxide intermediates (65−67) (Scheme 1) as suggested originally by Ravanat et al. (68,69), then DMSO would be unable to prevent its formation (70). The source of the final oxidant to make 8-oxo-dGuo is a matter of some debate. Sakakibara et al. have shown previously that 8-hydroperoxy-dGuo is not a precursor of 8-oxo-dGuo in vitro using the peroxyl radical generator 2,2′-azobis-(2-aminopropane hydrochloride) (AAPH) to modify dGuo (71). In contrast, when AAPH was used in isolated nuclei, 8-oxo-dGuo was detected. Subsequently, it was proposed that the oxidant required to form 8-oxo-dGuo was an adjacent peroxidized thymidine (dThd) (72). However, it is not clear that the oxidized dThd would be sufficiently close to the dGuo in the DNA to induce the formation of 8-oxo-dGuo. Therefore, in isolated nuclei and in cells, it is conceivable that 8-hydroperoxy-dGuo is processed to 8-oxo-dGuo by an endogenous peroxidase. In the case of DMSO, the increased amounts of 8-oxo-dGuo observed with increasing DMSO concentrations (Figure 3), together with the ability of DMSO to scavenge hydroxyl radicals (63), argues that singlet oxygen is the source in this case. Cadet’s group has shown that singlet oxygen could potentially be the source in other situations (68,69). In addition, we have demonstrated previously that singlet oxygen is the likely source of 8-oxo-dGuo in the presence of CuI and H2O2(67). In the cell, DNA can coordinate CuII, and therefore, Cu-mediated chemistry rather than FeII-driven Fenton chemistry is a distinct possibility for the source of the lesion. However, we cannot completely rule out the possibility that B[a]P-7,8-dione-mediated formation of 8-oxo-dGuo occurs through a hydroxyl radical-mediated pathway.
MMS is a relatively insoluble organic molecule, which alkylates cellular DNA rather than causing oxidative damage. It has been used previously as a negative control to determine whether oxidative stress is being detected erroneously (27). It is necessary to solubilize MMS using 2% DMSO, which based on data from our LC-MRM/MS assay would be expected to induce a small amount of 8-oxo-dGuo formation. In keeping with this expectation, levels of 8-oxo-dGuo observed by LC-MRM/MS after treatment of H358 cells with MMS in 2% DMSO (Figure 4) were similar to the levels observed with 2% DMSO alone (Figure 3). The comet/hOGG1 assay also detected a small increase in oxidative DNA damage resulting from the addition of 2% DMSO to the H358 cells (14.0 ± 2.2) when compared with that in the PBS vehicle (10.5 ± 0.1). A further slight increase in SSBs was observed when increasing concentrations of MMS were added to the cells (Figure 5). However, the increase in SSBs was hOGG1-independent, suggesting that they arose through a methylating pathway that caused strand breaks rather than through oxidative DNA damage. In contrast, the LC-MRM/MS assay did not detect an increase in 8-oxo-dGuo at any of the MMS concentrations that were used (Figure 5).
Availability of this new LC-MRM/MS assay made it possible to rigorously determine whether B[a]P-7,8-dione, a metabolite, derived from the metabolic activation of B[a]P-7,8-dihydro-7,8-diol by AKRs, could induce oxidative DNA damage in human bronchoalveolar H358 cells. Unfortunately, it was necessary to solubilize B[a]P-7,8-dione in 1% DMSO. This vehicle caused a modest increase in oxidative DNA damage in the H358 cells (Figure 3). The presence of B[a]P-7,8-dione caused a significant increase in 8-oxo-dGuo levels (p = 0.002, Figure 7), which suggested that B[a]P-7,8-dione could induce oxidative stress in the H358 cells. We reasoned that the increase in oxidative DNA damage resulted from redox cycling of B[a]P-7,8-dione to the catechol metabolite (Scheme 1). Detoxification of the catechol through COMT-mediated formation of a methyl ether metabolite would then limit the amount of oxidative damage that could occur. In keeping with this possibility, the addition of Ro 410961 (a COMT inhibitor) caused a further significant increase in oxidative DNA damage (p = 0.003, Figure 7). This provided compelling evidence that redox cycling between B[a]P-7,8-dione and its catechol metabolite could occur in the H358 cells (Scheme 1). The ability of human AKRs to activate PAH-trans-dihydrodiols to PAH o-quinones has been extensively studied (73,74) and has been previously shown to result in the production of intracellular reactive oxygen species and change in redox-state in human lung adenocarcinoma A549 cells (44).
In summary, we have eliminated the problems of artifactual oxidation during the isolation and hydrolysis of cellular DNA. The new procedure when coupled with immunoaffinity purification and stable isotope dilution LC-MRM/MS provided a highly specific method of 8-oxo-dGuo analysis that permitted basal concentrations to be determined in resting cells. A linear dose−response to increasing concentrations of KBrO3 was observed by LC-MRM/MS. This contrasted with a comet/hOGG1 assay, which was nonlinear and reached a plateau at 2.50 mM KBrO3. Therefore, the LC-MRM/MS assay has similar sensitivity to the comet assay in detecting oxidative lesions but is more specific. The limit of detection for the LC-MRM/MS assay was 0.01 ng of 8-oxo-dGuo/106 cells or 1.1 8-oxo-dGuo/107 dGuo. DMSO when added to the H358 cells was found to cause oxidative DNA damage, which has implications for experiments in which exogenous chemicals are dissolved in DMSO and added to cells in culture. The amount of DMSO should be kept to a minimum, and rigorous vehicle control experiments should be conducted. No 8-oxo-dGuo was observed after the addition of MMS to H358 cells, which provided additional confidence that the LC-MRM/MS assay was specific for oxidative DNA damage. The assay was used to unequivocally demonstrate that B[a]P-7,8-dione (formed by the sequential action of cytochrome P450, epoxide hydrolase, and AKR1C enzymes from B[a]P) caused cellular oxidative DNA damage. This was thought to arise through the generation of ROS from redox cycling between the B[a]P-7,8-dione and its catechol metabolite (Scheme 1). Finally, our new LC-MRM/MS assay will be valuable for assessing the role of oxidative stress in future functional and epidemiologic studies.
Acknowledgments
This work was supported by NIH grants R01CA130038, R01ES015857, UO1ES016004, and P30ES013508.
Funding Statement
National Institutes of Health, United States
Footnotes
Abbreviations: 8-oxo-dGuo, 7,8-dihydro-8-oxo-2′-deoxyguanosine; AAPH, azo-bis-(2-aminopropane hydrochloride); B[a]P, benzo[a]pyrene; AKR, aldo-keto reductase; BER, base excision repair; COMT, catechol-O-methyl transferase; CV, coefficient of variation; dThd, thymidine; DNAase, bovine pancreas deoxyribonuclease; DMEM, Dulbecco’s modified Eagle’s medium; ESI, electrospray ionization; GSH, glutathione; HBSS, Hank’s balanced salt solution; hMutY, human MutY homologue; hOGG1, 8-oxo-guanine glycosylase-1; HQC, higher quality control; i.d., internal diameter; KBrO3, potassium bromate; LC, liquid chromatography; LLQC, lower limit of quantitation quality control; LQC, lower quality control; mAb, monoclonal antibody; MAP, hMutY-associated polyposis; MQC, middle quality control; MMS, methyl methanesulfonate; MOPS, 3-(N-morpholino)propanesulfonic acid; MRM, multiple reaction monitoring; MS, mass spectrometry; MS/MS, tandem mas spectrometry; PAH, polycyclic aromatic hydrocarbon; PBS, phosphate buffered saline; QC, quality control; ROS, reactive oxygen species; SAP, shrimp alkaline phosphatase; SD, standard deviation; SOD, superoxide dismutase; SSB; single strand break.
References
- Gackowski D.; Rozalski R.; Siomek A.; Dziaman T.; Nicpon K.; Klimarczyk M.; Araszkiewicz A.; Olinski R. (2008) Oxidative stress and oxidative DNA damage is characteristic for mixed Alzheimer disease/vascular dementia. J. Neurol. Sci. 266, 57–62. [DOI] [PubMed] [Google Scholar]
- Nakabeppu Y.; Tsuchimoto D.; Yamaguchi H.; Sakumi K. (2007) Oxidative damage in nucleic acids and Parkinson’s disease. J. Neurosci. Res. 85, 919–934. [DOI] [PubMed] [Google Scholar]
- Bashir S.; Harris G.; Denman M. A.; Blake D. R.; Winyard P. G. (1993) Oxidative DNA damage and cellular sensitivity to oxidative stress in human autoimmune diseases. Ann. Rheum. Dis. 52, 659–666. [DOI] [PMC free article] [PubMed] [Google Scholar]
- Collins A. R.; Gedik C. M.; Olmedilla B.; Southon S.; Bellizzi M. (1998) Oxidative DNA damage measured in human lymphocytes: large differences between sexes and between countries, and correlations with heart disease mortality rates. FASEB J. 12, 1397–1400. [PubMed] [Google Scholar]
- Lee S. H.; Blair I. A. (2001) Oxidative DNA damage and cardiovascular disease. Trends Cardiovasc. Med. 11, 148–155. [DOI] [PubMed] [Google Scholar]
- Ohtsubo T.; Ohya Y.; Nakamura Y.; Kansui Y.; Furuichi M.; Matsumura K.; Fujii K.; Iida M.; Nakabeppu Y. (2007) Accumulation of 8-oxo-deoxyguanosine in cardiovascular tissues with the development of hypertension. DNA Repair (Amsterdam) 6, 760–769. [DOI] [PubMed] [Google Scholar]
- Olinski R.; Gackowski D.; Rozalski R.; Foksinski M.; Bialkowski K. (2003) Oxidative DNA damage in cancer patients: a cause or a consequence of the disease development?. Mutat. Res. 531, 177–190. [DOI] [PubMed] [Google Scholar]
- Caporaso N. (2003) The molecular epidemiology of oxidative damage to DNA and cancer. J. Natl. Cancer Inst. 95, 1263–1265. [DOI] [PubMed] [Google Scholar]
- Loft S.; Moller P. (2006) Oxidative DNA damage and human cancer: need for cohort studies. Antioxid. Redox. Signaling 8, 1021–1031. [DOI] [PubMed] [Google Scholar]
- Cooke M. S.; Evans M. D.; Dizdaroglu M.; Lunec J. (2003) Oxidative DNA damage: mechanisms, mutation, and disease. FASEB J. 17, 1195–1214. [DOI] [PubMed] [Google Scholar]
- Cooke M. S.; Olinski R.; Evans M. D. (2006) Does measurement of oxidative damage to DNA have clinical significance?. Clin. Chim. Acta 365, 30–49. [DOI] [PubMed] [Google Scholar]
- Singh R.; Kaur B.; Kalina I.; Popov T. A.; Georgieva T.; Garte S.; Binkova B.; Sram R. J.; Taioli E.; Farmer P. B. (2007) Effects of environmental air pollution on endogenous oxidative DNA damage in humans. Mutat. Res. 620, 71–82. [DOI] [PubMed] [Google Scholar]
- Gabelova A.; Valovicova Z.; Labaj J.; Bacova G.; Binkova B.; Farmer P. B. (2007) Assessment of oxidative DNA damage formation by organic complex mixtures from airborne particles PM(10). Mutat. Res. 620, 135–144. [DOI] [PubMed] [Google Scholar]
- Loft S.; Moller P.; Cooke M. S.; Rozalski R.; Olinski R. (2008) Antioxidant vitamins and cancer risk: is oxidative damage to DNA a relevant biomarker?. Eur. J. Nutr. 47,, 19–28. [DOI] [PubMed] [Google Scholar]
- Marnett L. J. (2000) Oxyradicals and DNA damage. Carcinogenesis 21, 361–370. [DOI] [PubMed] [Google Scholar]
- Cadet J.; D’Ham C.; Douki T.; Pouget J. P.; Ravanat J. L.; Sauvaigo S. (1998) Facts and artifacts in the measurement of oxidative base damage to DNA. Free Radical Res. 29, 541–550. [DOI] [PubMed] [Google Scholar]
- Pouget J. P.; Douki T.; Richard M. J.; Cadet J. (2000) DNA damage induced in cells by gamma and UVA radiation as measured by HPLC/GC-MS and HPLC-EC and Comet assay. Chem. Res. Toxicol. 13, 541–549. [DOI] [PubMed] [Google Scholar]
- Ravanat J. L.; Douki T.; Duez P.; Gremaud E.; Herbert K.; Hofer T.; Lasserre L.; Saint-Pierre C.; Favier A.; Cadet J. (2002) Cellular background level of 8-oxo-7,8-dihydro-2′-deoxyguanosine: an isotope based method to evaluate artefactual oxidation of DNA during its extraction and subsequent work-up. Carcinogenesis 23, 1911–1918. [DOI] [PubMed] [Google Scholar]
- ESCODD (European Standards Committee on Oxidative DNA damage. (2002) Comparative analysis of baseline 8-oxo-7,8-dihydroguanine in mammalian cell DNA, by different methods in different laboratories: an approach to consensus. Carcinogenesis 23, 2129−2133. [DOI] [PubMed] [Google Scholar]
- Lunec J. (1998) ESCODD: European Standards Committee on Oxidative DNA Damage. Free Radical Res. 29, 601–608. [DOI] [PubMed] [Google Scholar]
- Riis B. (2002) Comparison of results from different laboratories in measuring 8-oxo-2′-deoxyguanosine in synthetic oligonucleotides. Free Radical Res. 36, 649–659. [DOI] [PubMed] [Google Scholar]
- ESCODD (European Standards Committee on Oxidative DNA Damage). (2002) Inter-laboratory validation of procedures for measuring 8-oxo-7,8-dihydroguanine/8-oxo-7,8-dihydro-2′-deoxyguanosine in DNA. Free Radical Res. 36, 239−245. [DOI] [PubMed] [Google Scholar]
- European Standards Committee on Oxidative DNA damage (ESCODD). (2003) Measurement of DNA oxidation in human cells by chromatographic and enzymic methods. Free Radical Biol. Med. 34, 1089−1099. [DOI] [PubMed] [Google Scholar]
- Collins A. R.; Cadet J.; Moller L.; Poulsen H. E.; Vina J. (2004) Are we sure we know how to measure 8-oxo-7,8-dihydroguanine in DNA from human cells?. Arch. Biochem. Biophys. 423, 57–65. [DOI] [PubMed] [Google Scholar]
- Gedik C. M.; Collins A. (2005) Establishing the background level of base oxidation in human lymphocyte DNA: results of an interlaboratory validation study. FASEB J. 19, 82–84. [DOI] [PubMed] [Google Scholar]
- Singh R.; McEwan M.; Lamb J. H.; Santella R. M.; Farmer P. B. (2003) An improved liquid chromatography/tandem mass spectrometry method for the determination of 8-oxo-7,8-dihydro-2′-deoxyguanosine in DNA samples using immunoaffinity column purification. Rapid Commun. Mass Spectrom. 17, 126–134. [DOI] [PubMed] [Google Scholar]
- Smith C. C.; O’Donovan M. R.; Martin E. A. (2006) hOGG1 recognizes oxidative damage using the comet assay with greater specificity than FPG or ENDOIII. Mutagenesis 21, 185–190. [DOI] [PubMed] [Google Scholar]
- Blair I. A. (2005) Mass Spectrometry Approaches to Elucidate the Role of Oxidative Stress in Cancer and Toxicology. InEncyclopedia of Mass Spectrometry (Caprioli R. M., and Gross M. L., Eds.) pp283−307, Elsevier, New York.
- Chomczynski P.; Mackey K.; Drews R.; Wilfinger W. (1997) DNAzol: a reagent for the rapid isolation of genomic DNA. Biotechniques 22, 550–553. [DOI] [PubMed] [Google Scholar]
- Helbock H. J.; Beckman K. B.; Shigenaga M. K.; Walter P. B.; Woodall A. A.; Yeo H. C.; Ames B. N. (1998) DNA oxidation matters: the HPLC-electrochemical detection assay of 8-oxo-deoxyguanosine and 8-oxo-guanine. Proc. Natl. Acad. Sci. U.S.A. 95, 288–293. [DOI] [PMC free article] [PubMed] [Google Scholar]
- Hamilton M. L.; Guo Z.; Fuller C. D.; Van R. H.; Ward W. F.; Austad S. N.; Troyer D. A.; Thompson I.; Richardson A. (2001) A reliable assessment of 8-oxo-2-deoxyguanosine levels in nuclear and mitochondrial DNA using the sodium iodide method to isolate DNA. Nucleic Acids Res. 29, 2117–2126. [DOI] [PMC free article] [PubMed] [Google Scholar]
- Sai K.; Takagi A.; Umemura T.; Hasegawa R.; Kurokawa Y. (1992) Changes of 8-hydroxydeoxyguanosine levels in rat organ DNA during the aging process. J. Environ. Pathol. Toxicol. Oncol. 11, 139–143. [PubMed] [Google Scholar]
- Lee S. H.; Oe T.; Blair I. A. (2001) Vitamin C-induced decomposition of lipid hydroperoxides to endogenous genotoxins. Science 292, 2083–2086. [DOI] [PubMed] [Google Scholar]
- Smithgall T. E.; Harvey R. G.; Penning T. M. (1988) Spectroscopic identification of ortho-quinones as the products of polycyclic aromatic trans-dihydrodiol oxidation catalyzed by dihydrodiol dehydrogenase. A potential route of proximate carcinogen metabolism. J. Biol. Chem. 263, 1814–1820. [PubMed] [Google Scholar]
- Angelis K. J.; Dusinska M.; Collins A. R. (1999) Single cell gel electrophoresis: detection of DNA damage at different levels of sensitivity. Electrophoresis 20, 2133–2138. [DOI] [PubMed] [Google Scholar]
- Sohal R. S.; Weindruch R. (1996) Oxidative stress, caloric restriction, and aging. Science 273, 59–63. [DOI] [PMC free article] [PubMed] [Google Scholar]
- Castro L.; Freeman B. A. (2001) Reactive oxygen species in human health and disease. Nutrition 17, 163–161. [DOI] [PubMed] [Google Scholar]
- Rhee S. G.; Chae H. Z.; Kim K. (2005) Peroxiredoxins: a historical overview and speculative preview of novel mechanisms and emerging concepts in cell signaling. Free Radical Biol. Med. 38, 1543–1552. [DOI] [PubMed] [Google Scholar]
- Seifried H. E.; Anderson D. E.; Fisher E. I.; Milner J. A. (2007) A review of the interaction among dietary antioxidants and reactive oxygen species. J. Nutr. Biochem. 18, 567–579. [DOI] [PubMed] [Google Scholar]
- Cooke M. S.; Olinski R.; Loft S. (2008) Measurement and meaning of oxidatively modified DNA lesions in urine. Cancer Epidemiol. Biomarkers Prev. 17, 3–14. [DOI] [PubMed] [Google Scholar]
- Ames B. N.; Shigenaga M. K.; Hagen T. M. (1993) Oxidants, antioxidants, and the degenerative diseases of aging. Proc. Natl. Acad. Sci. U.S.A 90, 7915–7922. [DOI] [PMC free article] [PubMed] [Google Scholar]
- Bolton J. L.; Trush M. A.; Penning T. M.; Dryhurst G.; Monks T. J. (2000) Role of quinones in toxicology. Chem. Res. Toxicol. 13, 135–160. [DOI] [PubMed] [Google Scholar]
- Zheng N.; Felix C. A.; Pang S.; Boston R.; Moate P.; Scavuzzo J.; Blair I. A. (2004) Plasma etoposide catechol increases in pediatric patients undergoing multiple-day chemotherapy with etoposide. Clin. Cancer Res. 10, 2977–2985. [DOI] [PubMed] [Google Scholar]
- Park J. H.; Mangal D.; Tacka K. A.; Quinn A. M.; Harvey R. G.; Blair I. A.; Penning T. M. (2008) Evidence for the aldo-keto reductase pathway of polycyclic aromatic trans-dihydrodiol activation in human lung A549 cells. Proc. Natl. Acad. Sci. U.S.A. 105, 6846–6851. [DOI] [PMC free article] [PubMed] [Google Scholar]
- Parker A. R.; Eshleman J. R. (2003) Human MutY: gene structure, protein functions and interactions, and role in carcinogenesis. Cell Mol. Life Sci. 60, 2064–2083. [DOI] [PMC free article] [PubMed] [Google Scholar]
- Weiss J. M.; Goode E. L.; Ladiges W. C.; Ulrich C. M. (2005) Polymorphic variation in hOGG1 and risk of cancer: a review of the functional and epidemiologic literature. Mol. Carcinog. 42, 127–141. [DOI] [PubMed] [Google Scholar]
- Hazra T. K.; Izumi T.; Maidt L.; Floyd R. A.; Mitra S. (1998) The presence of two distinct 8-oxoguanine repair enzymes in human cells: their potential complementary roles in preventing mutation. Nucleic Acids Res. 26, 5116–5122. [DOI] [PMC free article] [PubMed] [Google Scholar]
- Nakabeppu Y.; Kajitani K.; Sakamoto K.; Yamaguchi H.; Tsuchimoto D. (2006) MTH1, an oxidized purine nucleoside triphosphatase, prevents the cytotoxicity and neurotoxicity of oxidized purine nucleotides. DNA Repair (Amsterdam) 5, 761–772. [DOI] [PubMed] [Google Scholar]
- Park J. H.; Gelhaus S.; Vedantam S.; Oliva A. L.; Batra A.; Blair I. A.; Troxel A. B.; Field J.; Penning T. M. (2008) The pattern of p53 mutations caused by PAH o-quinones is driven by 8-oxo-dGuo formation while the spectrum of mutations is determined by biological selection for dominance. Chem. Res. Toxicol. 21, 1039–1049. [DOI] [PMC free article] [PubMed] [Google Scholar]
- Li D.; Firozi P. F.; Zhang W.; Shen J.; DiGiovanni J.; Lau S.; Evans D.; Friess H.; Hassan M.; Abbruzzese J. L. (2002) DNA adducts, genetic polymorphisms, and K-ras mutation in human pancreatic cancer. Mutat. Res. 513, 37–48. [DOI] [PubMed] [Google Scholar]
- Nohmi T.; Kim S. R.; Yamada M. (2005) Modulation of oxidative mutagenesis and carcinogenesis by polymorphic forms of human DNA repair enzymes. Mutat. Res. 591, 60–73. [DOI] [PubMed] [Google Scholar]
- Cheadle J. P.; Sampson J. R. (2007) MUTYH-associated polyposis--from defect in base excision repair to clinical genetic testing. DNA Repair (Amsterdam) 6, 274–279. [DOI] [PubMed] [Google Scholar]
- Chow E.; Thirlwell C.; Macrae F.; Lipton L. (2004) Colorectal cancer and inherited mutations in base-excision repair. Lancet Oncol. 5, 600–606. [DOI] [PubMed] [Google Scholar]
- McGoldrick J. P.; Yeh Y. C.; Solomon M.; Essigmann J. M.; Lu A. L. (1995) Characterization of a mammalian homolog of the Escherichia coli MutY mismatch repair protein. Mol. Cell. Biol. 15, 989–996. [DOI] [PMC free article] [PubMed] [Google Scholar]
- Slupska M. M.; Baikalov C.; Luther W. M.; Chiang J. H.; Wei Y. F.; Miller J. H. (1996) Cloning and sequencing a human homolog (hMYH) of the Escherichia coli mutY gene whose function is required for the repair of oxidative DNA damage. J. Bacteriol. 178, 3885–3892. [DOI] [PMC free article] [PubMed] [Google Scholar]
- Collins A. R.; Gaivao I. (2007) DNA base excision repair as a biomarker in molecular epidemiology studies. Mol. Aspects Med. 28, 307–322. [DOI] [PubMed] [Google Scholar]
- Smart D. J.; Chipman J. K.; Hodges N. J. (2006) Activity of OGG1 variants in the repair of pro-oxidant-induced 8-oxo-2′-deoxyguanosine. DNA Repair (Amsterdam) 5, 1337–1345. [DOI] [PubMed] [Google Scholar]
- Hofer T.; Moller L. (1998) Reduction of oxidation during the preparation of DNA and analysis of 8-hydroxy-2′-deoxyguanosine. Chem. Res. Toxicol. 11, 882–887. [DOI] [PubMed] [Google Scholar]
- Chao M. R.; Yen C. C.; Hu C. W. (2008) Prevention of artifactual oxidation in determination of cellular 8-oxo-7,8-dihydro-2′-deoxyguanosine by isotope-dilution LC-MS/MS with automated solid-phase extraction. Free Radical Biol. Med. 44, 464–473. [DOI] [PubMed] [Google Scholar]
- Ballmaier D.; Epe B. (2006) DNA damage by bromate: mechanism and consequences. Toxicology 221, 166–171. [DOI] [PubMed] [Google Scholar]
- Kawanishi S.; Murata M. (2006) Mechanism of DNA damage induced by bromate differs from general types of oxidative stress. Toxicology 221, 172–178. [DOI] [PubMed] [Google Scholar]
- Gurtovenko A. A.; Anwar J. (2007) Modulating the structure and properties of cell membranes: the molecular mechanism of action of dimethyl sulfoxide. J. Phys. Chem. B 111, 10453–10460. [DOI] [PubMed] [Google Scholar]
- Mason R. P.; Hanna P. M.; Burkitt M. J.; Kadiiska M. B. (1994) Detection of oxygen-derived radicals in biological systems using electron spin resonance. Environ. Health Perspect. 102, 33–36. [DOI] [PMC free article] [PubMed] [Google Scholar]
- Santos N. C.; Figueira-Coelho J.; Martins-Silva J.; Saldanha C. (2003) Multidisciplinary utilization of dimethyl sulfoxide: pharmacological, cellular, and molecular aspects. Biochem. Pharmacol. 65, 1035–1041. [DOI] [PubMed] [Google Scholar]
- Seike K.; Murata M.; Oikawa S.; Hiraku Y.; Hirakawa K.; Kawanishi S. (2003) Oxidative DNA damage induced by benz[a]anthracene metabolites via redox cycles of quinone and unique non-quinone. Chem. Res. Toxicol. 16, 1470–1476. [DOI] [PubMed] [Google Scholar]
- Park J. H.; Gopishetty S.; Szewczuk L. M.; Troxel A. B.; Harvey R. G.; Penning T. M. (2005) Formation of 8-oxo-7,8-dihydro-2′-deoxyguanosine (8-oxo-dGuo) by PAH o-quinones: involvement of reactive oxygen species and copper(II)/copper(I) redox cycling. Chem. Res. Toxicol. 18, 1026–1037. [DOI] [PMC free article] [PubMed] [Google Scholar]
- Park J. H.; Troxel A. B.; Harvey R. G.; Penning T. M. (2006) Polycyclic aromatic hydrocarbon (PAH) o-quinones produced by the aldo-keto-reductases (AKRs) generate abasic sites, oxidized pyrimidines, and 8-oxo-dGuo via reactive oxygen species. Chem. Res. Toxicol. 19, 719–728. [DOI] [PMC free article] [PubMed] [Google Scholar]
- Ravanat J. L.; Di M. P.; Martinez G. R.; Medeiros M. H. (2001) Singlet oxygen induces oxidation of cellular DNA. J. Biol. Chem. 276, 40601–40604. [PubMed] [Google Scholar]
- Cadet J.; Douki T.; Ravanat J. L. (2008) Oxidatively generated damage to the guanine moiety of DNA: mechanistic aspects and formation in cells. Acc. Chem. Res. 41, 1075–1083. [DOI] [PubMed] [Google Scholar]
- Brezova V.; Dvoranova D.; Zubor V.; Breza M.; Mazur M.; Valko M. (2007) Photochemical properties of camptothecin in the presence of copper(II) ions: the role of radicals as prospective species in photodynamic therapy. Mol. Biotechnol. 37, 48–51. [DOI] [PubMed] [Google Scholar]
- Sakakibara H.; Ashida H.; Kanazawa K. (2002) A novel method using 8-hydroperoxy-2′-deoxyguanosine formation for evaluating antioxidative potency. Free Radical Res. 36, 307–316. [DOI] [PubMed] [Google Scholar]
- Goto M.; Ueda K.; Hashimoto T.; Fujiwara S.; Matsuyama K.; Kometani T.; Kanazawa K. (2008) A formation mechanism for 8-hydroxy-2′-deoxyguanosine mediated by peroxidized 2′-deoxythymidine. Free Radical Biol. Med. 45, 1318–1325. [DOI] [PubMed] [Google Scholar]
- Palackal N. T.; Burczynski M. E.; Harvey R. G.; Penning T. M. (2001) The ubiquitous aldehyde reductase (AKR1A1) oxidizes proximate carcinogen trans-dihydrodiols to o-quinones: potential role in polycyclic aromatic hydrocarbon activation. Biochemistry 40, 10901–10910. [DOI] [PubMed] [Google Scholar]
- Palackal N. T.; Lee S. H.; Harvey R. G.; Blair I. A.; Penning T. M. (2002) Activation of polycyclic aromatic hydrocarbon trans-dihydrodiol proximate carcinogens by human aldo-keto reductase (AKR1C) enzymes and their functional overexpression in human lung carcinoma (A549) cells. J. Biol. Chem. 277, 24799–24808. [DOI] [PubMed] [Google Scholar]