Abstract
In diabetic nephropathy, glomerular mesangial cells exhibit aberrant anabolic activity that includes excessive production of extracellular matrix (ECM) proteins, leading to crowding of filtration surface areas and possible renal failure. In the present study, a murine mesangial cell line (MES-13 cells) was studied to determine the roles of the renin-angiotensin system (RAS) and the insulin-like growth factor (IGF) axis in the anabolic response to elevated glucose levels. Culture of MES-13 cells in medium containing supra-physiological glucose concentrations (>5.5 mmol/l) resulted in increased production of ECM proteins including laminin, fibronectin, and heparan sulfate proteoglycan with concurrent increases in IGF-binding protein (IGFBP)-2 production. These responses were blocked by the angiotensin receptor antagonists saralasin and losartan, while exogenous angiotensin II (Ang II) treatment directly stimulated increases in ECM and IGFBP-2. In all experiments, IG-FBP-2 levels were correlated with anabolic activity implicating IGFBP-2 as a possible mediator in cellular responses to high glucose and Ang II. Such mediation appears to involve IGFBP-2 modulation of IGF-I signaling, since all responses to high glucose or Ang II were blocked by immuno-neutralization of IGF-I. These data suggest alterations in the IGF axis as key mechanisms underlying nephropathic responses of mesangial cells to Ang II and high glucose.
Keywords: Mesangial cells, Insulin-like growth factor, Angiotensin II, Extracellular matrix, Nephropathy
Introduction
Diabetic nephropathy is characterized by a progressive loss of glomerular filtration surface areas and capillary volumes, due in large part to an aberrant expansion of the mesangial matrix derived from excessive production and deposition of extracellular matrix (ECM) proteins [1, 2]. This glomerulosclerosis results from a hyper-activation of anabolic activity in mesangial cells, and increasing concentrations of glucose are directly correlated with the severity of the aberrant mesangial ECM production, both in vivo and in vitro [3–6]. In mesangial cells cultured under high glucose concentrations (e.g., >20 mmol/l), fibronectin secretion is significantly stimulated [3, 4, 7], in addition to production of laminin, collagens, proteoglycans, and selected other ECM proteins [3, 4, 8, 9]. The cell-regulatory mechanisms by which high glucose induces these pathogenic changes in mesangial cell activity appear to be complex and are not completely understood.
Growth factor systems have been implicated in mediating the effects of high glucose in mesangial cells. These include the renin-angiotensin system (RAS); [10–16], the insulin-like growth factor (IGF) axis [17–22], and transforming growth factor-β1 (TGF-β1); [23–26]. Several studies to date have provided compelling support for the existence of an independent mesangial cell RAS whose activation appears to be critical in the development of diabetic nephropathy [10, 13, 14, 27, 28]. High ambient glucose concentrations stimulate the RAS in mesangial cells, resulting in increased production of angiotensin II (Ang II), the major effector molecule, and activated Ang II signaling via AT1 receptors [13–16]. Exogenous Ang II treatment of mesangial cells stimulates synthesis of fibronectin and other ECM proteins [15, 27, 29]. Furthermore, angiotensin-converting enzyme (ACE) inhibitors and angiotensin receptor blockers effectively attenuate the development of diabetic glomerulosclerotic changes in vivo and in the cellular responses to high glucose in vitro [13, 27, 28, 30].
A mesangial IGF signaling system has also been implicated in diabetic glomerulosclerosis [17, 19–22, 31, 32]. Diabetic mesangial cells or cells cultured in high glucose express increased levels of IGF-I, enhanced IGF receptor expression and binding, and altered levels of IGF-binding proteins (IGFBPs) [18, 21, 33–35]. In vitro studies have demonstrated that exogenous IGF-I treatment of mesangial cells increases their expression of fibronectin, laminin, type-IV collagen, proteoglycans, and other ECM proteins, while administration in diabetic rats with the IGF type-I receptor antagonist, JB3, attenuates diabetes-induced nephropathic changes [36–40]. Moreover, the actions of IGF-I in mesangial cells appear to include inhibition of apoptosis and DNA damage induced by high glucose [41, 42].
The kidney expresses all six IGFBPs, of which IGFBP-1 and IGFBP-2 have been observed to exhibit increased tissue levels during the onset of diabetic nephropathy [19, 21, 22, 32, 33, 43–45]. IGFBPs bind IGF peptides with high affinities and can modulate IGF localization to cellular targets and IGF receptor activation [46, 47]. However, the roles of IGFBPs in diabetic nephropathy are not understood, and there have been very limited in vitro analyses of their activity in mesangial cells [18, 35, 48, 49]. Furthermore, the potential relationship between the IGF axis and the RAS in driving the ECM production has not been investigated. The present study demonstrates that the ECM synthetic response of murine mesangial (MES-13) cells to Ang II and to high glucose is dependent upon IGF-I, and a potential role of Ang II-stimulated IGFBP-2 in these responses is proposed.
Results
Culture of MES-13 cells in medium containing glucose concentrations above the physiological norm (>5.5 mmol/l) resulted in significant increases in the production of several ECM components and this occurred simultaneous to increases in IGFBP-2. As illustrated in Fig. 1, incubation of MES-13 cells in Dulbecco’s Modified Eagle’s Medium (DMEM) containing 25 mmol/l glucose elicited a 4.5 ± 0.4-fold increase in IGFBP-2 as compared with that in DMEM containing 5.5 mmol/l glucose (P < 0.001). This increase in IGFBP-2 was paralleled by 3- to 5-fold increases in the production of laminin, fibronectin, and heparan sulfate proteoglycan (Fig. 1b–d). Highly consistent results were obtained in experiments using incubation times of 24–96 h (Fig. 1 data are from 72-h experiments).
Fig. 1.
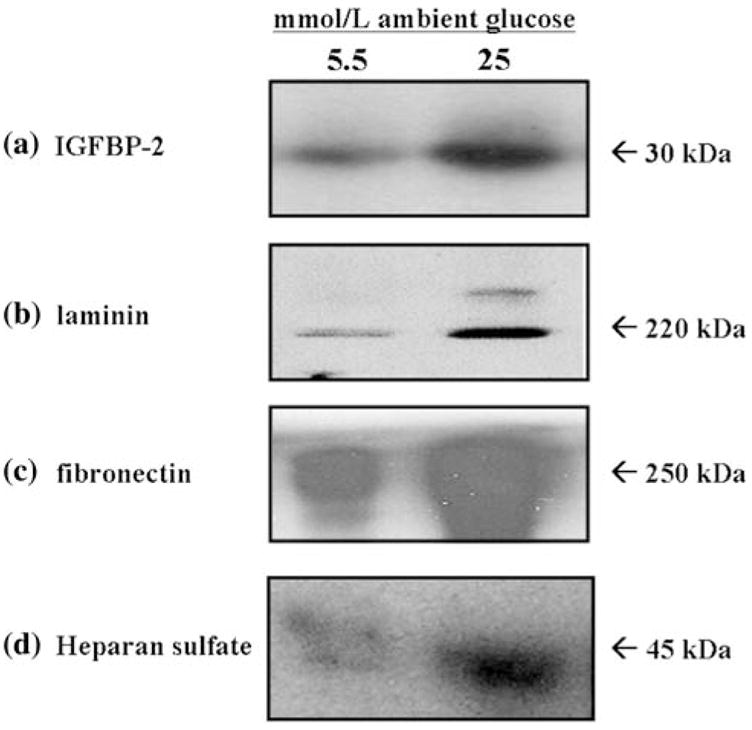
Effect of increased ambient glucose concentration on production of IGFBP-2 and ECM components in cultured MES-13 cells. Data shown are from cells cultured for 72 h in medium containing 5.5 or 25 mmol/l glucose. IGFBP-2 (a), laminin (b), fibronectin (c), and heparan sulfate (d) were each measured using Western immunoblot analysis as described in Methods. Data illustrated are representative of experiments repeated four separate times (n = 4). MES-13 cells cultured in 25 mmol/l glucose concentrations exhibited >3-fold increases in each measured component as compared with corresponding levels in cells cultured in 5.5 mmol/l glucose
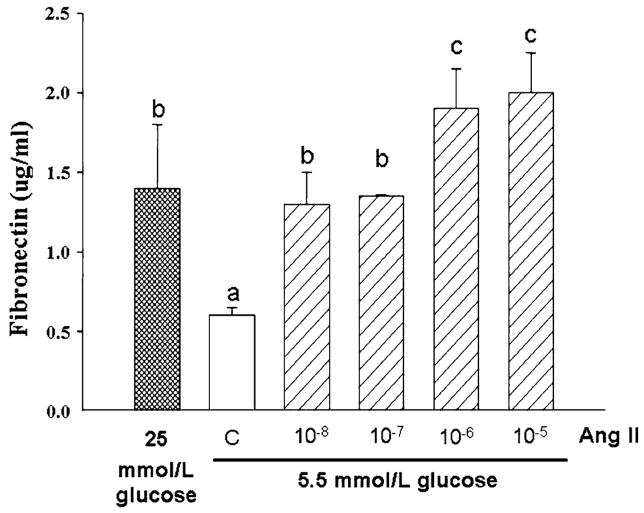
Given these results and that Ang II reportedly stimulates mesangial cell ECM production in the response to high glucose [10–16, 27–30], it was next determined whether Ang II may also affect production of IGFBP-2 and ECM in MES-13 cells. In DMEM containing 5.5 mmol/l glucose concentration, addition of Ang II at concentrations between 10−8 and 10−5 M resulted in dose-dependent increases in IGFBP-2, to levels comparable with those observed in response to stimulation by 25 mmol/l glucose (Fig. 2; >3-fold increases at Ang II concentrations above 10−8 M, P < 0.05); when tested in 25 mmol/l glucose DMEM, however, Ang II did not induce further increases in IGFBP-2 (data not shown). In parallel with the increases in IGFBP-2 in response to Ang II were significant, 3- to 4-fold increases in secreted fibronectin (P< 0.01; Fig. 3). The increases in fibronectin production in response to Ang II in 5.5 mmol/l glucose DMEM were similar to those activated by 25 mmol/l glucose (Fig. 3), while Ang II had no additional effect on fibronectin production when added to the 25 mmol/l glucose medium (data not shown).
Fig. 2.

Effect of increasing Ang II concentrations on IGFBP-2 production in MES-13 cells. In cells cultured in 5.5 mmol/l glucose medium, addition of Ang II at concentrations between 10−8 and 10−5 M elicits a dose-related increase in IGFBP-2. Recombinant bovine IGFBP-2 (rBP-2; 1 μg; far left lane) serves as a positive control for the Western immunoblot procedure; data shown represent 72 h culture experiments
Fig. 3.
Effect of increasing Ang II concentrations on fibronectin production in MES-13 cells as measured by ELISA. In cells cultured in 5.5 mmol/l glucose medium, addition of Ang II at concentrations between 10−8 and 10−5 M resulted in a dose-related increase in fibronectin levels in conditioned medium (P<0.01). Data shown were generated from four separate 72 h culture experiments. a,b,c Superscripts denote significantly different mean fibronectin concentrations (P < 0.05)
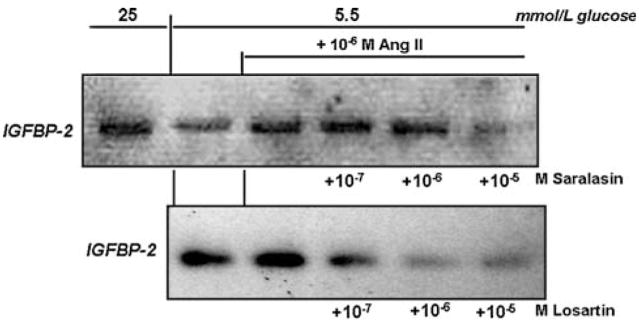
It was next investigated whether the increases in production of IGFBP-2 and ECM in response to Ang II and to high glucose may be transduced through angiotensin receptor activation. Two Ang II receptor antagonists were employed: saralasin, a general receptor antagonist: and losartan, a specific AT1 receptor antagonist [50]. As shown in Fig. 4, both antagonists were capable of blocking the stimulatory effect of Ang II on IGFBP-2 production in MES-13 cells. As in the former experiments, cells cultured in the presence of 10−6 M Ang II produced IGFBP-2 at a level comparable to that in high glucose-stimulated cells; however, the addition of saralasin reduced IGFBP-2 to non-stimulated control levels (P < 0.05, 10−5 M saralasin, Fig. 4). Ang II-induced IGFBP-2 was also strongly inhibited by the AT1 receptor antagonist, losartan, at concentrations of 10−7 to 10−5 M (Fig. 4). The changes in production of ECM components corresponded with the observed changes in IGFBP-2. As shown in Fig. 5, losartan inhibited Ang II-stimulated production of fibronectin and laminin at the concentrations that it blocked IGFBP-2 production. In addition to blocking the effects of Ang II directly, the receptor antagonists also effectively blocked high glucose-induced changes in MES-13 cells. As illustrated in Fig. 6, addition of losartan to MES-13 cells cultured in 25 mmol/l glucose medium resulted in a dose-dependent inhibition of fibronectin and laminin production. Similarly, IGFBP-2 production by MES-13 cells cultured in 25 mmol/l glucose was inhibited in the presence of receptor antagonists (Fig. 7).
Fig. 4.
Effect of angiotensin receptor antagonists on Ang II-induced IGFBP-2 secretion. Addition of 10−6 M Ang II increased IGFBP-2 to the level observed in high glucose (25 mmol/l)-treated cells, whereas this effect was blocked in the presence of saralasin (to 13.8% of Ang II-stimulated IGFBP-2 at 10−5 M saralasin dose; upper panel) or losartan (to undetectable levels at the two highest losartan doses; lower panel). Data shown represent 72 h culture experiments, which were repeated three times with the same result
Fig. 5.
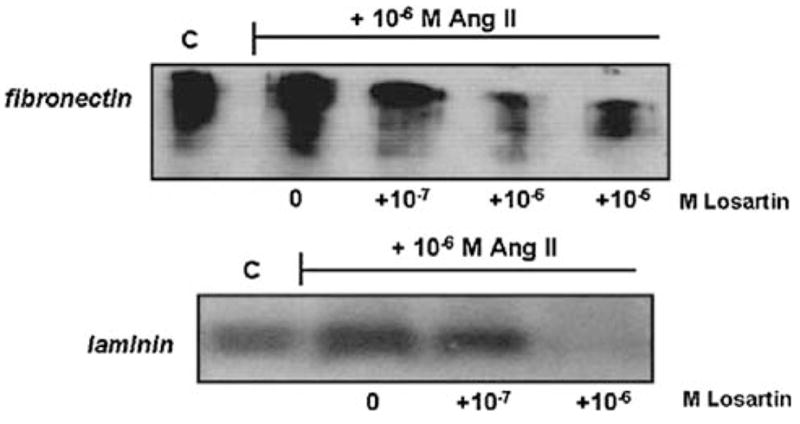
Effect of the AT1 angiotensin receptor antagonist, losartan, on Ang II-induced ECM production. Fibronectin production stimulated by 10−6 M Ang II (upper panel) is reduced by addition of losartan at concentrations ≥10−7 M (to <30% of Ang II-stimulated levels at 10−6 and 10−5 M losartan, P < 0.05). Ang II-stimulated laminin production is also reduced by losartan to undetectable levels at 10−6 M (lower panel). Data shown represent 72 h experiments, which were repeated three times with the same result. Similar effects of the general antagonist, saralasin, are observed under the same experimental conditions (data not shown)
Fig. 6.
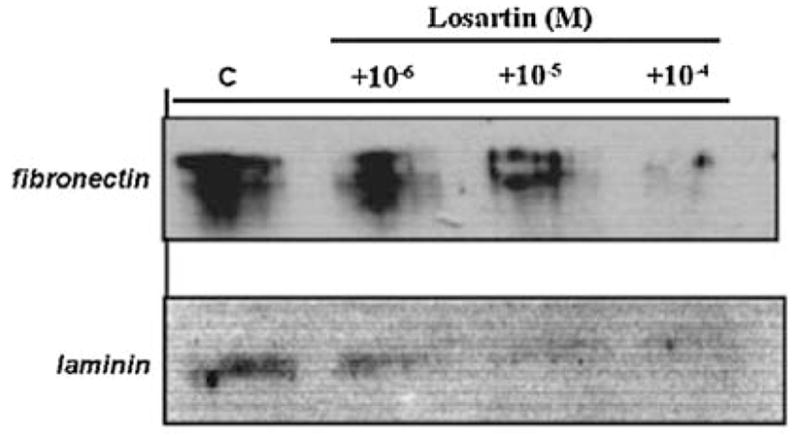
Effect of the AT1 receptor antagonist, losartan, on fibronectin (upper panel) and laminin (lower panel) production in MES-13 cells cultured in high glucose (25 mmol/l) medium. Losartan reduced levels of both ECM proteins in a dose-dependent manner in MES-13 cells cultured in 25 mmol/l glucose medium (by >50% at 10−6 M for both fibronectin and laminin). Data shown represent 72 h experiments, which were repeated three times with the same result. Similar effects of the general antagonist, saralasin, are observed under the same experimental conditions (data not shown).
Fig. 7.
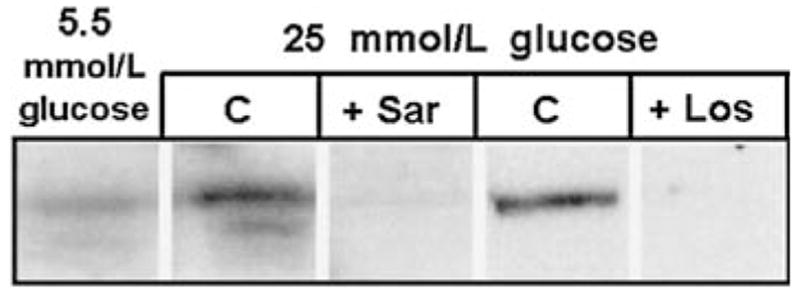
Effect of angiotensin receptor antagonists on high glucose-induced IGFBP-2 production. MES-13 cells cultured in the presence of 25 mmol/l glucose (“C” lanes) exhibit a 4.5 ± 0.7-fold increase in IGFBP-2 (P < 0.05 vs. cells in 5.5 mmol/l glucose medium, n = 4). However, the addition of 10−6 M saralasin (“+Sar” lane) or losartan (“+Los” lane) blocks this effect, resulting in undetectable levels of IGFBP-2. Data shown represent 72 h experiments, which were repeated three times with the same result
The increases in IGFBP-2 production elicited by 25 mmol/l glucose and transduced via the AT1 receptor prompted the hypothesis that IGFBP-2 may play a mediating role in the ECM synthetic response of MES-13 cells to elevated ambient glucose. Similarly, it was of interest to determine whether these responses were dependent upon IGF signaling. To block IGFBP-2 and IGF-I activity in MES-13 cells, immuno-neutralization strategies were pursued. Two different anti-IGFBP-2 antibodies (see Methods) were tested in the MES-13 cell, but they were without detectable effect on any of the measured parameters under either basal or glucose-stimulated conditions (data not shown). However, IGF-I immuno-neutralization using the anti-rat IGF-I antiserum effectively blocked the effects of both high glucose and Ang II on IGFBP-2 and ECM production. As illustrated in Fig. 8, the fibronectin synthetic response to 25 mmol/l glucose could be completely blocked in IGF-I immuno-neutralized cells. Addition of the anti-IGF-I antiserum at titers of 1:10,000 and 1:5,000 resulted in a dose-related decrease in the glucose-induced fibronectin level (P < 0.05) which, at the higher antibody titer, was not significantly different from that in unstimulated cells in the 5.5 mmol/l glucose DMEM. In similar fashion, glucose-induced IGFBP-2 levels were decreased in a dose-related manner in the presence of increasing antibody titer (lower panel, Fig. 8).
Fig. 8.
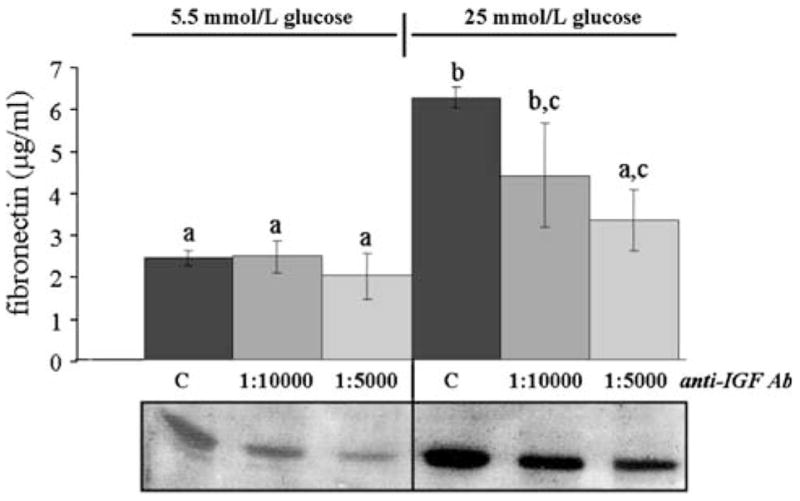
Effect of IGF-I immuno-neutralization on high glucose-induced fibronectin and IGFBP-2 production. MES-13 cells were cultured under basal (5.5 mmol/l) or high (25 mmol/l) glucose conditions without (“C” = controls) or with IGF-I antiserum added at 1:10,000 or 1:5,000 titers. Fibronectin levels were measured using ELISA, as described in Methods; bars represent mean ± SE values (n = 6/mean), with different a,b,c superscripts indicating significantly different values (P < 0.05). IGFBP-2, measured by Western immunoblot procedure, is shown in the lower panels. Immuno-neutralization of IGF-I inhibits the high glucose-induced increases in fibronectin and IGFBP-2
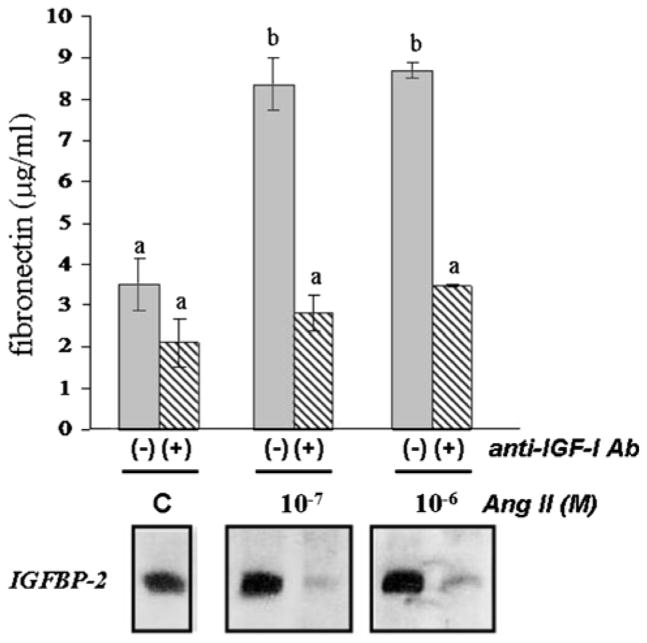
Similar to its effect on MES-13 cell response to high glucose, IGF-I immuno-neutralization also blocked the response to Ang II (Fig. 9). Concentrations of 10−7 and 10−6 M Ang II, which stimulated both fibronectin and IGFBP-2 production (as in Figs. 2–5), were rendered ineffective in the presence of the anti-IGF-I antiserum (P < 0.01). Two different IGFBP-2 antisera, which bound IGFBP-2 in highly specific fashion in the immunoblots, failed to affect any of these parameters (data not shown); thus, the effect of immuno-neutralizing IGF-I was not likely due to non-specific interactions of the anti-IGF-I.
Fig. 9.
Effect of IGF-I immuno-neutralization on Ang II-induced fibronectin and IGFBP-2 production. MES-13 cells were cultured under basal glucose conditions (5.5 mmol/l; “C” indicates non-hormone-treated control) and treated with 10−7 or 10−6 M Ang II in the absence [“(−)” lanes] or presence [“(+)” lanes] of IGF-I antiserum at a titer of 1:5,000. Fibronectin levels (upper panel) were measured using ELISA, as described in Methods; bars represent mean ± SD values (n = 6/mean), with a,b superscripts indicating significantly different values (P < 0.05). IGFBP-2, measured by Western immunoblot procedure, is shown in the lower panels. Immuno-neutralization of IGF-I inhibits Ang II-induced increases in fibronectin and decreases IGFBP-2 to non-detectable levels
Discussion
The present study confirms previously published evidence that the stimulatory effects of high glucose on ECM production in glomerular mesangial cells are mediated, at least in part, through Ang II signaling. However, it was also determined that these well-documented cellular responses, at least in the MES-13 cell model, require mediation through the local IGF axis. Whether by high glucose or Ang II treatment, stimulated MES-13 cells consistently showed increased IGFBP-2 levels, while in contrast, low IGFBP-2 levels were correlated with reduced anabolic activity in MES-13 cells. While the present findings implicate IGFBP-2 as a mediator in cell responses to high glucose and Ang II, such mediation would appear to involve modulation of IGF-I signaling, since IGF-I immuno-neutralization blocked the responses to both high glucose and Ang II.
Ang II is classically known as a vasoactive agent acting both systemically and in local circulations, and is now known to possess a variety of biological actions that include cytokine activity in renal pathologies. An independent, intra-renal RAS appears to play a direct role in the development of diabetic nephropathy [10, 12–14, 28], with a separate glomerular RAS supported by the demonstration of mesangial cell expression of angiotensinogen, renin, angiotensin I, ACE, Ang II, and AT1 receptors [14, 36, 51, 52]. In cultured glomerular mesangial cells, direct Ang II treatment increases synthesis of ECM proteins including fibronectin and laminin [3, 15, 29] and the stimulatory effects of high glucose on ECM appear to be dependent upon Ang II signaling, since angiotensin receptor antagonists including saralasin (general antagonist) and losartan (specific AT1 antagonist) block the cellular responses to high glucose [13–16, 53]. In vivo, angiotensin receptor antagonists as well as ACE inhibitors are also effective in attenuating the development of diabetic glomerulosclerosis [10, 12, 28]. Thus, an important role of the RAS in diabetic nephropathy is well supported, and the present results on MES-13 cells are consistent with this scenario.
A potential role for IGFBP-2 in the cell-regulatory mechanisms underlying diabetic nephropathy has not been widely considered, which in part may be due to reports that renal IGFBP-2 mRNA expression in vivo remains unaltered with the onset of diabetes [17, 19, 21, 44). However, other studies have reported that renal levels of IGFBP-2 protein increase with the onset of glomerulosclerosis [43, 49], and circulating IGFBP-2 levels may also be increased in diabetes [32, 54, 55]. In addition, a host of studies support IGFBP-2 having anabolic actions in different experimental cell models, although in other cell models it has also been reported to exert inhibitory effects [47, 56–59].
To our knowledge, there are no prior reports on Ang II effects on IGFBP expression in mesangial cells. In the present study, we demonstrated that Ang II stimulates IGFBP-2 production in a significant, dose-dependent manner in MES-13 cells, which occurred simultaneously with its well-established stimulatory effects on production of ECM proteins (fibronectin and laminin). Since all these cellular responses were effectively blocked by the addition of saralasin and in particular losartan, they appear to be mediated via the AT1 receptor. High glucose treatment, which also stimulated both IGFBP-2 and ECM production, was similarly rendered ineffective by treatment with saralasin or losartan.
The coincident alterations in IGFBP-2 and ECM production prompted the hypothesis that the IGF axis may play a mediating role in the MES-13 cell synthetic responses to high glucose and to Ang II. The present findings demonstrated that immuno-neutralization of IGF-I was capable of completely blocking the MES-13 cell responses to high glucose, as well as to Ang II. These results indicate that IGF signaling is required for the anabolic response to high glucose, in agreement with previous studies on other cultured mesangial cells [34, 49], and they also provide new evidence that IGF signaling is required for the anabolic effects of Ang II in the response of mesangial cells to elevated ambient glucose. It was notable that fibronectin production in cells cultured under basal (5.5 mmol/l) glucose concentrations (see Fig. 8) was unaffected by the IGF-I neutralization, in contrast to the effective blockage of high glucose-stimulated fibronectin production. These findings suggest that IGF signaling importantly mediates the anabolic response to high glucose (and Ang II), while its role in maintaining fibronectin production under normal (basal) glucose conditions is not yet clear.
IGFBP-2 levels were significantly reduced by IGF-I neutralization, which was observed under any glucose concentration. These findings are consistent with previous studies demonstrating IGF regulation of IGFBP-2 expression in different cell types, including mesangial cells of different origins [34, 49, 58, 60, 61]. The observed correlations between IGFBP-2 and fibronectin production in MES-13 cells activated by high glucose and Ang II suggest involvement of IGFBP-2 in mediating or influencing the synthetic response; however, such a mediating role for IGFBP-2 would most likely involve modulation of IGF-I action, given the effective blocking of the anabolic response by neutralization of IGF-I. A recent study by Fornoni et al. [49] suggests that the presence of IGFBP-2 may serve to attenuate IGF signaling in mesangial cells, and that susceptibility to high glucose induction is related to the ratio of IGF-I receptor to IGFBP-2 (i.e., relatively lower IGFBP-2 leading to greater receptor activation by high glucose). Alternatively, studies in other cell types suggest mechanisms by which IGFBP-2/IGF complexes associate with cell surface ECM and promote anabolic cellular responses [60]. The potential of these kinds of mechanisms and the putative role of IGFBP-2 in the MES-13 cell response to diabetic factors deserve further study.
In conclusion, the MES-13 mesangial cell shows activated ECM production in response to high glucose concentrations, a response that is dependent upon signaling through the RAS. In turn, these effects of the RAS appear to be substantially mediated via IGF-I signaling. In addition, a putative role of IGFBP-2 in this mediation is suggested by its correlated responses with ECM production and stimulation by high glucose or by Ang II treatment. Continued studies should be aimed at understanding the activity of IGFBP-2 in mesangial cells responding to diabetic factors, and at the possible interaction of the IGF axis with other cytokine systems, such as TGFβ1.
Materials and methods
Cell culture
Murine mesangial (MES-13) cells were acquired from American Type Culture Collection (Rockville, MD) and are derived from an SV-40 transgenic line exhibiting functional and morphological characteristics of primary mesangial cells [62]. MES-13 cells were advantageous to use in the present study since prior studies indicated that these cells express IGFBP-2 exclusive of the other IGFBPs and their potential interference [35, 46]. MES-13 cells were grown in 24-well Falcon culture plates containing DMEM and Ham’s F-12 (2:1 mixture), 5% fetal bovine serum, and 1% penicillin-streptomycin fungizone (all culture media and supplies obtained from Invitrogen GIBCO, Bethesda, MD), maintained at 37°C under 95% O2/5% CO2. For experiments, cells were initially grown to 90% confluency, washed with 0.5 ml Dulbecco’s Phosphate Buffered Saline (PBS), followed by pre-culture in 0.3 ml serum-free DMEM (SF-DMEM) for 24 h to attain quiescence.
During experiments, cells were cultured for 72 h in 0.3 ml SF-DMEM containing 5.5 or 25 mmol/l glucose concentrations; the 5.5 mmol/l glucose DMEM was prepared by combining appropriate volumes of osmotically balanced 0 and 25 mmol/l glucose SF-DMEM (Invitrogen GIBCO). Effects of ligands and antisera (outlined below) were tested under differing glucose concentrations, as described for each experiment in the Results. Ang II (Sigma Chemical Co., St. Louis, MO) was tested at concentrations of 10−8–10−5 M. The general Ang II receptor antagonist, saralasin (Sigma), and a specific inhibitor for the AT1 receptor, losartan (provided by Merck & Co., Du Pont, Inc., Whitehouse Station, NJ), were tested at concentrations of 10−10–10−4 M. Antisera used for immuno-neutralization experiments included rabbit anti-rat IGF-I (Eli Lilly & Co., Indianapolis, IN), rabbit anti-bovine IG-FBP-2 (Upstate Biotech, Inc., Waltham, MA), and goat anti-mouse IGFBP-2 (Santa Cruz Biotech, Santa Cruz, CA). Neither IGFBP-2 antisera affected any of the parameters measured in our assays.
Conditioned media from experimental cultures were collected and analyzed by Western immunoblot for fibronectin, laminin, and heparan sulfate. Enzyme linked immunosorbent assay (ELISA) was used to quantify secreted fibronectin (procedure described below). IGFBP-2 in the medium was analyzed by Western-ligand blot procedure, as described in Kelley et al. [63], and by Western immuoblotting (procedure described below). Experiments were repeated at least three separate times each, with representative experiments illustrated in the figures.
Western immunoblot analysis
Conditioned media were prepared in SDS PAGE loading buffer with 5% beta-mercaptoethanol (Sigma) and run into 7.5% (for fibronectin, laminin) or 10% (for IGFBP-2, heparin sulfate) acrylamide/Bis-acrylamide (29:1) gels (reagents from BioRad Laboratories, Hercules, CA), as previously described [63]. Proteins were transferred from gels to nitrocellulose membranes (Osmonics, Westborough, MA) and blocked overnight in 5% milk in Tris-buffered saline (TBS) with 0.1% Tween-20 (Bio-Rad; TBST). Membranes were then incubated for 1 h in solutions of primary antibody at a titer of 1:2,000 in TBST, using antisera for IGFBP-2 (above) or goat polyclonal antisera for fibronectin (Invitrogen GIBCO), laminin (Sigma), or heparan sulfate (Calbiochem, La Jolla, CA). After incubation, membranes were washed in TBST and incubated 30 min with secondary antibody conjugated to horse radish peroxidase (HRP; Santa Cruz Biotech) at titers of 1:2,000–1:5,000 in TBST. Membranes were then incubated in Enhanced Chemiluminescence solution (Santa Cruz Biotech) for 1 min and placed against Kodak Biomax MS film (Kodak, Rochester, NY) for 30 s–5 min. Films were developed using a Kodak M35AX-OMAT automatic developer (Kodak). Recombinant rat IGFBP-2 (GroPep, Ltd., Adelaide, Australia), mouse laminin (Sigma), and rat fibronectin (Sigma) were used as positive controls.
Enzyme linked immunosorbent assay (ELISA)
Fibronectin concentrations from MES-13 cell media were measured using an ELISA. Ninety-six well ELISA plates (Sigma) were coated with 50 μl of media or 0.1–10 μg/ml recombinant bovine fibronectin standard (Sigma) per well overnight at 4°C. Wells were then washed twice in PBS containing 0.1% Tween-20 (PBST), and blocked with 100 μl 1% BSA in PBST for 1 h at room temperature, to inhibit non-specific binding. Polyclonal rabbit anti-goat fibronectin (Santa Cruz Biotech) was added at a 1:1,000 titer to each well in a volume of 50 μl and incubated for 1 h at room temperature. Following three washes in PBST, wells were incubated in PBST containing goat anti-rabbit IgG HRP-conjugated secondary antibody (Santa Cruz Biotech; 1:2,000 titer, 50 μl volume) for 1 h at room temperature. Wells were finally washed six times with PBST, and color reactions were carried out using the Microwell Peroxidase Substrate System (KPL, Inc., Gaithersburg, MD) according to the manufacturer’s instructions. Absorbances were read at 405 nm on a Spectramax 250 microplate spectrophotometer (Molecular Devices, Sunnyvale, CA), and concentrations in μg/ml were calculated from a standard curve using SOFTmax PRO software (Molecular Devices).
Data analysis
Gel densitometric values, obtained using Image J software (http://rsb.info.nih.gov/ij) from jpegs of scanned gels, were used to calculate fold- or % differences between selected groups (e.g., low glucose control vs. Ang II doses in low glucose); means ± SEM of these values were then compiled from different gels (separate culture experiments) and analyzed by Student’s t-test or ANOVA using SigmaStat v. 3.1 software (SPSS, Inc., Chicago, IL). Results of ELISA (presented as means ± SEM of μg/ml concentrations) were analyzed by ANOVA followed by Fisher’s Least Significant test. Differences were considered significant when P < 0.05.
Acknowledgments
The authors would like to thank Merck & Co., Inc. for generously providing losartan. They also acknowledge funding by CSULB University Scholarly and Creative Activities Awards and Howard Hughes Medical Institute Grant #52002663.
References
- 1.Steffes M, et al. Diabetes. 1989;38:1077–1081. doi: 10.2337/diab.38.9.1077. [DOI] [PubMed] [Google Scholar]
- 2.Simonson MS. Kidney Int. 2007;71:846–854. doi: 10.1038/sj.ki.5002180. [DOI] [PubMed] [Google Scholar]
- 3.Ayo SH, et al. Am J Physiol. 1991;260:F185–F191. doi: 10.1152/ajprenal.1991.260.2.F185. [DOI] [PubMed] [Google Scholar]
- 4.Wahab NA, Harper K, Mason RM. Biochem J. 1996;316:985–992. doi: 10.1042/bj3160985. [DOI] [PMC free article] [PubMed] [Google Scholar]
- 5.Lehmann R, Schleicher ED. Clin Chim Acta. 2000;297:135–144. doi: 10.1016/s0009-8981(00)00240-0. [DOI] [PubMed] [Google Scholar]
- 6.Mason RM, Abdel Wahab NA. J Am Soc Nephrol. 2003;14:1358–1373. doi: 10.1097/01.asn.0000065640.77499.d7. [DOI] [PubMed] [Google Scholar]
- 7.Oh JH, et al. Kidney Int. 1998;54:1872–1878. doi: 10.1046/j.1523-1755.1998.00193.x. [DOI] [PubMed] [Google Scholar]
- 8.Kitamura M, et al. Biochem Biophys Res Commun. 1992;185:1048–1054. doi: 10.1016/0006-291x(92)91732-6. [DOI] [PubMed] [Google Scholar]
- 9.Schena FP, Gesualdo L. J Am Soc Nephrol. 2005;16:S30–S33. doi: 10.1681/asn.2004110970. [DOI] [PubMed] [Google Scholar]
- 10.Leehey D, et al. Kidney Int Suppl. 2000;77:S93–98. doi: 10.1046/j.1523-1755.2000.07715.x. [DOI] [PubMed] [Google Scholar]
- 11.Hsueh WA, et al. Adv Exp Med Biol. 1995;377:217–223. doi: 10.1007/978-1-4899-0952-7_12. [DOI] [PubMed] [Google Scholar]
- 12.Mezzano SA, Ruiz-Ortega M, Egido J. Hypertension. 2001;38:635–638. doi: 10.1161/hy09t1.094234. [DOI] [PubMed] [Google Scholar]
- 13.Singh R, et al. Diabetes. 1999;48:2066–2073. doi: 10.2337/diabetes.48.10.2066. [DOI] [PubMed] [Google Scholar]
- 14.Singh R, et al. J Am Soc Nephrol. 2003;14:873–880. doi: 10.1097/01.asn.0000060804.40201.6e. [DOI] [PubMed] [Google Scholar]
- 15.Ikehara K, et al. Diabetes Res Clin Pract. 2003;59:25–30. doi: 10.1016/s0168-8227(02)00194-8. [DOI] [PubMed] [Google Scholar]
- 16.Vidotti DB. Am J Physiol Renal Physiol. 2004;286:F1039–F1045. doi: 10.1152/ajprenal.00371.2003. [DOI] [PubMed] [Google Scholar]
- 17.Landau D, et al. Endocrinology. 1995;136:1835–1842. doi: 10.1210/endo.136.5.7536658. [DOI] [PubMed] [Google Scholar]
- 18.Pugliese G, et al. Diabetologia. 1996;39:775–784. doi: 10.1007/s001250050510. [DOI] [PubMed] [Google Scholar]
- 19.Cingel-Ristic V, Flyvbjerg A, Drop SL. Growth Horm IGF Res. 2004;14:418–430. doi: 10.1016/j.ghir.2004.06.003. [DOI] [PubMed] [Google Scholar]
- 20.Flyvbjerg A, et al. Metabolism. 1995;44:67–71. doi: 10.1016/0026-0495(95)90223-6. [DOI] [PubMed] [Google Scholar]
- 21.Flyvbjerg A, et al. Curr Pharm Des. 2004;10:3385–3394. doi: 10.2174/1381612043383106. [DOI] [PubMed] [Google Scholar]
- 22.Vasylyeva TL, Ferry RJ., Jr Diabetes Res Clin Pract. 2006;76:177–186. doi: 10.1016/j.diabres.2006.09.012. [DOI] [PMC free article] [PubMed] [Google Scholar]
- 23.Liu Y. Kidney Int. 2006;69:213–217. doi: 10.1038/sj.ki.5000054. [DOI] [PubMed] [Google Scholar]
- 24.Kagami S, et al. J Clin Invest. 1994;93:2431–2437. doi: 10.1172/JCI117251. [DOI] [PMC free article] [PubMed] [Google Scholar]
- 25.Chen S, Jim B, Ziyadeh FN. Semin Nephrol. 2003;23:532–543. doi: 10.1053/s0270-9295(03)00132-3. [DOI] [PubMed] [Google Scholar]
- 26.Ziyadeh FN. J Am Soc Nephrol. 2004;15:S55–S57. doi: 10.1097/01.asn.0000093460.24823.5b. [DOI] [PubMed] [Google Scholar]
- 27.Ardaillou R, et al. J Am Soc Nephrol. 1999;10:S40–S46. [PubMed] [Google Scholar]
- 28.Kim S, Iwao H. Pharmacol Rev. 2000;52:11–34. [PubMed] [Google Scholar]
- 29.Amiri F, et al. Kidney Int. 2002;61:1605–1616. doi: 10.1046/j.1523-1755.2002.00311.x. [DOI] [PubMed] [Google Scholar]
- 30.Wolf G. Kidney Int. 2006;70:1914–1919. doi: 10.1038/sj.ki.5001846. [DOI] [PubMed] [Google Scholar]
- 31.Rabkin R, Schaefer F. Growth Horm IGF Res. 2004;14:270–276. doi: 10.1016/j.ghir.2004.02.001. [DOI] [PubMed] [Google Scholar]
- 32.Han HJ, Kang CW, Park SH. Clin Exp Pharmacol Physiol. 2006;33:1172–1179. doi: 10.1111/j.1440-1681.2006.04495.x. [DOI] [PubMed] [Google Scholar]
- 33.Flyvbjerg A. Diabetologia. 2000;43:1205–1223. doi: 10.1007/s001250051515. [DOI] [PubMed] [Google Scholar]
- 34.Horney MJ, et al. Am J Physiol Renal Physiol. 1998;274:F1045–F1053. doi: 10.1152/ajprenal.1998.274.6.F1045. [DOI] [PubMed] [Google Scholar]
- 35.Song W, et al. Diabetes. 2000;49(suppl):A379. [Google Scholar]
- 36.Haylor J, et al. J Am Soc Nephrol. 2000;11:2027–2035. doi: 10.1681/ASN.V11112027. [DOI] [PubMed] [Google Scholar]
- 37.Jiang Y, et al. Mol Cell Biochem. 2005;278:165–175. doi: 10.1007/s11010-005-7327-z. [DOI] [PubMed] [Google Scholar]
- 38.Feld SM, et al. Kidney Int. 1995;48:45–51. doi: 10.1038/ki.1995.265. [DOI] [PubMed] [Google Scholar]
- 39.Schreiber BD, Hughes ML, Groggel GC. Clin Nephrol. 1995;43:368–374. [PubMed] [Google Scholar]
- 40.Gooch JL, et al. J Biol Chem. 2001;276:42492–42500. doi: 10.1074/jbc.M102994200. [DOI] [PubMed] [Google Scholar]
- 41.Kang BP, et al. Am J Physiol Renal Physiol. 2003;28:F1013–F1024. doi: 10.1152/ajprenal.00209.2003. [DOI] [PubMed] [Google Scholar]
- 42.Yang S, et al. Am J Physiol Renal Physiol. 2005;289:F1144–F1152. doi: 10.1152/ajprenal.00094.2005. [DOI] [PubMed] [Google Scholar]
- 43.Kelley KM, Nonoshita LDRG. Proceedings 77th Annual Meeting of the Endocrine Society. 1995. Rosenfeld; p. 170. [Google Scholar]
- 44.Park IS, et al. Am J Kidney Dis. 1998;32:1000–1010. doi: 10.1016/s0272-6386(98)70075-7. [DOI] [PubMed] [Google Scholar]
- 45.Cingel-Ristic V, et al. Exp Biol Med. 2005;230:135–143. doi: 10.1177/153537020523000208. [DOI] [PubMed] [Google Scholar]
- 46.Kelley KM, et al. J Endocrinol. 2002;175:3–18. doi: 10.1677/joe.0.1750003. [DOI] [PubMed] [Google Scholar]
- 47.Firth SM, Baxter RC. Endocrine Rev. 2002;23:824–854. doi: 10.1210/er.2001-0033. [DOI] [PubMed] [Google Scholar]
- 48.Grellier P, et al. Kidney Int. 1996;49:1071–1078. doi: 10.1038/ki.1996.156. [DOI] [PubMed] [Google Scholar]
- 49.Fornoni A, et al. Endocrinology. 2006;147:3547–3554. doi: 10.1210/en.2006-0066. [DOI] [PubMed] [Google Scholar]
- 50.Burnier M. Circulation. 2001;103:904–912. doi: 10.1161/01.cir.103.6.904. [DOI] [PubMed] [Google Scholar]
- 51.Andrade MC, et al. J Hypertens. 1998;16:2063–2074. doi: 10.1097/00004872-199816121-00031. [DOI] [PubMed] [Google Scholar]
- 52.Andrade AQ, et al. Braz J Med Biol Res. 2002;35:17–24. doi: 10.1590/s0100-879x2002000100003. [DOI] [PubMed] [Google Scholar]
- 53.Wolf G, Haberstroh U, Neilson EG. Am J Pathol. 1992;140:95–107. [PMC free article] [PubMed] [Google Scholar]
- 54.Rodgers BD, Bautista RM, Nicoll CS. Proc Soc Exp Biol Med. 1995;210:234–241. doi: 10.3181/00379727-210-43944. [DOI] [PubMed] [Google Scholar]
- 55.Akinci A, et al. Metabolism. 2000;49:626–633. doi: 10.1016/s0026-0495(00)80039-6. [DOI] [PubMed] [Google Scholar]
- 56.Slootweg MC, et al. Endocrinology. 1995;136:4210–4217. doi: 10.1210/endo.136.10.7545101. [DOI] [PubMed] [Google Scholar]
- 57.Hoeflich A, et al. FEBS Lett. 1998;434:329–334. doi: 10.1016/s0014-5793(98)01011-4. [DOI] [PubMed] [Google Scholar]
- 58.Wolf E, et al. Pediatr Nephrol. 2000;14:572–578. doi: 10.1007/s004670000362. [DOI] [PubMed] [Google Scholar]
- 59.Conover CA, Khosla S. Growth Horm IGF Res. 2003;13:328–335. doi: 10.1016/s1096-6374(03)00092-3. [DOI] [PubMed] [Google Scholar]
- 60.Blackburn A, et al. Eur J Endocrinol. 1997;137:701–708. doi: 10.1530/eje.0.1370701. [DOI] [PubMed] [Google Scholar]
- 61.Novosyadlyy R, et al. J Cell Physiol. 2004;199:388–398. doi: 10.1002/jcp.10437. [DOI] [PubMed] [Google Scholar]
- 62.MacKay K, et al. Kidney Int. 1988;33:677–684. doi: 10.1038/ki.1988.53. [DOI] [PubMed] [Google Scholar]
- 63.Kelley KM, et al. Am J Physiol. 1999;276:R1164–R1171. doi: 10.1152/ajpregu.1999.276.4.R1164. [DOI] [PubMed] [Google Scholar]


