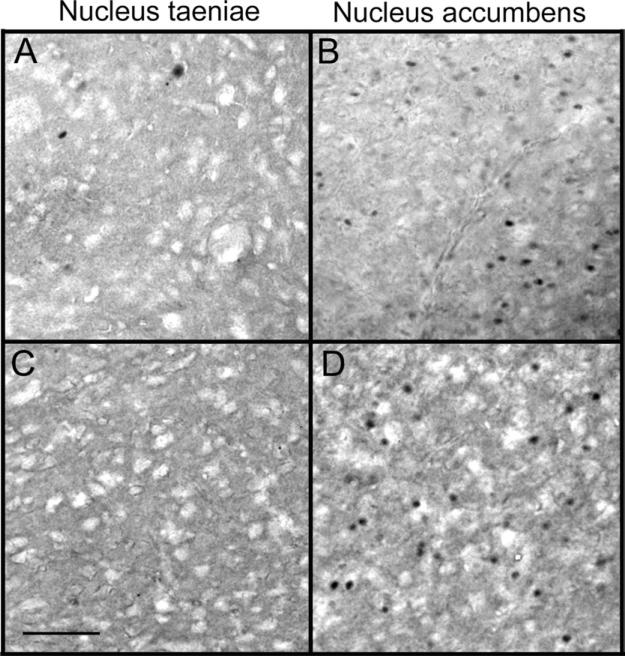
Fig. 4.
ZENK immunolabeling in the nucleus taeniae (A, C) in the nucleus accumbens (B, D) of females interacting with familiar males. The density of ZENK immunoreactivity was significantly higher in the nucleus accumbens than nucleus taeniae. Labeling within cells also appeared darker in the nucleus accumbens. ZENK immunoreactivity was more apparent in the caudal portion of nucleus taeniae (left side of photos), but was more homogenous in the nucleus accumbens. The top two panels (A, B) depict labeling from animals that displayed high levels of pairing behavior. The bottom two panels (C, D) depict labeling in animals that displayed low levels of pairing behaviors. Scale bar=50 μm.

