

Abstract
Current technologies for visualizing infectious pathways of viruses rely on fluorescent labeling of capsid proteins by chemical conjugation or genetic manipulation. For non-invasive in vivo imaging of such agents in mammalian tissue, we engineered bioluminescent Gaussia luciferase-tagged Adeno-Associated Viral (gLuc/AAV) vectors. The enzyme was incorporated into recombinant AAV serotype 1, 2, and 8 capsids by fusion to the N-terminus of the VP2 capsid subunit to yield bioluminescent virion shells. The gLuc/AAV vectors were utilized to quantify kinetics of cell surface binding by AAV2 capsids in vitro. Bioluminescent virion shells displayed an exponential decrease in luminescent signal following cellular uptake in vitro. A similar trend was observed following intramuscular injection in vivo, although the rate of decline in bioluminescent signal varied markedly between AAV serotypes. While gLuc/AAV1 and gLuc/AAV8 vectors displayed rapid decrease in bioluminescent signal to background levels within 30 min, the signal from gLuc/AAV2 vectors persisted for over 2 hrs. Bioluminescent virion shells might be particularly useful in quantifying dynamics of viral vector uptake in cells and peripheral tissues in live animals.
Adeno-Associated Viral (AAV) vectors have recently gained popularity in gene transfer applications due to the availability of a vector toolkit comprised of several serotypes and variants exhibiting diverse tissue tropisms (1). Tracking the in vivo biodistribution and tissue tropisms of AAV vectors is critical towards understanding their infectious pathways and establishing safety for human gene transfer applications. Fusion constructs of viral capsid subunits and fluorescent proteins, such as GFP, have had a tremendous impact as reagents for elucidating infectious pathways of viruses in vitro through confocal microscopy techniques (2,3). However, such fluorescence-based imaging techniques for tracking viral vectors in live animals might not be feasible in light of the low vector concentrations (doses range from 109-1012 particles; pico-femtomolar range), high background auto-fluorescence and resulting weak signal-to-background ratio in vivo (4,5). Radioisotope-based imaging techniques are perhaps ideally suited for such in vivo studies (6), although significant challenges pertaining to radiochemical labeling of viruses and subsequent access to radio-imaging technology remain to be addressed.
The current, most widely utilized modality for understanding viral vector tropism in vivo is to monitor expression levels/patterns of a luciferase reporter gene incorporated into the vector genome using live animal bioluminescence imaging (7). The latter approach, while somewhat informative of vector tissue tropisms, cannot be utilized to accurately predict dynamics of vector dissemination from or vector uptake at the site of administration. To address these issues, we have developed a simple strategy that involves a viral capsid-luciferase fusion protein, which when incorporated into the AAV capsid during production results in generation of bioluminescent AAV shells that can be monitored using live animal imaging.
The AAV capsid is comprised of three viral protein subunits, Vp1, Vp2 and Vp3 (8). While Vp1 and Vp3 are critical for forming infectious virions, Vp2 is thought to be redundant. Further, the N-terminus of Vp2 can tolerate fusion with large proteins such as GFP (~30kDa), thereby allowing incorporation and surface display of non-endogenous viral proteins on the AAV capsid (2). Using the latter strategy, we engineered Gaussia luciferase (gLuc; 19kDa), a highly sensitive luciferase (9,10), onto the N-terminus of the Vp2 protein derived from the AAV2 capsid sequence. Briefly, the gLuc transgene was amplified from the plasmid pGLuc (Nanolight, Pinetop, AZ) by PCR using primers (AGTACTATATA; GATATAGATAGAG) flanked by EagI and MluI sites and PCR product ligated into pVp2AGFP following restriction digestion to generate pVp2AgLuc. Bioluminescent gLuc/AAV1; gLuc/AAV2 and gLuc/AAV8 capsids packaging the GFP transgene driven by the CMV promoter were generated as per the schematic shown in Figure 1. The pXR-ACA and pVp2AGFP plasmids, in which the Vp2 start site has been mutated from ACG to ACA and ATG, respectively have been described previously (11,2). Vector genome-containing particles were purified by cesium chloride density ultracentrifugation, dialyzed against PBS and viral titers determined using dot blot as described earlier (12). Genomic titers of gLuc/AAV vectors displayed an inverse correlation to the ratio of pVp2AgLuc to pXR-ACA plasmids utilized in transfection, with ratios of 25:75 or lower yielding genomic titers comparable to that of recombinant AAV vectors (~1012 vector genome-containing particles/mL). These results are in agreement with those described by Warrington et al., (2004) for AAV capsids containing similar Vp2-GFP fusion proteins (2).
Figure 1.
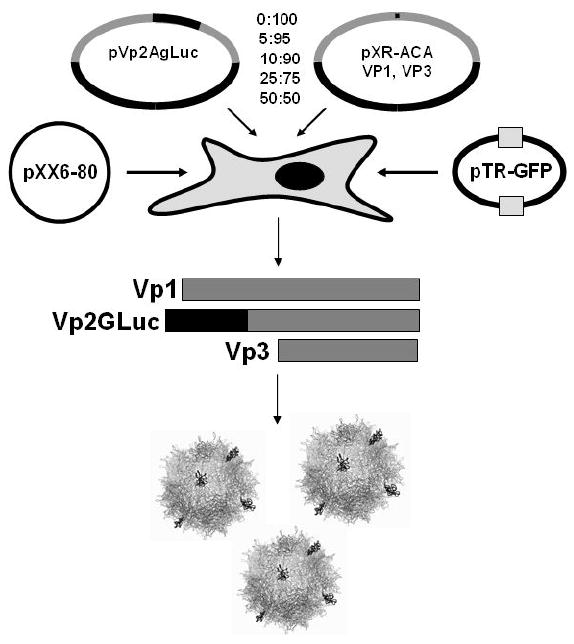
Schematic featuring transfection protocol for production of bioluminescent AAV capsids. Plasmids pVp2gLuc and pXR-ACA are transfected at indicated ratios (total 10μg/15cm plate) along with helper Ad genes (pXX6-80) and packaging construct (pTR-GFP) in HEK 293 cells as described previously (13). Bioluminescent virion shells are generated when the Vp2gLuc protein is incorporated into AAV capsids containing Vp1 and Vp3 proteins at endogenous levels.
Bioluminescence of (109) viral particles was determined using 50μL of coelenterazine substrate (CLZ, 40μg/mL) in 0.1M Tris buffer (pH 7.5) containing 0.6M NaCl with a Victor2® bioluminescence plate reader (Perkin Elmer). As shown in Figure 2, transfection of a 10:90 ratio of plasmids pVp2gLuc:pXR-ACA afforded gLuc/AAV2 capsids with a high bioluminescent signal (A) without adversely affecting transduction efficiency (B) or viral titer (data not shown). Transduction experiments were carried out with HEK293 cells using an MOI of 1000 and GFP transgene expression monitored 24hr post-transduction using fluorescence microscopy. Higher levels of incorporation of the gLuc-Vp2 fusion construct into AAV capsids (plasmid ratio 25:75 or higher) resulted in decreased viral titer or low transduction efficiency (data not shown). Based on these results, gLuc/AAV vectors utilized for all further analysis were generated using a pVp2AgLuc-to-pXRACA plasmid ratio of 10:90, previously established to minimally impact titer and transduction efficiency.
Figure 2.
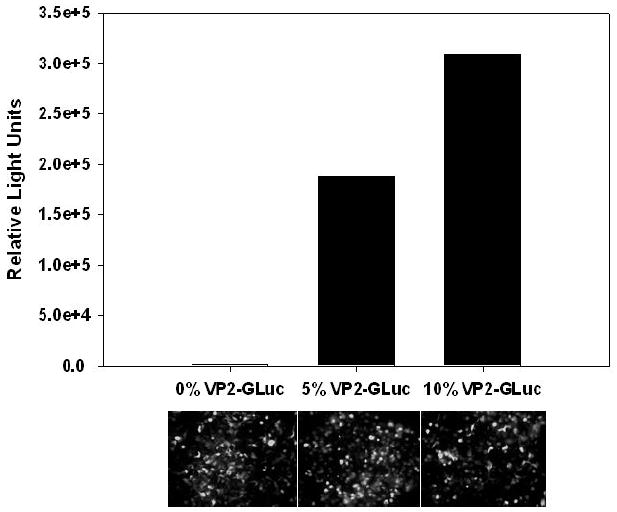
Functional characterization of gLuc/AAV capsids generated by transfecting 0:100; 5:95 or 10:90 ratio of plasmids pVp2gLuc and pXR2ACA. (A) Light emission from gLuc/AAV2 capsids was quantified using a Victor2® plate reader following incubation of viral fractions with coelenterazine (CLZ, 40μg/mL) substrate in 0.1M Tris buffer containing 0.6M NaCl. Average values from two different viral preparations is shown. (B) Representative fluorescence micrographs of GFP transgene expression in HEK293 cells obtained at 24hrs post-transduction with AAV2-GFP vectors (MOI 1000) containing different levels of Vp2gLuc.
The gLuc/AAV capsids were first evaluated as potential reagents for quantifying cell surface binding and uptake events. Briefly, HelaS3 cells maintained in suspension culture as per ATCC recommendations, were incubated at 4°C for different time intervals with (a) gLuc/AAV2 capsids and (b) gLuc/AAV2 capsids pre-incubated with heparin for 1hr on ice (30μg/mL, Sigma) at an MOI of 10000. For binding studies, 106 cells were spun down, the cell pellet washed thrice with cold 1×PBS and luminometric assays with CLZ substrate (40μg/mL) carried out as described earlier. As shown in Figure 3A, gLuc/AAV2 capsids display saturable binding to the surface of HelaS3 cells. Preincubation with heparin reduced the number of cell surface-bound viral particles by 4-5 fold, corroborating the use of heparan sulfate by gLuc/AAV2 as the primary receptor (13). The total number of cell surface-bound viral particles was determined to be ~700 per HelaS3 cell and peak binding levels achieved 2hrs post-incubation at 4°C.
Figure 3.
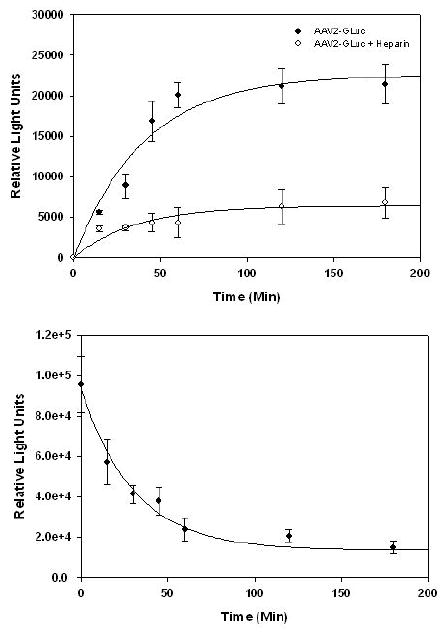
Cell surface binding and uptake assays with gLuc/AAV2 capsids. (A) HelaS3 cells were incubated with gLuc/AAV2 particles (filled dots) or gLuc/AAV2 particles pre-incubated with heparin (open dots) at an MOI 10,000 at 4°C in DMEM containing 10% FBS. Aliquots of 106 cells were removed at different time intervals and cell-associated bioluminescence quantified using CLZ substrate as described earlier. (B) HelaS3 cells pre-incubated with gLuc/AAV2 particles (MOI 10,000) for 2hrs at 4°C were pelleted, washed and incubated in DMEM-FBS at 37°C. Aliquots of 107 cells were removed at different time intervals, lysed and cell-associated bioluminescence quantified using CLZ substrate as described above. All experiments were performed in triplicate. Error bars represent standard deviations.
For cellular uptake studies, HelaS3 cells were incubated with gLuc/AAV2 capsids for 2hrs at 4°C, pelleted, washed three times with DMEM containing 10%FBS and incubated at 37°C to allow internalization. Cells (107) were removed at different time points, lysed using passive lysis buffer (Promega) and bioluminescence quantified using CLZ substrate as described earlier. As shown in Figure 3B, gLuc/AAV2 capsids display a rapid exponential decline in signal reaching near-background levels within 1hr. This rapid decline can potentially be explained by competitive inhibition of gLuc by coelenteramide, the oxidized form of coelenterazine (10) or inactivation of enzymatic activity of gLuc by proteolysis within endosomes. Further, it is likely that irreversible conformational changes in AAV capsid proteins during the course of entry might attribute to inactivation of luciferase activity. Similar decline in bioluminescent signal has been observed during cellular uptake of retroviral particles containing firefly luciferase fused to the C-terminal of the envelope protein (14). Taken together, the aforementioned results corroborate the use of bioluminescent AAV capsids as sensitive reporters of the kinetics of cell surface binding and uptake of AAV vectors.
Having established the utility of gLuc/AAV capsids in vitro, we focused our attention on live animal imaging studies. Different gLuc/AAV serotypes were administered through intravenous (tail vein) and intramuscular (gastrocnemius) routes in mice. In particular, we chose AAV1, which is known to transduce skeletal muscle with high efficiency (15); AAV2, being the most well-characterized AAV serotype with modest tropism for liver and muscle (16); and AAV8, which has been shown to transduce skeletal muscle as well liver with high efficiency (17).
For monitoring the dynamics of AAV vectors following intramuscular injection, CLZ (5mg/kg) dissolved in methanol/PBS was first injected into the tail vein of female Balb/C mice (4-6 weeks old) followed immediately by injection of gLuc/AAV capsids (dose 5×10¹⁰ particles) of serotypes 1, 2 or 8 into skeletal muscle in the left hind limb. Images were obtained at 5min, 10min, 30min, 1hr and 2hrs post-administration using the Xenogen IVIS 100® imaging system. As seen in Figures 4A-C, gLuc/AAV capsids are clearly detectable at the site of injection. Interestingly, gLuc/AAV8 capsids appear detectable in liver 5min post-administration (Figure 4C) supporting previous studies that AAV8 can traverse through the blood vessel wall and distribute to peripheral tissues (17). As shown in Figure 4D, the decrease in bioluminescent signal over time at the site of intramuscular injection corroborates results seen with in vitro studies in general. In particular, light output from gLuc/AAV2 vectors in skeletal muscle appears to decrease to background levels at a slower rate (> 2 hrs) in comparison with gLuc/AAV1 or gLuc/AAV8 vectors (30 min). Such differential kinetics might be explained by (a) a potentially faster rate of skeletal muscle cell uptake by AAV1/AAV8 in comparison with AAV2 and/or (b) differential rate of dissemination of AAV capsids from the site of administration. The latter explanation is particularly likely given the potential for AAV2 to adhere to heparan sulfate proteoglycans, abundantly expressed on the surface of fast and slow twitch muscle fibers (18). Such avid binding could in turn, attenuate dissemination of AAV2 capsids from the site of injection. Similar observations have been made with regard to dissemination of different AAV serotypes in the brain (19,20).
Figure 4.
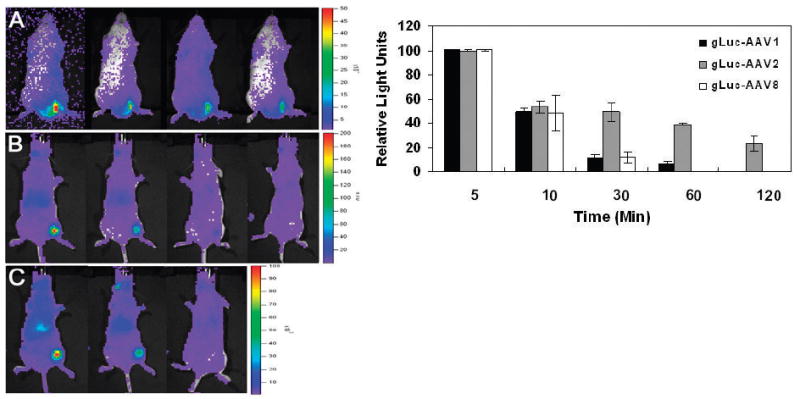
Quantitative live animal imaging of bioluminescent gLuc/AAV capsid dynamics in Balb/C mice following intramuscular administration. Representative bioluminescent images of mice obtained using a Xenogen IVIS 100® system at 5min, 10min, 30min and 1hr post-IM administration of 5×10¹⁰ of (A) gLuc/AAV2; (B) gLuc/AAV1 and (C) gLuc/AAV8 vectors. Mice received an intravenous (tail vein) dose of 5mg/kg CLZ in MeOH/PBS immediately before IM injection gLuc/AAV particles. Light emission pseudocolor scales (total photons/sec/cm2) are shown to left of each panel. (D) Quantitation of the kinetics of light emission from left hind limb region of each mouse after IM administration of different gLuc/AAV capsids. All experiments were performed in triplicate. Error bars represent standard deviations.
The tracking of intravenously administered gLuc/AAV capsids was precluded by lack of sensitivity possibly arising from low concentrations of bioluminescent AAV virions in various tissues and the resulting low signal-to-background ratios (data not shown). It is likely that such studies might be possible with larger doses of viral capsids (1012-1013/mouse), currently only attainable through large scale production.
In summary, Gaussia luciferase-labeled AAV capsids were successfully demonstrated as useful reagents for quantifying cell surface binding and uptake in vitro. More importantly, gLuc/AAV virion shells were detectable using live animal bioluminescence imaging in skeletal muscle. Using these reagents, we were able to demonstrate that AAV2 capsids might disseminate from the site of injection at a slower rate in comparison with AAV1 or AAV8. Alternatively, it is likely that the cellular uptake of AAV1/8 occurs at a rate faster than that of AAV2 capsids in skeletal muscle cells. Similar observations have been made with regard to the uptake and transcytosis of different AAV serotypes in epithelial cells (21). Studies focused on delineating the underlying mechanism(s) are currently in progress. The studies described herein also highlight the potential advantages of live animal tracking of viral vectors in comparison with methods that would require large numbers of animals and QPCR in obtaining pharmacokinetic/biodistribution data. It is noteworthy to mention that dual luciferase-based imaging studies can be carried out using gLuc/AAV capsids packaging a firefly luciferase (fLuc) cassette due to different substrate specificities of the two luciferase proteins. The relatively smaller MW and higher sensitivity of Gaussia luciferase (19kDa) in comparison to firefly luciferase (61kDa) offers a significant advantage for incorporation into capsid proteins of enveloped or non-enveloped viruses in general (14,22). Bioluminescent virion shells could serve as useful tools for understanding the biology of AAV vectors in peripheral organs, especially the eye and the brain.
Acknowledgments
We would like to thank Drs. Nick Muzyczka and Ken Warrington (University of Florida) for the plasmid pVp2AGFP. This work was supported by the NIH (P01HL051818, R01AI072176 and R21AR055712) and the American Heart Association.
References
- 1.Wu Z, Asokan A, Samulski RJ. Adeno-associated virus serotypes: vector toolkit for human gene therapy. Mol Ther. 2006;14:316–327. doi: 10.1016/j.ymthe.2006.05.009. [DOI] [PubMed] [Google Scholar]
- 2.Warrington KH, Jr, Gorbatyuk OS, Harrison JK, Opie SR, Zolotukhin S, Muzyczka N. Adeno-associated virus type 2 VP2 capsid protein is nonessential and can tolerate large peptide insertions at its N terminus. J Virol. 2004;78:6595–6609. doi: 10.1128/JVI.78.12.6595-6609.2004. [DOI] [PMC free article] [PubMed] [Google Scholar]
- 3.Lux K, Goerlitz N, Schlemminger S, Perabo L, Goldnau D, Endell J, Leike K, Kofler DM, Finke S, Hallek M, Buning H. Green fluorescent protein-tagged adeno-associated virus particles allow the study of cytosolic and nuclear trafficking. J Virol. 2005;79:11776–11787. doi: 10.1128/JVI.79.18.11776-11787.2005. [DOI] [PMC free article] [PubMed] [Google Scholar]
- 4.Swenson ES, Price JG, Brazelton T, Krause DS. Limitations of green fluorescent protein as a cell lineage marker. Stem Cells. 2007;25:2593–2600. doi: 10.1634/stemcells.2007-0241. [DOI] [PubMed] [Google Scholar]
- 5.Tam JM, Upadhyay R, Pittet MJ, Weissleder R, Mahmood U. Improved in vivo whole-animal detection limits of green fluorescent protein-expressing tumor lines by spectral fluorescence imaging. Mol Imaging. 2007;6:269–276. [PubMed] [Google Scholar]
- 6.Yaghoubi SS, Berger F, Gambhir SS. Studying the biodistribution of positron emission tomography reporter probes in mice. Nat Protoc. 2007;2:1752–1755. doi: 10.1038/nprot.2007.228. [DOI] [PubMed] [Google Scholar]
- 7.Piwnica-Worms D, Schuster DP, Garbow JR. Molecular imaging of host-pathogen interactions in intact small animals. Cell Microbiol. 2004;6:319–331. doi: 10.1111/j.1462-5822.2004.00379.x. [DOI] [PubMed] [Google Scholar]
- 8.Rose JA, Maizel JV, Jr, Inman JK, Shatkin AJ. Structural proteins of adenovirus-associated viruses. J Virol. 1971;8:766–770. doi: 10.1128/jvi.8.5.766-770.1971. [DOI] [PMC free article] [PubMed] [Google Scholar]
- 9.Verhaegent M, Christopoulos TK. Recombinant Gaussia luciferase. Overexpression, purification, and analytical application of a bioluminescent reporter for DNA hybridization. Anal Chem. 2002;74:4378–4385. doi: 10.1021/ac025742k. [DOI] [PubMed] [Google Scholar]
- 10.Tannous BA, Kim DE, Fernandez JL, Weissleder R, Breakefield XO. Codon-optimized Gaussia luciferase cDNA for mammalian gene expression in culture and in vivo. Mol Ther. 2005;11:435–443. doi: 10.1016/j.ymthe.2004.10.016. [DOI] [PubMed] [Google Scholar]
- 11.Grieger JC, Samulski RJ. Packaging capacity of adeno-associated virus serotypes: impact of larger genomes on infectivity and postentry steps. J Virol. 2005;79:9933–9944. doi: 10.1128/JVI.79.15.9933-9944.2005. [DOI] [PMC free article] [PubMed] [Google Scholar]
- 12.Grieger JC, Choi VW, Samulski RJ. Production and characterization of adeno-associated viral vectors. Nat Protoc. 2006;1:1412–1428. doi: 10.1038/nprot.2006.207. [DOI] [PubMed] [Google Scholar]
- 13.Summerford C, Samulski RJ. Membrane-associated heparan sulfate proteoglycan is a receptor for adeno-associated virus type 2 virions. J Virol. 1998;72:1438–1445. doi: 10.1128/jvi.72.2.1438-1445.1998. [DOI] [PMC free article] [PubMed] [Google Scholar]
- 14.Kolokoltsov AA, Davey RA. Rapid and sensitive detection of retrovirus entry by using a novel luciferase-based content-mixing assay. J Virol. 2004;78:5124–5132. doi: 10.1128/JVI.78.10.5124-5132.2004. [DOI] [PMC free article] [PubMed] [Google Scholar]
- 15.Hauck B, Xiao W. Characterization of tissue tropism determinants of adeno-associated virus type 1. J Virol. 2003;77:2768–2774. doi: 10.1128/JVI.77.4.2768-2774.2003. [DOI] [PMC free article] [PubMed] [Google Scholar]
- 16.Rabinowitz JE, Rolling F, Li C, Conrath H, Xiao W, Xiao X, Samulski RJ. Cross-packaging of a single adeno-associated virus (AAV) type 2 vector genome into multiple AAV serotypes enables transduction with broad specificity. J Virol. 2002;76:791–801. doi: 10.1128/JVI.76.2.791-801.2002. [DOI] [PMC free article] [PubMed] [Google Scholar]
- 17.Wang Z, Zhu T, Qiao C, Zhou L, Wang B, Zhang J, Chen C, Li J, Xiao X. Adeno-associated virus serotype 8 efficiently delivers genes to muscle and heart. Nat Biotechnol. 2005;23:321–328. doi: 10.1038/nbt1073. [DOI] [PubMed] [Google Scholar]
- 18.Pruchnic R, Cao B, Peterson ZQ, Xiao X, Li J, Samulski RJ, Epperly M, Huard J. The use of adeno-associated virus to circumvent the maturation-dependent viral transduction of muscle fibers. Hum Gene Ther. 2000;11:521–536. doi: 10.1089/10430340050015716. [DOI] [PubMed] [Google Scholar]
- 19.Burger C, Gorbatyuk OS, Velardo MJ, Peden CS, Williams P, Zolotukhin S, Reier PJ, Mandel RJ, Muzyczka N. Recombinant AAV viral vectors pseudotyped with viral capsids from serotypes 1, 2, and 5 display differential efficiency and cell tropism after delivery to different regions of the central nervous system. Mol Ther. 2004;10:302–317. doi: 10.1016/j.ymthe.2004.05.024. [DOI] [PubMed] [Google Scholar]
- 20.Taymans JM, Vandenberghe LH, Haute CV, Thiry I, Deroose CM, Mortelmans L, Wilson JM, Debyser Z, Baekelandt V. Comparative analysis of adeno-associated viral vector serotypes 1, 2, 5, 7, and 8 in mouse brain. Hum Gene Ther. 2007;18:195–206. doi: 10.1089/hum.2006.178. [DOI] [PubMed] [Google Scholar]
- 21.Di Pasquale G, Chiorini JA. AAV transcytosis through barrier epithelia and endothelium. Mol Ther. 2006;13:506–516. doi: 10.1016/j.ymthe.2005.11.007. [DOI] [PubMed] [Google Scholar]
- 22.Matthews QL, Sibley DA, Wu H, Li J, Stoff-Khalili MA, Waehler R, Mathis JM, Curiel DT. Genetic incorporation of a herpes simplex virus type 1 thymidine kinase and firefly luciferase fusion into the adenovirus protein IX for functional display on the virion. Mol Imaging. 2006;5:510–519. [PMC free article] [PubMed] [Google Scholar]