

Abstract
Cerebellar Purkinje cells (PCs) receive GABAergic input that undergoes powerful retrograde modulation by presynaptic cannabinoid and glutamate receptors. Here we examine a distinct modulatory mechanism at these synapses, which does not require postsynaptic depolarization and acts via presynaptic AMPA receptors. We find that this mechanism operates mainly in the somatic vicinity of PCs in which large boutons of basket cell axons form synapses on the PC soma. We use fast confocal microscopy and detailed kinetic modeling to estimate that, in these boutons, an action potential opens 100-200 Ca2+ channels, eliciting a brief 3-5 μm transient, followed by a longer-term, 15-30 nm rise of free Ca2+ (above the resting level of ∼100 nm). Brief activation of local AMPA receptors suppresses Ca2+ entry (probably by silencing 20-40 P/Q-type channels) in a subgroup of terminals that tend to show a higher dynamic range of Ca2+ signaling. The results provide the first quantitative description of presynaptic Ca2+ kinetics and its modulation by AMPA receptor activation (most likely via a glutamate spillover-mediated mechanism) at identified GABAergic synapses.
Keywords: presynaptic mechanisms, Ca2+ signaling, glutamate, spillover, AMPARs, cerebellum
Introduction
GABAergic transmission between interneurons and Purkinje cells (PCs) in the cerebellum undergoes several modes of presynaptic regulation triggered by postsynaptic excitation. On the timescale of seconds, GABA release can be moderated through the retrograde mechanism of depolarization-induced suppression of inhibition (DSI) (Llano et al., 1991; Pitler and Alger, 1992; Glitsch et al., 1996). DSI is initiated when a depolarized PC releases endogenous cannabinoids that activate presynaptic cannabinoid CB1 receptors (Kreitzer and Regehr, 2001; Ohno-Shosaku et al., 2001; Wilson and Nicoll, 2001; Diana et al., 2002). A similar mechanism, depolarization-induced suppression of excitation, acts at excitatory synapses (Kreitzer and Regehr, 2001; Ohno-Shosaku et al., 2002; Liang et al., 2004). The release-suppressing action of cannabinoids is controlled by the cyclooxygenase-2 cascade (Kim and Alger, 2004), and, in the cerebellum, DSI is followed by strong synaptic potentiation involving activation of presynaptic NMDA receptors (Duguid and Smart, 2004).
One common feature of these regulatory actions is their dependence on postsynaptic Ca2+ rises that normally follow cell depolarization. A distinct mechanism, however, mediates suppression of transmission at interneuron-PC synapses after activation of climbing fibers (CFs) that converge onto the same PC (Satake et al., 2000). This suppression does not depend on postsynaptic Ca2+, internal Ca2+ stores, or cannabinoid receptors but requires activation of presynaptic AMPA receptors (AMPARs) that appear to exert a metabotropic inhibitory action (Satake et al., 2000, 2004). It is not known, however, whether the underlying mechanism involves changes in rapid entry and/or the resting level of presynaptic Ca2+ and whether it is expressed evenly among interneuron-PC synapses. The latter is important because the synaptic input distribution over PC dendrites shapes the signal integration properties of the cell (Staub et al., 1994).
Addressing these issues requires experimental probing at the level of individual synapses. A previous report provided the first insights into the kinetics of Ca2+ signaling in individual axonal varicosities of cerebellar interneurons (Llano et al., 2000). However, synaptic terminals supplied by a single cell may express distinct mechanisms of presynaptic Ca2+ entry control (Dalezios et al., 2002; Rusakov et al., 2004), probably depending on the target cell (Poncer et al., 1997; Wilson et al., 2001; Reid et al., 2003; Somogyi et al., 2003; Kogo et al., 2004). Constraining this variability requires not only synaptic identification but also comparison of Ca2+ signals among individual presynaptic boutons (Rusakov et al., 2004).
Here we find that the CF-induced, AMPAR-dependent disinhibition occurs predominantly in the somatic vicinity of PCs, the site of basket cell-PC synapses. We then apply fast confocal microscopy to investigate presynaptic Ca2+ kinetics at individual presynaptic terminals from this group. We find that the action potential-driven presynaptic Ca2+ entry can be suppressed by a brief activation of presynaptic AMPARs, with no detectable changes in the resting Ca2+. This mechanism, which is likely to depend on escape of glutamate from CFs, acts at a subpopulation of terminals that tend to show higher dynamic ranges of presynaptic Ca2+ signals. The results highlight important principles of presynaptic modulation at individual GABAergic synapses.
Materials and Methods
Electrophysiology. We used 250 μm cerebellar slices from 2-week-old rat pups. The recording immersion chamber bath solution (artificial CSF) contained the following (in mm): 124 NaCl, 5 KCl, 2.4 CaCl2, 1.3 MgCl2, 26 NaHCO3, and 10 glucose (bubbled with 95% O2/5% CO2). Spontaneous IPSCs (sIPSCs) were recorded in whole-cell mode at -20 mV (patch pipette, 3-4 MΩ). Internal solution contained the following (in mm): 150 Cs methanesulfonate, 0.1 EGTA, 5 KCl, 10 HEPES, 3 MgATP2, and 0.4 GTP. Evoked EPSCs elicited by CF or parallel fiber (PF) stimulation were recorded at Vm of -60 mV. Stimulation electrodes (a patch pipette filled with bath solution) were placed using the identification criteria of CF- or PF-induced EPSCs (Satake et al., 2000, 2004), as depicted in Figure 1 A. Recording sweeps (3-10 s long) were collected at a 5 kHz rate in 30 s intervals using Clampex 7.0 (Axon Instruments, Union City, CA); sIPSCs were analyzed off-line using either AxoGraph (Axon Instruments) or SERF (by J. R. de Weille, Centre National de la Recherche Scientifique et Université de Nice, Nice, France). For pressure application, we used the bubbled medium to dilute the agonists and filled the pipettes immediately before recording. Drugs were purchased from Tocris Cookson (Ballwin, MO).
Figure 1.

Activation of CF, but not PF, synapses transiently suppresses GABA release at interneuron-PC synapses in the cerebellum. A, Stimulation protocol. Activating CFs and PFs with a train of 10 stimuli (10 Hz) induces distinct excitatory responses in a PC (traces, Vh of -60 mV, single-cell example) while showing a comparable integrated current. B, Activation of CFs, but not PFs, suppresses spontaneous events in PCs. Traces, Single-cell example (3 overlapped consecutive traces are shown; test window, shaded area; Vh of -20 mV). Plots, Summary data. CF stimulation decreases the sIPSC rate (74 ± 5% of baseline; p < 0.001; n = 19), whereas PF activation has no effect (105 ± 9% of baseline; n = 7). *** p < 0.005. Error bars indicate SEM.
The rate of sIPSCs was calculated as the product of the average amplitude and frequency of individual events over the test window. In pressure-pulse experiments, however, the 200 ms test window (duration was chosen to restrict effects to the local actions of the agonist) in some trials could contain incomplete or no events, thus exacerbating the measurement error. To avoid excessive measurement bias in these experiments, we calculated the sIPSC rate as the total charge carried by all, complete or incomplete, events (above the holding current baseline) per time unit over the test window. In each trial, this value was compared with the baseline spontaneous EPSC rate: the current charge per time unit over the 4 s interval preceding the pressure pulse. Each trial (5 s sweep) then received a score of ω = 1 for post-pulse facilitation and ω = -1 for depression of sIPSCs; each experimental epoch corresponded to a fixed position of the pressure pipette and included 20-50 trials. Experiments in individual cells included two to four pipette positions. In each position, therefore, the average score 〈ω〉 over all recorded sweeps represented a real number between -1 and 1. The value of 〈ω〉 provided therefore an unbiased ranked (ordinal) statistical measure, which had a uniform scale across the experiments and was insensitive to the magnitude of random sweep-to-sweep or within-sweep fluctuations in the sIPSC rate. The global mean 〈〈ω〉〉 and its error within an experimental sample (a fixed pipette position, two to four positions per cell) thus indicated whether the post-pulse depression (〈〈ω〉〉 < 0) or facilitation (〈〈ω〉〉 > 0) of sIPSCs was statistically significant in this sample. Comparing 〈〈ω〉〉 among groups was performed using a routine t test.
Two-photon imaging of pressure ejection. A patch pipette filled with bath medium and 50 μm added Alexa Fluor 594 was positioned near the PC soma, as in electrophysiological experiments (see Results). Square pressure pulses (100 ms, 10 psi) were generated with a Master 8 generator linked to a World Precision Instruments (Sarasota, FL) PicoPump V820 rapid pressure-pulse pump. Fluorescence was excited in two-photon mode (at 810 nm; emission collected using 700SP filter), and line-scan images (500 Hz, 6 s duration) of the ejection flux were recorded using a Bio-Rad Radiance 2100 confocal imaging system coupled with a SpectraPhysics MaiTai femtosecond pulse laser (Institute of Neurology, University College London), as detailed previously (Rusakov and Fine, 2003). The ambient pressure was adjusted to eliminate escape of the indicator before the pressure pulse.
Confocal Ca2+ imaging. We used a Zeiss (Oberkochen, Germany) LSM 510 laser scanning confocal imaging system coupled with a single-cell electrophysiological setup. Interneurons (basket cells) were identified using infrared differential interference contrast (DIC) and filled, in whole-cell mode (pipette resistance, 3-4 MΩ), with the following (in mm): 150 K methanesulfonate, 5 KCl, 10 HEPES, 3 MgATP2, 0.4 GTP, and 0.2 of the Ca2+ indicator Oregon Green BAPTA 1 (OGB-1) or 0.2 Fluo-4. The indicators were excited at 488 nm, and fluorescence was recoded using an LP510 emission filter. Basket cell axons were easily identified as a network of thin processes populated with large boutons adjacent to PC somata (see Fig. 2), in accordance with criteria detailed previously (Rusakov and Fine, 2003; Rusakov et al., 2004; Saitow et al., 2005). When the baseline fluorescence in the axon of interest showed no detectable increase (normally 20-25 min after break-in), we focused the system on one or two axonal boutons adherent to the PC soma (the latter being identified both in a DIC image and by the excluded fluorescence profile boundary). We then applied a short (5 or 10 ms) command voltage pulse to induce an action escape current. The evoked Ca2+-dependent fluorescence transients were recorded in line-scan mode (500-700 Hz; sweep duration of 300-600 ms; intersweep interval of 30 s or 1 min). The fluorescence response ΔF/F was calculated as (Fpost - Fpre)/(Fpre - F0), where Fpost and Fpre denote the line-scan fluorescence integrated over the visible bouton width 100 ms after and 100 ms before spike, respectively, and F0 is the background fluorescence measured outside any cell structures filled with the indicator.
Figure 2.

Probing the environment for local application of AMPAR agonists in the PC vicinity. A, Serial-section electron microscopy routinely identifies presynaptic boutons of GABAergic basket cell synapses (BC, blue shading) and excitatory CF synapses (yellow shading) co-occurring in the apex region of the pear-shaped PC soma as well as in dendrites (for details and serial-section micrographs, see supplemental Fig. S3, available at www.jneurosci.org as supplemental material). No parallel fiber synapses could be found on the PC soma, whereas the dendrites (apart from the very proximal segment) normally host CF, PF, and basket cell synapses (Palay and Chan-Palay, 1974; Ichikawa et al., 2002). B, Camera lucida drawings of a basket cell (green-yellow), a Purkinje cell (gray), and a CF (red) obtained using rapid Golgi preparation (modified from Palay and Chan-Palay, 1974). C, Imaging the pipette ejection flux with Alexa Fluor 594 (50 μm, two-photon excitation at 810 nm; pressure pulse, 10 psi × 100 ms). Top, Frame scan (duration, 1 s); dark round area (excluded fluorescence) depicts a PC soma profile. ML, Molecular layer. Pipette position is indicated by dashed lines; dashed arrows indicate line-scan position. Bottom, Line scan (500 Hz, 6 s duration) showing the space-time profile of fluorescence. D, The time course of fluorescence at different distances from the pipette tip; 10 pixel average recorded from line scan in C.
It has been reported recently that the soluble Ca2+ buffer calbindin-28k can be washed out from the dentate granule cell body in whole-cell mode with a time constant (time point of the 2.7-fold concentration drop) of ∼10 min (Muller et al., 2005). Because in our study the axonal boutons of interest were up to 100-200 μm away from the cell body and because the axon diameter was an order of magnitude smaller than the somatic diameter, the washout timescale of soluble buffers in our case was most likely to extend into hours. Furthermore, the most likely candidate for an endogenous Ca2+ buffer in cerebellar basket cells is parvalbumin (see below), which is not thought to be a soluble/mobile buffer. We therefore considered that our imaging experiments (which normally lasted 30-50 min) would not alter substantially the amount of endogenous Ca2+ buffering in remote axonal boutons. To control for this further, we monitored the ΔF/F signal amplitude throughout the experiment and discarded the data if its value showed a monotonic change of >30%. We also accounted for possible partial washout of the endogenous buffer in our calculations (see below).
The pressure-pulse pipette was positioned in the 15-20 μm vicinity of the recorded boutons, and the ambient pressure was adjusted to eliminate any residual escape of agonists (monitored by the deflections in the cell holding current). The pulse was applied 100 ms before the action potential onset (in some experiments with pressure application of glutamate, three action currents 20 ms apart were induced). To control for possible mechanical and other artifacts of pressure application, test sweeps (pressure pulse and action potential) were interleaved with control sweeps (action potential only) and “quiet-control” sweeps (pressure pulse only), as detailed in Results. The presynaptic Ca2+ kinetics was analyzed using an explicit, nonstationary modeling approach, as detailed in Appendix. The main adjustable parameters of the model were constrained by the experimental data as follows.
Constraining the parameters of Ca2+ entry. The resting concentration of internal Ca2+, [Ca2+]rest, can be estimated from a simple relationship (Tsien, 1989; Maravall et al., 2000):
 |
where Kd is the dissociation constant of the buffer/indicator, F is the resting level fluorescence, Fmax is the maximum fluorescence (saturated indicator), and Fmin is the residual fluorescence of free indicator. The above expression is often recast using experimental values of R-1 = Fmax/Fmin and Fmax/F. In the case of OGB-1, R-1 = 5-8 (Maravall et al., 2000; Sabatini et al., 2002), although lower values have been reported for cultured cells (Thomas et al., 2000; Rozsa et al., 2004); we therefore adopted R-1 = 6. Fluo-4 has a much higher dynamic range in vitro, whereas, in the cytoplasm, its R-1 value appears to be in the region of 10 (Thomas et al., 2000); the latter estimate was adopted here. The recorded intracellular fluorescence would therefore be proportional to [CaFI] + R[F]tot (see Appendix), with the second term representing the residual fluorescence of free indicator.
We then estimated the ratio Fmax/F by applying a long train of action potentials (100 at 50 Hz), which saturated the presynaptic fluorescence response (Jackson and Redman, 2003). Because this protocol resulted in a plateau of fluorescence with no reliably discernible peaks, we did not correct Fmax/F for possible small underestimation (Maravall et al., 2000). Instead, we cross-validated our estimate by testing whether the predicted Ca2+ kinetics (including estimated [Ca2+]rest) reproduces satisfactorily the fluorescence time course during both single and repetitive action potentials. The resulting best-fit kinetic curves reached the plateaus, which were only 5-9% below the theoretical saturation level (see Fig. 4).
Figure 4.
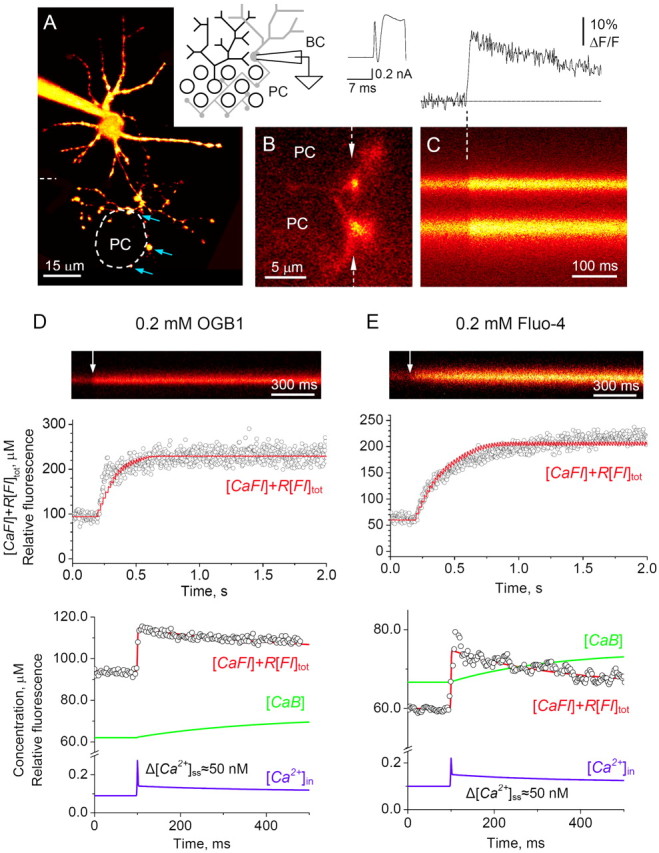
Action potential-dependent presynaptic Ca2+ signaling at individual basket cell-PC synapses. A, A low-resolution fluorescence image of a basket cell (BC; 0.2 mm Oregon Green BAPTA 1; 20 optical sections merged; depth, ∼30 μm; λx = 488 nm); thicker dendrites spread in the molecular layer, whereas thin axon branches spread toward PC bodies (one profile is indicated by a dashed line); arrows, axonal varicosities adjacent to the PC soma; inset, diagram of the experiment. B, A high-resolution fluorescence image of two distinct basket cell axonal boutons adjacent to round PC somata (single optical section raw image, no filtering applied; false colors); arrows, line scan positioning; trace, a 10 ms depolarizing pulse induces action potential (escape action current) in a basket cell held in voltage-clamp mode (Vh of -60 mV). C, Characteristic Ca2+ fluorescence in basket cell axonal boutons; line-scan image of two varicosities shown in B (1.5 ms per line, average of 10 scans); action potential onset shown by a dashed line; top panel, digitized line-scan trace. D, Ca2+ kinetics inside individual presynaptic boutons assessed using OGB-1 fluorescence. Line-scan image, A single bouton example; fluorescence time course in response to a 50 Hz train of action potentials. Top graph, Open circles, Average fluorescence kinetics recorded in n = 5 cells (ordinate, arbitrary units of relative fluorescence); solid red line, model-predicted fluorescence (proportional to [CaFI] plus the residual fluorescence factor R[FI]tot; ordinate, as a micromolar concentration; for details, see Materials and Methods). Bottom graph, Open circles, Average fluorescence transient in response to a single action potential (recorded average amplitude ΔF/F = 23 ± 2%; n = 45; ordinate, arbitrary units of relative fluorescence). Solid lines, Best-fit concentration kinetics for both experiments. Blue, [Ca2+]in; green, concentration of Ca2+-bound parvalbumin, [CaB] (ordinate, as a micromolar concentration). E, Presynaptic Ca2+ kinetics assessed using Fluo-4 fluorescence. Notations are the same as in D; ΔF/F = 25 ± 10% (n = 8). Together, the data predict [Ca2+]rest ≈ 100 μm, an increment of total Ca2+ per action potential Δ[Ca2+]tot = 16 ± 1.7 μm (bound and free combined, not shown in the plots), with free ion concentration [Ca2+]in peaking briefly at 220-270 nm and descending to a quasi steady-state post-spike increment of Δ[Ca2+]ss = 50 nm (for details, see Results and Materials and Methods).
Equations A3-A6 given in the Appendix, combined with a separate steady-state estimation of [Ca2+]rest, thus provided a basis for the explicit finite-difference model of Ca2+ kinetics. The purpose of modeling was to “translate” the recorded fluorescence F, determined by the corrected Ca2+-bound indicator concentration, [CaFI] + R[F]tot, into the underlying kinetics of free Ca2+ concentration, [Ca2+]in, inside the bouton. Given the known endogenous buffer (parvalbumin) and the exogenous indicator (OGB-1 or Fluo-4), the model operated with three adjustable (free) parameters: total Ca2+ influx (Δ[Ca2+]tot), total buffer concentration ([B]tot), and the Ca2+ removal rate P. These three parameters were constrained by four sets of experimental conditions: two Ca2+ indicators were used in conditions of either (1) a single spike or (2) repetitive action potentials that saturate the indicator (see Fig. 4). In addition, within the expected physiological range, varying either Δ[Ca2+]tot or [B]tot separately produced virtually independent effects on the predicted amplitude and decay of the fluorescent response, respectively (see supplemental Figs. S1, S2, available at www.jneurosci.org as supplemental material). The value of Δ[Ca2+]tot, therefore, could be constrained by a straightforward one-parameter fitting procedure in which the average amplitude of the ΔF/F fluorescence response was compared with the model outcome. The decay kinetics of ΔF/F could then be explained by the corresponding value of [B]tot and/or by the Ca2+ removal rate P. An additional constraint came from a previous estimate of [B]tot (600 μm) obtained using basket cell-PC pair recordings (Caillard et al., 2000). This value, however, appeared higher than the upper limit [B]tot (200 μm) that would explain the ΔF/F decay observed here (the fluorescence decay would have to be faster at [B]tot = 600 μm). This apparent discrepancy was not unexpected because a proportion of the endogenous buffer might have been washed out (Blatow et al., 2003) (but see Helmchen et al., 1996). We therefore adopted the upper limit [B]tot of 200 μm in our experiments. [When this study was in the final stage of preparation, an independent estimate of [B]tot = 150 μm was reported for cerebellar interneurons (Collin et al., 2005).] In n = 4 experimental settings (see above and also Fig. 4 D, E), the adopted [B]tot = 200 μm corresponded to the Ca2+ removal rate P = 73 ± 16 s-1. This was in agreement with the range estimated previously (Majewska et al., 2000), including parvalbumin-containing cells (Lee et al., 2000) (for additional survey, see Matveev et al., 2004). For additional details, see Results.
Electron microscopy. Tissue was prepared for serial electron microscopy as detailed previously (Lehre and Danbolt, 1998). Briefly, 7- to 8-week-old male Wistar rats (Mllegaard Hansen, Denmark) were perfusion fixed with 2.5% glutaraldehyde and 1% paraformaldehyde in buffer. Serial sections (80 nm thick) of Durcupan-embedded cerebellum (vermis, lobulus 6) were photographed with a digital camera in a Phillips CM10 electron microscope. Identification of synaptic terminals (near the apical part of the PC body) was performed using short series (4-7) of serial sections, in accordance with the accepted morphological criteria: GABAergic terminals were equipped with symmetric, axosomatic synapses featuring numerous active zones and elongated synaptic vesicles; characteristic large terminals of climbing fibers showed clearly asymmetric, axospine synapses with round vesicles and a prominent postsynaptic density (see Fig. 2 A) (supplemental Fig. S3, available at www.jneurosci.org as supplemental material).
Results
AMPAR-dependent suppression of GABA release does not require postsynaptic excitation and involves mainly axosomatic synapses
Depolarizing the PC can trigger release of retrograde messengers, such as cannabinoids and probably glutamate receptor agonists, providing a powerful mechanism for presynaptic modulation of GABA release (Kreitzer and Regehr, 2001; Ohno-Shosaku et al., 2001; Wilson and Nicoll, 2001; Diana et al., 2002; Duguid and Smart, 2004). However, activation of CFs that exert excitatory responses in a PC transiently suppresses IPSCs in the same cell held in voltage-clamp mode (Satake et al., 2000, 2004). Although this argues against a significant role of postsynaptic depolarization per se in suppressing GABA release, it does not rule out postsynaptic actions initiated by receptor activation: for instance, activation of metabotropic glutamate receptors (mGluRs) in PCs could generate a diffuse retrograde signal that inhibits GABA release in the adjacent synapses (Maejima et al., 2001). In addition, AMPARs could trigger metabotropic activation of tyrosine kinase Lyn, whereby relaying the receptor signal to the nucleus (Hayashi et al., 1999).
To probe such influences, we first asked whether the effect of CF stimulation can be reproduced by activating PFs, which represent a different excitatory synaptic input to the PC. Stimulation of PFs exerts strong activation of AMPARs and, in a glutamate uptake-dependent manner, of mGluRs (Brasnjo and Otis, 2001); in addition, glutamate released from PFs appears to activate AMPARs in relatively distant stellate cells (Carter and Regehr, 2000) that form axodendritic synapses on PCs in the molecular layer. Synaptic discharges triggered by CF and PF stimulation evoke distinct responses in the same PC: the CF-induced EPSCs are larger, evoked in an almost all-or-none manner, and show use-dependent depression, whereas PF stimulation exerts smaller EPSCs that decay slowly and show substantial use-dependent facilitation (Vh of -60 mV) (Fig. 1A). To match the postsynaptic effects of PF and CF stimulation, we therefore used a protocol (10 stimuli at 20 Hz, strength adjusted) that would generate approximately the same total charge transfer in either pathway (Fig. 1A, areas under current).
We then compared the sIPSC rates before and shortly after the EPSC train (Vh of -20 mV) (Fig. 1B). In agreement with the previous observations, CF stimulation reduced the sIPSC input (to 73 ± 5% of baseline; p < 0.001; n = 19); the effect was abolished by the AMPAR antagonist 1,2,3,4-tetrahydro-6-nitro-2,3-dioxo-benzo[f]quinoxaline-7-sulfonamide (95 ± 3% of baseline; data not shown). In contrast, stimulating PFs had no effect on the sIPSCs rate (105 ± 9% of baseline; n = 7) (Fig. 1B). This suggested that (1) the postsynaptic inward current alone was insufficient to inhibit sIPCSs, and (2) glutamate released by PFs did not reach AMPARs, which are involved in the CF-induced suppression of GABA release. The only PC compartment that hosts both GABAergic and CF, but not PF, synapses is the soma or the most proximal dendritic domain (Palay and Chan-Palay, 1974; Ichikawa et al., 2002). Our data therefore suggested that the CF-mediated disinhibition could act predominantly (albeit not necessarily exclusively) at numerous synapses formed by the basket cell axons on the PC soma (Fig. 2A, B) (supplemental Fig. S3, available at www.jneurosci.org as supplemental material).
According to this hypothesis, CF stimulation should reduce the proportion of detected somatic events. Because miniature IPSCs generated at the PC soma show faster rise times compared with dendritic events (Llano et al., 2000), we attempted to test whether CF stimulation affects this parameter. The results show that stimulation of CFs increases the average 10-90% sIPSC rise time by 98 ± 3 μs (n = 17; p < 0.005) (sample windows as in Fig. 1B) (for details, see supplemental Fig. S4, available at www.jneurosci.org as supplemental material). This was consistent with the predominant suppression of axosomatic synapses in the CF-dependent disinhibition.
To test this further, we asked whether local application of AMPA near the PC soma could reproduce the CF-induced inhibition of IPSCs. We therefore set out to use a pressure pulse of AMPA delivered via a patch pipette in the somatic vicinity of the recorded PC. First, we evaluated the spatial extent of pressure ejection by adding a cell-impermeable fluorescence indicator (50 μm Alexa Fluor 594) to the pipette solution and visualizing it with fast two-photon microscopy (Fig. 2C). Because two-photon excitation occurs exclusively within a thin (∼1 μm) optical layer, the emitted fluorescence translates directly into the profile of relative extracellular concentrations (Rusakov and Fine, 2003). These experiments indicated that a brief pressure pulse (100 ms at 10 psi) would generate a concentration transient dissipating 10- to 20-fold at 25-35 μm from the pipette tip (Fig. 2D). Because glutamate or AMPA molecules are lighter, and therefore diffuse away faster, than Alexa (molecular weight, 759 kDa), the concentration drop would be even steeper for the AMPAR agonists. Given that the PC dendrites spread over >200 μm (Fig. 2B), the spatial “resolution” of the pressure pulse was therefore sufficient to allow separate activation of AMPARs that occur in the somatic, as opposed to purely dendritic, region of PCs. In both cases, however, the pressure pulse was to reach GABAergic basket cell axons (Fig. 2A,B).
We thus recorded sIPSCs from a PC in whole-cell mode (Vm of -20 mV) and applied AMPA pulses at different loci in the neuropil with respect to the PC soma (Fig. 3A,B). Because the agonist wave is likely to spread across the molecular layer 200-300 ms after pulse (Fig. 2D), we restricted the detection window to 200 ms. The results (Fig. 3C) indicated that the AMPA pulse suppressed sIPSCs only when applied within ∼20 μm of the soma. In a substantial proportion of such experiments, this suppression occurred without any preceding or co-occurring postsynaptic inward current (Fig. 3A,B, top traces). The effect vanished when AMPA was applied at ∼30 μm from the soma and turned into facilitatory at greater distances, whether the pipette was in the molecular or in the PC layer (Fig. 3C).
Figure 3.

AMPAR-mediated inhibition of GABA release occurs in the vicinity of the Purkinje cell soma. A, Inset, A pressurized pipette (1-3 μm AMPA in bath solution) is placed near the PC soma and then moved away, either into the molecular layer (probe 1) or within the PC layer (probe 2). Traces, Single-cell example of probe 1 experiment (traces in 16 consecutive trials overlapped); dashed area, AMPA application time window; shaded area, post-pulse test window. BC, Basket cell. B, Single-cell examples of probe 2 experiment (traces in 16 consecutive trials overlapped). Other notations are as in A. Distance from the PC soma is indicated. C, Statistical summary. Average sIPSC score 〈〈ω〉〉 (± SEM; for details, see Materials and Methods) is shown; filled circle, probe 1 (n = 10); open circles, probe 2 (n = 9); half-filled circle, near-soma data combined (probes 1 and 2; n = 30). *p < 0.05; **p < 0.01; ***p < 0.005.
Together, these results suggest that the AMPAR-dependent suppression of sIPSCs (1) occurs predominantly in the somatic vicinity of PCS (see Discussion), (2) does not require activation of mGluRs or generation of postsynaptic excitatory receptor currents and (3) cannot be explained by the network effects of AMPAR activation.
Presynaptic Ca2+ signaling at individual basket cell-Purkinje cell synapses
Because evoked GABA release depends on the action potential-driven intracellular Ca2+ transient, we investigated the kinetics of presynaptic Ca2+ at individual axosomatic basket cell-PC synapses. We filled basket cells with a fluorescent Ca2+ indicator (OGB-1 and, in some experiments, Fluo-4; whole-cell mode) (Fig. 4A) and focused the system on an individual axonal varicosity adjacent to a PC body (Fig. 4B) (for details and discussion of buffer washout, see Materials and Methods). A brief command voltage step elicited an action current (Fig. 4B, trace) triggering a characteristic Ca2+-dependent fluorescence signal (Fig. 4C). When a long train of action potentials (100 spikes at 50 Hz) was initiated, Ca2+-dependent fluorescence gradually saturated (Fig. 4D,E, circles in top panels). The maximum-to-resting fluorescence ratio in these conditions allowed an estimate of the average resting Ca2+ level [Ca2+]rest inside the terminals (Maravall et al., 2000; Sabatini et al., 2002) (see equation in Materials and Methods). The OGB-1 and Fluo-4 experiments thus predicted [Ca2+]rest ≈95 nm (Fmax/F = 2.36 ± 0.73; n = 5) and [Ca2+]rest ≈105 nm (Fmax/F = 3.39 ± 0.69; n = 6), respectively, suggesting the expected [Ca2+]rest in the region of 100 nm. This was in good correspondence with the estimated [Ca2+]rest = 80 nm in hippocampal interneurons (Rozsa et al., 2004) and somewhat higher than the recent estimate of 40 nm obtained in cerebellar interneurons using a quasi steady-state analysis (Collin et al., 2005).
In response to a single spike, the average ΔF/F amplitude was 23 ± 2% in OGB-1-filled cells (n = 45) (Fig. 4D, circles in bottom panel) and 25 ± 10% in Fluo-4-filled cells (n = 8) (Fig. 4E, circles in bottom panel). The time course of Ca2+-dependent fluorescence was thus analyzed in four different experimental settings: with either OGB-1 or Fluo-4, during either single or repetitive (saturating series) action potentials. These observations were used to constrain the three unknown parameters of Ca2+ kinetics: total Ca2+ entry Δ[Ca2+]tot, concentration of endogenous buffer [B]tot, and the Ca2+ removal rate P [for simulation details, see Materials and Methods, Appendix, and supplemental Figs. S1, S2 (available at www.jneurosci.org as supplemental material)]. Once these parameters have been constrained, the best-fit data representing n = 4 experimental settings predicted that a single action potential corresponds to a 16.0 ± 1.7 μm increment of total Ca2+ in the terminal. This value is consistent with the 10-20 μm increment in axonal varicosities of hippocampal interneurons (Rusakov et al., 2004) and in good correspondence with a very recent estimate of 11 μm for cerebellar interneurons (Collin et al., 2005). In the presence of exogenous Ca2+ buffers (OGB-1 or Fluo-4), this implied a brief 70-100 nm transient of free Ca2+, followed by a longer-term elevation of residual free Ca2+ by Δ[Ca2+]ss = 50 nm (Fig. 4D, E).
Electron microscopy (Fig. 2D) (supplemental Fig. S3, available at www.jneurosci.org as supplemental material) and high-resolution fluorescence imaging (Fig. 4B) suggest that the size of the axonal boutons under study was in the range of 2-5 μm3. A 16 μm step in total Ca2+ then implies an influx of 2-3 × 10⁴ Ca2+ ions per terminal. Assuming that, during an action potential, a single Ca2+ channel carries, on average, a charge of Q = 0.2 pA × 0.2 ms = 4 × 10-17 coulomb, or Q/2e = 125 Ca2+ ions (Koester and Sakmann, 2000), this corresponds to the opening of 100-200 Ca2+ channels per bouton. This value is similar to the estimated 80-250 open channels driving 1-3 × 10⁴ ions inside axonal boutons of hippocampal interneurons [Rusakov et al., 2004 (note the typographical errors in the cited work)] but appears greater than Ca2+ entry in smaller axonal boutons of neocortical neurons (Koester and Sakmann, 2000). Given that the surface area of axonal boutons in the present study is 5-10 μm2, the corresponding Ca2+ channel density is comparable with the density (17-45 μm-2) estimated in the en passant axonal varicosities of hippocampal granule cells (Jackson and Redman, 2003).
Presynaptic AMPARs inhibit Ca2+ entry in a proportion of axonal boutons
To probe local AMPARs, we placed the pressure pipette (filled with bath solution containing 1-3 μm AMPA or 1 mm glutamate) (Fig. 3) within the 10-20 μm of the imaged axonal varicosity (Fig. 5A,B) located in the vicinity of the PC soma. We then compared, in alternating sweeps, a ΔF/F response to a single induced action current, with and without a conditioning pressure pulse of AMPA or glutamate (10 psi, 50-100 ms) applied 60-100 ms before the action current onset (Fig. 5C). To monitor any baseline fluorescence changes attributable to pressure application, we also collected, in alternating sweeps, the fluorescence signal ΔF/F in response to the pressure pulse alone (no action current).
Figure 5.

Activation of local AMPARs transiently inhibits action potential-dependent presynaptic Ca2+ entry at a proportion of basket cell-PC synapses. A, B, Experimental arrangement. Superimposition of OGB-1 fluorescence [in white; λx = 488 nm; merged stack depicting a basket cell (BC)] and an infrared DIC image showing positions of the pressure-pulse pipette tip (pp) and imaged axonal varicosities (white frame in A; enlarged confocal fluorescence image in B) approaching a PC soma (profile shown by dashed line). C, Characteristic line scans (OGB-1 fluorescence; scanning rate, 666 Hz; average of 10 sweeps) recorded in the same axonal varicosity during the escape action current (AC) generation (left panel), with an AMPA pressure pulse (gray segment marked P) applied shortly before the action current onset (center), and with a pressure pulse alone (right). D, Statistical summary. Average amplitude of action current-driven Ca2+ signals in individual basket cell axonal boutons after a pressure pulse of glutamate (pipette, 1 mm in bath medium) is decreased relative to baseline ΔF/F (Test; 86 ± 5% of baseline ΔF/F; p < 0.01; n = 27); Ctrl, glutamate pulse alone does not produce any detectable ΔF/F (average ΔF/F, -0.8 ± 1.2%). Histogram, Distribution of ΔF/F normalized to the baseline signal in the recorded sample; Ca2+ signal in a ∼50% subgroup of basket cell axonal boutons appears insensitive to glutamate application (shaded area). **p < 0.01. E, Bars, The average amplitude of action current-driven Ca2+ signals after a pressure pulse of AMPA (1-3 μm in bath medium) is decreased (Test; 85 ± 2% of baseline; p < 0.001; n = 43); Ctrl, response to the AMPA pulse alone (average ΔF/F, -0.2 ± 0.2%). Histogram, Notations are the same as in D. ***p < 0.005. F, Axonal boutons that exhibit greater Ca2+ influx (higher dynamic range) are more sensitive to AMPAR activation. Graph, The effect of AMPA pulse on the ΔF/F (ordinate) shows a positive correlation with the size of the baseline ΔF/F amplitude (abscissa; r = +0.41; p < 0.01; n = 43; shaded area indicates boutons insensitive to AMPA application; linear regression line y = 0.04 + 0.48 x is shown; p < 0.006). Histogram, Distribution of the baseline ΔF/F amplitude.
On average, the pressure pulse of glutamate reduced ΔF/F to 86 ± 5% of baseline ΔF/F (p < 0.01; n = 27) with no effect on the residual (resting) fluorescence in the alternating sweeps (average ΔF/F = 0.8 ± 1.2%) (Fig. 5D, top panel). However, the inhibitory effect of glutamate was not homogenous among axonal boutons: two distinct groups of terminals, one sensitive and one insensitive to glutamate application, could be identified in the distribution histogram (Fig. 5D, bottom panel). Application of AMPA produced a qualitatively similar result: the average ΔF/F signal was suppressed to 85 ± 2% of baseline (p < 0.001; n = 43), with no detectable effect of the pressure pulse alone (average ΔF/F = -0.2 ± 0.2%) (Fig. 5E, top panel). Frequency distribution of the inhibitory effect of AMPA on the spike-evoked Ca2+ signal among the boutons also revealed two distinguishable groups of boutons (Fig. 5E, bottom panel).
It is unlikely that this dichotomy simply reflects a proportion of nonfunctional synapses: the long-standing view from electron microscopy is that the overwhelming majority of GABAergic axonal varicosities adjacent to the PC soma are populated with synaptic active zones and accumulations of synaptic vesicles (Hamori and Szentagothai, 1965; Halasz and Csillik, 1969). That in some experiments application of AMPA could simply fail to activate AMPARs on the recorded cell is also unlikely because the AMPA pressure application settings were adjusted so that either alteration in the sIPSC rate in a PC (Fig. 2) or a detectable inward current in the basket cell (supplemental Fig. S5, available at www.jneurosci.org as supplemental material) was observed after the pulse.
Because the size of Ca2+-dependent ΔF/F signal varied between terminals, we investigated the relationship between the inhibitory action of AMPARs and this signal. When we plotted the AMPA-dependent reduction in ΔF/F against the baseline ΔF/F in individual boutons, the data revealed significant positive correlation (r = +0.41; n = 43; p < 0.01) (Fig. 5F, circles, linear regression is shown by dotted line, p < 0.006). The frequency distribution of the baseline ΔF/F signals (Fig. 5F, histogram) suggested that this correlation might reflect two or more distinct groups of terminals with respect to the size of Ca2+ entry. Although precise mechanisms that would explain the observed relationship require a separate study, this observation implies that the AMPAR-dependent modulatory mechanism of Ca2+ entry tends to act at axonal boutons with a higher dynamic range of evoked Ca2+ signaling.
These experiments determined that a transient, local activation of presynaptic AMPARs could suppress action potential-evoked Ca2+ entry in basket cell terminals. Furthermore, that the application of glutamate and AMPA produced quantitatively similar effects suggested that non-AMPA glutamate receptor subtypes were not required for the suppression mechanism to function. To address this further, we repeated the experiments in the presence of the selective AMPAR antagonist 1-(4-aminophenyl)-3-methylcarbamyl-4-methyl-3,4-dihydro-7,8-(methylenedioxy)-5H-2,3-benzodiazepine (GYKI 53655) (3 μm) and found that the inhibitory action of AMPA was abolished by the antagonist (average ΔF/F post-puff, 105 ± 8% of baseline ΔF/F; n = 15) (Fig. 6A,B). At the same time, application of 10 μm GYKI 53655 did not affect the inhibitory action of the group II/III mGluR agonist DCG-IV [(2S,2′R,3′R)-2-(2′,3′-dicarboxycyclopropyl)glycine] on evoked IPSCs (S. Satake, unpublished observation). These results indicated no significant role of presynaptic kainate receptors on evoked GABA release, also suggesting distinct pathways for AMPAR and mGluR actions.
Figure 6.

AMPAR-dependent reduction of presynaptic Ca2+ entry at GABAergic terminals does not require kainate, GABAB, or metabotropic glutamate receptors. A, Line-scan images (333 Hz sampling rate) and digitized traces (bottom panel) of OGB-1 fluorescence (λx = 488 nm) at two basket cell axonal boutons adjacent to a PC; slices are incubated in 3 μm GYKI 53655 (GYKI); single-cell example. Dashed arrow, Action potential (escape action current) onset; gray segment marked P, AMPA pressure pulse. B, Statistical summary of experiments in A. GYKI 53655 abolishes the inhibitory action of AMPA pressure pulse (average ΔF/F post-puff, 105 ± 8% of baseline ΔF/F; n = 15); pressure pulse alone produces no significant ΔF/F response (Ctrl; average ΔF/F, -6.5 ± 11%; n = 15). C, Slices are incubated in 1 μm CGP 55845 (CGP) and 1 mm (S)-MCPG (MCPG); single-synapse example; other notations are the same as in A. D, Statistical summary of experiments in C. CGP 55845 and (S)-MCPG do not affect the inhibitory action of AMPA pressure pulse (average ΔF/F post-puff, 82 ± 6% of baseline ΔF/F; n = 19; p < 0.01; this compares with the 85 ± 2% baseline ΔF/F without the antagonists; see Fig. 4); pressure pulse alone produces no significant ΔF/F response (Ctrl; average ΔF/F, 5.2 ± 4.7%; n = 19). **p < 0.01.
This was consistent with the pharmacological profile of the CF-induced/AMPA-dependent disinhibition: the phenomenon does not appear to involve metabotropic receptors while partly engaging the Gi/o signaling pathways (Satake et al., 2004). To test whether similar conclusions apply to the AMPA-dependent control of presynaptic Ca2+ signaling, we repeated the experiments in the presence of a specific GABAB receptor antagonist (2S)-3-[[(1S)-1-(3,4-dichlorophenyl) ethyl]amino-2-hydroxypropyl](phenyl-methyl)phosphinic acid (CGP 55845) (1 μm) and a nonspecific antagonist of mGluRs (S)-α-methyl-4-carboxyphenyl-glycin [(S)-MCPG] (1 mm). The two drugs had no detectable effect on the inhibitory action of AMPA (average ΔF/F post-puff, 82 ± 6% of baseline ΔF/F; n = 19; p < 0.01) (Fig. 6C,D). This provides additional evidence for the specific role of AMPARs in inhibiting Ca2+ entry at basket cell-Purkinje cell synapses.
Discussion
We found that stimulation of CFs, but not PFs, transiently suppresses GABAergic input to the same PC (Fig. 1). Local application of AMPA near the PC soma, but not away from it, could reproduce this distinction (Fig. 3), suggesting that the disinhibition mechanism acts predominantly, albeit not exclusively, at axosomatic synapses. Because suppression of sIPSCs could occur with no detectable postsynaptic currents (Fig. 3A,B), and because any contribution of postsynaptic Ca2+ rises or intracellular Ca2+ stores have been ruled out previously (Satake et al., 2004), the data point at a device that differs from the powerful retrograde messenger machinery acting in this circuitry.
We find that the underlying mechanism involves presynaptic AMPARs that suppress Ca2+ entry in the basket cell terminals adjacent to the PC soma (Figs. 5, 6). This phenomenon is observed in 50-60% of the recorded terminals (Fig. 5D,E), suggesting that a distinct synaptic subpopulation is sensitive to AMPA. Intriguingly, the effect appears more prominent in the terminals, showing a higher dynamic range of Ca2+ signaling (Fig. 5F). This relationship is conceivable because it would boost the ability of intracellular Ca2+ sensors to distinguish between baseline and inhibited Ca2+ signals.
Kinetics of presynaptic Ca2+ at basket cell-PC synapses
Analyses of Ca2+ kinetics (Fig. 4D,E) predict that a single action potential drives a rapid ∼16 μm increment of total presynaptic Ca2+. Although ryanodine-sensitive Ca2+ stores appear to contribute to large minis in this circuitry (Llano et al., 2000) and could be detected in individual boutons (Emptage et al., 2001), ryanodine affects neither action potential-dependent IPSCs in PCs (Llano et al., 2000) (but see Galante and Marty, 2003) nor their AMPAR-mediated suppression (Satake et al., 2004). This suggests the predominant role of Ca2+ entry in controlling evoked GABA release at these synapses.
The exogenous fluorescent indicators are unlikely to affect Ca2+ entry, but they do alter the kinetics of free presynaptic Ca2+. Based on the experimental observations, the present model could predict Ca2+ kinetics with no exogenous indicators/buffers present. A previous estimate of the endogenous buffer (parvalbumin) concentration based on pair-recording data were 600 μm (Caillard et al., 2000), whereas the present data suggest the upper limit of 200 μm (Fig. 3), which is in agreement with the recent estimate of 150 μm (Collin et al., 2005). Because the lower values of [B]tot might in principle reflect partial washout of endogenous buffers in whole-cell recordings (Blatow et al., 2003), we calculated Ca2+ kinetics for both upper and lower estimates of [B]tot (Fig. 7A). The results suggest that free presynaptic Ca2+ shows a brief increase of up to 2-6 μm, rapidly dropping to a quasi steady-state increment of 11-34 nm. As expected, these values are smaller than 50 nm estimated in the presence of a Ca2+ indicator (Fig. 4): slow release of indicator-bound Ca2+ contributes to free Ca2+. With or without indicators, free Ca2+ returns to its basal level on the scale of seconds. In the case of repetitive spikes, transients of free Ca2+ facilitate supralinearly, reflecting partial saturation of the buffer (Fig. 7B). [The assumption that the total Ca2+ influx Δ[Ca2+]tot per spike does not change significantly (Koester and Sakmann, 2000) is consistent with the observed Ca2+ kinetics during long trains of spikes (Fig. 4D,E); a separate investigation would be required to ascertain subtle use-dependent changes in Δ[Ca2+]tot.]
Figure 7.

Estimated kinetics of Ca2+ in basket cell axonal boutons in the absence of fluorescent indicators (A, B) and in the conditions of parvalbumin knock-out (C). A, Simulated kinetics of free internal Ca2+ ([Ca2+]in) in response to two action potentials 30 ms apart. Total endogenous buffer ([B]tot) is set at 200 or 600 μm, representing the present imaging data (Fig. 4) and the electrophysiological estimates obtained previously (Caillard et al., 2000), respectively; Δ[Ca]tot = 16 μm, action potential-driven Ca2+ increment, as estimated in the present data (Fig. 4); the corresponding quasi steady-state post-spike increments in internal Ca2+, Δ[Ca2+]ss, are shown. Ordinate axis notations apply to A-C. B, Simulated kinetics of [Ca2+]in in response to a train of 20 action potentials at 30 ms intervals. Notations are the same as in A. Significant (initially supralinear) facilitation attributable to buffer saturation is evident. C, Simulated kinetics of free internal Ca2+ in the conditions of parvalbumin (endogenous buffer) knock-out (Caillard et al., 2000). The lack of buffering, combined with relatively slow Ca2+ extrusion, explains the paradoxical higher paired-pulse ratio in knock-out animals compared with wild type (compare with A). Solid line, A single-spike Ca2+ transient; dashed lines, Ca2+ transient in response to the second spike generated at 30, 70, or 100 ms (Caillard et al., 2000).
Finally, the present data could explain the previous observation that the paired-pulse facilitation at basket cell-PC synapses was greater in the parvalbumin knock-out mice compared with wild-type (Caillard et al., 2000). Simulations indicate that the absence of buffering should boost temporal summation of Ca2+ transients (Fig. 7C). As a result, a test spike ∼100 ms after conditioning should elevate [Ca2+]in to a significantly higher level than does the first. A similar conclusion has been drawn in a recent study (Collin et al., 2005).
Molecular mechanisms of AMPAR-mediated suppression of GABA release
It was shown previously that the AMPAR-dependent disinhibition involves the G-protein-mediated suppression of P/Q-type Ca2+ channels (Satake et al., 2004). This was consistent with the predominant role of P/Q-type channels in mediating GABA release at cerebellar interneurons (Forti et al., 2000). It is therefore most likely that the AMPAR-dependent suppression of Ca2+ entry observed here involves P/Q-type channels. [A more direct test that would relate channel types to the receptor action in individual varicosities (Rusakov et al., 2004) was complicated because of the expected prevalence of a single channel type.] G-protein-dependent inhibition appears to make P/Q-type channels electrically silent rather than reducing their Ca2+ conductance (Colecraft et al., 2001). The present results (Fig. 5) suggest therefore that activation of AMPARs could silence ∼20%, or 20-40, such channels in an individual synaptic bouton.
Assuming the classical fourth-power relationship between Ca2+ concentration and release probability (Dodge and Rahamimoff, 1967), the observed 15-20% decrease of Ca2+ entry should correspond to a 50-60% reduction in the GABA IPSC rate. This appears to somewhat overestimate the effect of CF stimulation (Fig. 1B). The most parsimonious explanation for this overestimation is that dendritic sIPSCs were not affected by the disinhibition mechanism. In the case of pressure application (Fig. 3C), the extent of disinhibition could be underestimated because the applied agonist, which is not removed by glutamate transporters, is likely to spread across the molecular layer 200-300 ms after pulse (Fig. 2C,D). The ensuing increase in the interneuron firing rate would mask any local suppression of sIPSCs.
The finding that presynaptic AMPARs, although suppressing Ca2+ entry, have no effect on the resting Ca2+ (Fig. 5C) suggests that they (1) do not exert an ionotropic action sufficient to activate Ca2+ channels (Lee et al., 2002) and (2) are likely to have low Ca2+ permeability. The latter could be interpreted as the prevalence of the GluR2 subunit-containing AMPARs. Although this receptor subtype is thought to be common in PCs (Tempia et al., 1996), it remains to be seen whether AMPARs could be identified in basket cell axons.
Does the axon identity determine the presynaptic sensitivity to AMPA?
Because the AMPA-dependent suppression varied among axonal terminals (Fig. 5D,E), the question arises whether the underlying mechanism is expressed in a synaptic target-specific manner (Dalezios et al., 2002; Somogyi et al., 2003; Kogo et al., 2004) or whether it is determined by the presynaptic axon. To distinguish between these two sources of heterogeneity, we compared the variability in the AMPA-dependent reduction of ΔF/F among boutons supplied by the same axon (n = 53 “neighbor pairs”) with that in pairs of boutons picked randomly from the entire sample (shuffled control with repetitive sampling; n* = 318 “random pairs”) (Rusakov et al., 2004). The results suggest that the neighbor pairs tend to show smaller differences, and hence greater similarities, compared with the random pairs (p < 0.025; Kolmogorov-Smirnov test). However, the discrepancy was small (an 18 vs 22% difference in neighbor versus random pairs, respectively) and could in principle be influenced by the more uniform recording conditions in neighbor pairs. A separate study would be therefore required to determine the interplay between target cell-specific and axon-specific modes of release control in these synapses.
Escape of glutamate released from climbing fibers?
The present findings, together with the previous reports (Satake et al., 2000, 2004), identify a CF-dependent, presynaptic AMPAR action at GABAergic basket cell-PC synapses. The simplest explanation for the initiating mechanism is that glutamate released by CF axons reaches AMPARs in basket cell axons. Although CFs appear to fire at a relatively low rate in vivo (∼1 Hz), it seemed reasonable to use higher stimulation rates in an acute slice experiment to achieve comparable effects: a substantial proportion of the fibers/synapses are not expected to function because of slice cutting and deterioration. Serial electron microscopy confirms previous suggestions that, in the somatic vicinity, the terminals involved could occur in the relative proximity of one another (Fig. 2A,B). However, one argument against the spillover hypothesis is that CF synapses are surrounded by Bergmann glia (Fig. 2A) (supplemental Fig. S3, available at www.jneurosci.org as supplemental material), which is enriched in glutamate transporters (Lehre and Danbolt, 1998) and can slow down glutamate escape (Barbour et al., 1994). Experiments in acute slices (Diamond and Jahr, 2000; Chen and Diamond, 2002) and detailed computer models of glutamate diffusion (Franks et al., 2002; Lehre and Rusakov, 2002) also argue against significant actions of single-vesicle glutamate releases beyond such transporter pools. However, important experimental evidence has emerged recently suggesting that ectopic, as opposed to synaptic, release of glutamate from CF axons could be responsible for activation of AMPARs in Bergmann glia (Matsui and Jahr, 2003, 2004). Glutamate escape from CFs has also been found to underlie activation of presynaptic NMDA receptors in cerebellar interneurons (Huang and Bordey, 2004). These observations lend strong support to the hypothesis that glutamate spillover between CFs and GABAergic axons is a plausible mechanism of AMPA receptor-dependent suppression of GABA release at the inhibitory synapses on Purkinje cells.
Appendix
Analysis of nonstationary Ca2+ kinetics
Because of the resolution limits of a confocal laser scanning microscope (microsecond-millisecond range) and because of the relatively rapid diffusion of free Ca2+, ΔF/F signals recorded in small axonal boutons normally represent fluorescence that is integrated across the bouton. In such cases, a single-compartment model of Ca2+ entry and buffering is thought to be an adequate biophysical tool for interpreting such signals (Tank et al., 1995; Neher, 1998; Jackson and Redman, 2003). This model considers volume-average concentrations of free and bound Ca2+ within the terminal; multicompartment analyses appear more appropriate when the axonal volume of interest is substantially larger than the resolution limits of optical recordings (DiGregorio et al., 1999; Zucker and Regehr, 2002; Meinrenken et al., 2003; Trommershauser et al., 2003).
Common high-affinity endogenous buffers and/or fluorescent Ca2+ indicators have a relatively high on-rate constant (103-107 m-1 ms-1). This implies that a singular rapid fluctuation in Ca2+ concentration inside the terminal is followed by rapid equilibration resulting in a slow, quasi steady-state “drift” of the component concentrations. In these conditions, the kinetic equations predict a simple relationship for each ith buffer Bi:
 |
(A1) |
where Kid is the dissociation constant of the buffer/indicator. In many cases, the first partial derivative of Expression A1 with respect to [Ca2+] gives a useful parameter κ, an estimate of the “newly-bound versus free Ca2+ ratio” (Neher and Augustine, 1992; Helmchen et al., 1997; Maravall et al., 2000). However, the system is far from steady state during the brief period of fast Ca2+ entry. To assess the rapid time course of Ca2+ kinetics components during this period, we therefore considered Ca2+ influx and buffering on the submillisecond time scale using an explicit kinetic model (Rusakov et al., 2004). This approach should account for very rapid concentration changes of multiple diffusion-reaction components, with no steady-state approximation required. Here, our model considers Ca2+ binding to the fluorescent indicator FI and the endogenous buffer B, in accordance with the reactions:
 |
(A2) |
where the Ca2+-indicator complex CaB determines the recorded fluorescence.
The prevailing, if not exclusive, endogenous buffer in cerebellar basket cells is known to be a slow, relatively high-affinity parvalbumin (Kosaka et al., 1993; Caillard et al., 2000; Collin et al., 2005), with the rate constants k2 ≈ 5 × 10³ m-1 ms-1 and k-2 ≈ 10-3 ms. Whereas the bulk of experiments were performed using OGB-1 (Kd ≈ 0.2 μm; k1 ≈ 5 × 10⁵ m-1 ms-1; k-1 ≈ 0.1 ms-1), we also used a second fluorescent indicator, Fluo-4 (Kd ≈ 0.4 μm; k1 ≈ 5 × 10⁵ m-1 ms-1; k-1 ≈ 0.2 ms-1), to further constrain the assessment of Ca2+ kinetics (see below).
Reactions A2 imply that Ca2+ kinetics follows a simple linear equation:
 |
(A3a) |
where brackets denote concentrations, ICa is the Ca2+ influx rate, Iloss is the Ca2+ removal rate attributable to pumping out, diffusion, and/or sequestration, and the mass conservation rules are as follows:
 |
 |
(A3b) |
 |
Whereas an action potential waveform is commonly approximated with an α-function, it appears that the Ca2+ influx kinetics ICa(t) (Meinrenken et al., 2003) is satisfactorily represented by a Gaussian:
 |
(A4) |
where Δ[Ca2+]tot (in molar units, equal to integral of G over -∞ < t <+∞) reflects total Ca2+ influx, and t0 is the peak current onset, and σ = 0.7 ms is set so that the effective pulse width (full-width at half-maximum, ≈2.4σ) matches the average duration of the action potential at half-maximum (∼1.5 ms, seen in current clamp). Ca2+ influx current during successive spikes occurring at time points t1, t2,..., tn could thus be represented by the following sum:
 |
(A5) |
where Ai is a factor that could incorporate use-dependent, spike-to-spike changes in Ca2+ entry (e.g., use-dependent potentiation or depression).
Removal of Ca2+ from an intracellular compartment (e.g., an axonal bouton or a dendritic spine) is a complex process involving diffusion, pumping out, and/or sequestration by internal stores. Because this process is relatively slow (rates 0.1-1.0 ms-1) and because its components tend to vary between and within cells (Holthoff et al., 2002), the useful approximation is a first-order reaction (Zador and Koch, 1994; Majewska et al., 2000) (for additional discussion, see Matveev et al., 2004), with the Ca2+ loss proportional to the concentration difference/gradient:
 |
(A6) |
where P is the average removal rate, and [Ca2+]rest is the Ca2+ resting level inside the bouton. This approximation was adopted in the present study.
Footnotes
This work was supported by the following: Core Research for Evolutional Science and Technology, Japan Science and Technology Council; the Ministry of Education, Culture, Sports, Science, and Technology of Japan Grant-in-Aid 16300127; the Wellcome Trust and Medical Research Council (United Kingdom); European Commission Grants DECG CLG-CT-2001-02004 and IP FP6 PROMEMORIA 512012; and The Research Council of Norway and the European Union (BIOMED QLG3-CT-2001-02004). We are grateful to Dimitri Kullmann for valuable comments and Itone Nishizaki for technical assistance.
Correspondence should be addressed to either of the following: D. A. Rusakov, Institute of Neurology, University College London, Queen Square, London WC1N 3BG, UK, E-mail: d.rusakov@ion.ucl.ac.uk; or S. Konishi, Waseda-Olympus Bioscience Research Institute, Singapore 138667, E-mail: skonishi@waseda.jp.
Copyright © 2005 Society for Neuroscience 0270-6474/05/254930-11$15.00/0
D.A.R. and F.S. contributed equally to this work.
References
- Barbour B, Keller BU, Llano I, Marty A (1994) Prolonged presence of glutamate during excitatory synaptic transmission to cerebellar Purkinje cells. Neuron 12: 1331-1343. [DOI] [PubMed] [Google Scholar]
- Blatow M, Caputi A, Burnashev N, Monyer H, Rozov A (2003) Ca2+ buffer saturation underlies paired pulse facilitation in calbindin-D28k-containing terminals. Neuron 38: 79-88. [DOI] [PubMed] [Google Scholar]
- Brasnjo G, Otis TS (2001) Neuronal glutamate transporters control activation of postsynaptic metabotropic glutamate receptors and influence cerebellar long-term depression. Neuron 31: 607-616. [DOI] [PubMed] [Google Scholar]
- Caillard O, Moreno H, Schwaller B, Llano I, Celio MR, Marty A (2000) Role of the calcium-binding protein parvalbumin in short-term synaptic plasticity. Proc Natl Acad Sci USA 97: 13372-13377. [DOI] [PMC free article] [PubMed] [Google Scholar]
- Carter AG, Regehr WG (2000) Prolonged synaptic currents and glutamate spillover at the parallel fiber to stellate cell synapse. J Neurosci 20: 4423-4434. [DOI] [PMC free article] [PubMed] [Google Scholar]
- Chen S, Diamond JS (2002) Synaptically released glutamate activates extrasynaptic NMDA receptors on cells in the ganglion cell layer of rat retina. J Neurosci 22: 2165-2173. [DOI] [PMC free article] [PubMed] [Google Scholar]
- Colecraft HM, Brody DL, Yue DT (2001) G-protein inhibition of N- and P/Q-type calcium channels: distinctive elementary mechanisms and their functional impact. J Neurosci 21: 1137-1147. [DOI] [PMC free article] [PubMed] [Google Scholar]
- Collin T, Chat M, Lucas MG, Moreno H, Racay P, Schwaller B, Marty A, Llano I (2005) Developmental changes in parvalbumin regulate presynaptic Ca2+ signaling. J Neurosci 25: 96-107. [DOI] [PMC free article] [PubMed] [Google Scholar]
- Dalezios Y, Lujan R, Shigemoto R, Roberts JDB, Somogyi P (2002) Enrichment of mGluR7a in the presynaptic active zones of GABAergic and non-GABAergic terminals on interneurons in the rat somatosensory cortex. Cereb Cortex 12: 961-974. [DOI] [PubMed] [Google Scholar]
- Diamond JS, Jahr CE (2000) Synaptically released glutamate does not overwhelm transporters on hippocampal astrocytes during high-frequency stimulation. J Neurophysiol 83: 2835-2843. [DOI] [PubMed] [Google Scholar]
- Diana MA, Levenes C, Mackie K, Marty A (2002) Short-term retrograde inhibition of GABAergic synaptic currents in rat Purkinje cells is mediated by endogenous cannabinoids. J Neurosci 22: 200-208. [DOI] [PMC free article] [PubMed] [Google Scholar]
- DiGregorio DA, Peskoff A, Vergara JL (1999) Measurement of action potential-induced presynaptic calcium domains at a cultured neuromuscular junction. J Neurosci 19: 7846-7859. [DOI] [PMC free article] [PubMed] [Google Scholar]
- Dodge FA, Rahamimoff R (1967) Co-operative action of calcium ions in transmitter release at the neuromuscular junction. J Physiol (Lond) 193: 419-432. [DOI] [PMC free article] [PubMed] [Google Scholar]
- Duguid IC, Smart TG (2004) Retrograde activation of presynaptic NMDA receptors enhances GABA release at cerebellar interneuron-Purkinje cell synapses. Nat Neurosci 7: 525-533. [DOI] [PubMed] [Google Scholar]
- Emptage NJ, Reid CA, Fine A (2001) Calcium stores in hippocampal synaptic boutons mediate short-term plasticity, store-operated Ca2+ entry, and spontaneous transmitter release. Neuron 29: 197-208. [DOI] [PubMed] [Google Scholar]
- Forti L, Pouzat C, Llano I (2000) Action potential-evoked Ca2+ signals and calcium channels in axons of developing rat cerebellar interneurones. J Physiol (Lond) 527: 33-48. [DOI] [PMC free article] [PubMed] [Google Scholar]
- Franks KM, Bartol TM, Sejnowski TJ (2002) A Monte Carlo model reveals independent signaling at central glutamatergic synapses. Biophys J 83: 2333-2348. [DOI] [PMC free article] [PubMed] [Google Scholar]
- Galante M, Marty A (2003) Presynaptic ryanodine-sensitive calcium stores contribute to evoked neurotransmitter release at the basket cell-Purkinje cell synapse. J Neurosci 23: 11229-11234. [DOI] [PMC free article] [PubMed] [Google Scholar]
- Glitsch M, Llano I, Marty A (1996) Glutamate as a candidate retrograde messenger at interneurone-Purkinje cell synapses of rat cerebellum. J Physiol (Lond) 497: 531-537. [DOI] [PMC free article] [PubMed] [Google Scholar]
- Halasz N, Csillik B (1969) Experimental electron microscopic studies on excitatory and inhibitory synapses in the cerebellar cortex of the rat. Exp Brain Res 9: 73-82. [DOI] [PubMed] [Google Scholar]
- Hamori J, Szentagothai J (1965) The Purkinje cell baskets: ultrastructure of an inhibitory synapse. Acta Biol 15: 465-479. [PubMed] [Google Scholar]
- Hayashi T, Umemori H, Mishina M, Yamamoto T (1999) The AMPA receptor interacts with and signals through the protein tyrosine kinase Lyn. Nature 397: 72-76. [DOI] [PubMed] [Google Scholar]
- Helmchen F, Imoto K, Sakmann B (1996) Ca2+ buffering and action potential-evoked Ca2+ signaling in dendrites of pyramidal neurons. Biophys J 70: 1069-1081. [DOI] [PMC free article] [PubMed] [Google Scholar]
- Helmchen F, Borst JG, Sakmann B (1997) Calcium dynamics associated with a single action potential in a CNS presynaptic terminal. Biophys J 72: 1458-1471. [DOI] [PMC free article] [PubMed] [Google Scholar]
- Holthoff K, Tsay D, Yuste R (2002) Calcium dynamics of spines depend on their dendritic location. Neuron 33: 425-437. [DOI] [PubMed] [Google Scholar]
- Huang H, Bordey A (2004) Glial glutamate transporters limit spillover activation of presynaptic NMDA receptors and influence synaptic inhibition of Purkinje neurons. J Neurosci 24: 5659-5669. [DOI] [PMC free article] [PubMed] [Google Scholar]
- Ichikawa R, Miyazaki T, Kano M, Hashikawa T, Tatsumi H, Sakimura K, Mishina M, Inoue Y, Watanabe M (2002) Distal extension of climbing fiber territory and multiple innervation caused by aberrant wiring to adjacent spiny branchlets in cerebellar Purkinje cells lacking glutamate receptor δ2. J Neurosci 22: 8487-8503. [DOI] [PMC free article] [PubMed] [Google Scholar]
- Jackson MB, Redman SJ (2003) Calcium dynamics, buffering, and buffer saturation in the boutons of dentate granule-cell axons in the hilus. J Neurosci 23: 1612-1621. [DOI] [PMC free article] [PubMed] [Google Scholar]
- Kim J, Alger BE (2004) Inhibition of cyclooxygenase-2 potentiates retrograde endocannabinoid effects in hippocampus. Nat Neurosci 7: 697-698. [DOI] [PubMed] [Google Scholar]
- Koester HJ, Sakmann B (2000) Calcium dynamics associated with action potentials in single nerve terminals of pyramidal cells in layer 2/3 of the young rat neocortex. J Physiol (Lond) 529: 625-646. [DOI] [PMC free article] [PubMed] [Google Scholar]
- Kogo N, Dalezios Y, Capogna M, Ferraguti F, Shigemoto R, Somogyi P (2004) Depression of GABAergic input to identified hippocampal neurons by group III metabotropic glutamate receptors in the rat. Eur J Neurosci 19: 2727-2740. [DOI] [PubMed] [Google Scholar]
- Kosaka T, Kosaka K, Nakayama T, Hunziker W, Heizmann CW (1993) Axons and axon terminals of cerebellar Purkinje cells and basket cells have higher levels of parvalbumin immunoreactivity than somata and dendrites: quantitative analysis by immunogold labeling. Exp Brain Res 93: 483-491. [DOI] [PubMed] [Google Scholar]
- Kreitzer AC, Regehr WG (2001) Retrograde inhibition of presynaptic calcium influx by endogenous cannabinoids at excitatory synapses onto Purkinje cells. Neuron 29: 717-727. [DOI] [PubMed] [Google Scholar]
- Lee CJ, Bardoni R, Tong CK, Engelman HS, Joseph DJ, Magherini PC, Mac-Dermott AB (2002) Functional expression of AMPA receptors on central terminals of rat dorsal root ganglion neurons and presynaptic inhibition of glutamate release. Neuron 35: 135-146. [DOI] [PubMed] [Google Scholar]
- Lee SH, Rosenmund C, Schwaller B, Neher E (2000) Differences in Ca2+ buffering properties between excitatory and inhibitory hippocampal neurons from the rat. J Physiol (Lond) 525: 405-418. [DOI] [PMC free article] [PubMed] [Google Scholar]
- Lehre KP, Danbolt NC (1998) The number of glutamate transporter subtype molecules at glutamatergic synapses: chemical and stereological quantification in young adult rat brain. J Neurosci 18: 8751-8757. [DOI] [PMC free article] [PubMed] [Google Scholar]
- Lehre KP, Rusakov DA (2002) Asymmetry of glia near central synapses favors presynaptically directed glutamate escape. Biophys J 83: 125-134. [DOI] [PMC free article] [PubMed] [Google Scholar]
- Liang YC, Huang CC, Hsu KS, Takahashi T (2004) Cannabinoid-induced presynaptic inhibition at the primary afferent trigeminal synapse of juvenile rat brainstem slices. J Physiol (Lond) 555: 85-96. [DOI] [PMC free article] [PubMed] [Google Scholar]
- Llano I, Leresche N, Marty A (1991) Calcium entry increases the sensitivity of cerebellar Purkinje cells to applied GABA and decreases inhibitory synaptic currents. Neuron 6: 565-574. [DOI] [PubMed] [Google Scholar]
- Llano I, Gonzalez J, Caputo C, Lai FA, Blayney LM, Tan YP, Marty A (2000) Presynaptic calcium stores underlie large-amplitude miniature IPSCs and spontaneous calcium transients. Nat Neurosci 3: 1256-1265. [DOI] [PubMed] [Google Scholar]
- Maejima T, Hashimoto K, Yoshida T, Aiba A, Kano M (2001) Presynaptic inhibition caused by retrograde signal from metabotropic glutamate to cannabinoid receptors. Neuron 31: 463-475. [DOI] [PubMed] [Google Scholar]
- Majewska A, Brown E, Ross J, Yuste R (2000) Mechanisms of calcium decay kinetics in hippocampal spines: role of spine calcium pumps and calcium diffusion through the spine neck in biochemical compartmentalization. J Neurosci 20: 1722-1734. [DOI] [PMC free article] [PubMed] [Google Scholar]
- Maravall M, Mainen ZF, Sabatini BL, Svoboda K (2000) Estimating intracellular calcium concentrations and buffering without wavelength ratioing. Biophys J 78: 2655-2667. [DOI] [PMC free article] [PubMed] [Google Scholar]
- Matsui K, Jahr CE (2003) Ectopic release of synaptic vesicles. Neuron 40: 1173-1183. [DOI] [PubMed] [Google Scholar]
- Matsui K, Jahr CE (2004) Differential control of synaptic and ectopic vesicular release of glutamate. J Neurosci 24: 8932-8939. [DOI] [PMC free article] [PubMed] [Google Scholar]
- Matveev V, Zucker RS, Sherman A (2004) Facilitation through buffer saturation: Constraints on endogenous buffering properties. Biophys J 86: 2691-2709. [DOI] [PMC free article] [PubMed] [Google Scholar]
- Meinrenken CJ, Borst JGG, Sakmann B (2003) Local routes revisited: the space and time dependence of the Ca2+ signal for phasic transmitter release at the rat calyx of Held. J Physiol (Lond) 547: 665-689. [DOI] [PMC free article] [PubMed] [Google Scholar]
- Muller A, Kukley M, Stausberg P, Beck H, Muller W, Dietrich D (2005) Endogenous Ca2+ buffer concentration and Ca2+ microdomains in hippocampal neurons. J Neurosci 25: 558-565. [DOI] [PMC free article] [PubMed] [Google Scholar]
- Neher E (1998) Usefulness and limitations of linear approximations to the understanding of Ca++ signals. Cell Calcium 24: 345-357. [DOI] [PubMed] [Google Scholar]
- Neher E, Augustine GJ (1992) Calcium gradients and buffers in bovine chromaffin cells. J Physiol (Lond) 450: 273-301. [DOI] [PMC free article] [PubMed] [Google Scholar]
- Ohno-Shosaku T, Maejima T, Kano M (2001) Endogenous cannabinoids mediate retrograde signals from depolarized postsynaptic neurons to presynaptic terminals. Neuron 29: 729-738. [DOI] [PubMed] [Google Scholar]
- Ohno-Shosaku T, Tsubokawa H, Mizushima I, Yoneda N, Zimmer A, Kano M (2002) Presynaptic cannabinoid sensitivity is a major determinant of depolarization-induced retrograde suppression at hippocampal synapses. J Neurosci 22: 3864-3872. [DOI] [PMC free article] [PubMed] [Google Scholar]
- Palay SL, Chan-Palay V (1974) Cerebellar cortex: cytology and organization, p 265. New York: Springer.
- Pitler TA, Alger BE (1992) Postsynaptic spike firing reduces synaptic GABAA responses in hippocampal pyramidal cells. J Neurosci 12: 4122-4132. [DOI] [PMC free article] [PubMed] [Google Scholar]
- Poncer JC, McKinney RA, Gahwiler BH, Thompson SM (1997) Either N- or P-type calcium channels mediate GABA release at distinct hippocampal inhibitory synapses. Neuron 18: 463-472. [DOI] [PubMed] [Google Scholar]
- Reid CA, Bekkers JM, Clements JD (2003) Presynaptic Ca2+ channels: a functional patchwork. Trends Neurosci 26: 683-687. [DOI] [PubMed] [Google Scholar]
- Rozsa B, Zelles T, Vizi ES, Lendvai B (2004) Distance-dependent scaling of calcium transients evoked by backpropagating spikes and synaptic activity in dendrites of hippocampal Interneurons. J Neurosci 24: 661-670. [DOI] [PMC free article] [PubMed] [Google Scholar]
- Rusakov DA, Fine A (2003) Extracellular Ca2+ depletion contributes to fast activity-dependent modulation of synaptic transmission in the brain. Neuron 37: 287-297. [DOI] [PMC free article] [PubMed] [Google Scholar]
- Rusakov DA, Wuerz A, Kullmann DM (2004) Heterogeneity and specificity of presynaptic Ca2+ current modulation by mGluRs at individual hippocampal synapses. Cereb Cortex 14: 748-758. [DOI] [PMC free article] [PubMed] [Google Scholar]
- Sabatini BL, Oertner TG, Svoboda K (2002) The life cycle of Ca2+ ions in dendritic spines. Neuron 33: 439-452. [DOI] [PubMed] [Google Scholar]
- Saitow F, Murakoshi T, Suzuki H, Konishi S (2005) Metabotropic P2Y purinoceptor-mediated presynaptic and postsynaptic enhancement of cerebellar GABAergic transmission. J Neurosci 25: 2108-2116. [DOI] [PMC free article] [PubMed] [Google Scholar]
- Satake S, Saitow F, Yamada J, Konishi S (2000) Synaptic activation of AMPA receptors inhibits GABA release from cerebellar interneurons. Nat Neurosci 3: 551-558. [DOI] [PubMed] [Google Scholar]
- Satake S, Saitow F, Rusakov D, Konishi S (2004) AMPA receptor-mediated presynaptic inhibition at cerebellar GABAergic synapses: a characterization of molecular mechanisms. Eur J Neurosci 19: 2464-2474. [DOI] [PMC free article] [PubMed] [Google Scholar]
- Somogyi P, Dalezios Y, Lujan R, Roberts JDB, Watanabe M, Shigemoto R (2003) High level of mGluR7 in the presynaptic active zones of select populations of GABAergic terminals innervating interneurons in the rat hippocampus. Eur J Neurosci 17: 2503-2520. [DOI] [PubMed] [Google Scholar]
- Staub C, De Schutter E, Knopfel T (1994) Voltage-imaging and simulation of effects of voltage- and agonist-activated conductances on soma-dendritic voltage coupling in cerebellar Purkinje cells. J Comput Neurosci 1: 301-311. [DOI] [PubMed] [Google Scholar]
- Tank DW, Regehr WG, Delaney KR (1995) A quantitative analysis of presynaptic calcium dynamics that contribute to short-term enhancement. J Neurosci 15: 7940-7952. [DOI] [PMC free article] [PubMed] [Google Scholar]
- Tempia F, Kano M, Schneggenburger R, Schirra C, Garaschuk O, Plant T, Konnerth A (1996) Fractional calcium current through neuronal AMPA-receptor channels with a low calcium permeability. J Neurosci 16: 456-466. [DOI] [PMC free article] [PubMed] [Google Scholar]
- Thomas D, Tovey SC, Collins TJ, Bootman MD, Berridge MJ, Lipp P (2000) A comparison of fluorescent Ca2+ indicator properties and their use in measuring elementary and global Ca2+ signals. Cell Calcium 28: 213-223. [DOI] [PubMed] [Google Scholar]
- Trommershauser J, Schneggenburger R, Zippelius A, Neher E (2003) Heterogeneous presynaptic release probabilities: functional relevance for short-term plasticity. Biophys J 84: 1563-1579. [DOI] [PMC free article] [PubMed] [Google Scholar]
- Tsien RY (1989) Fluorescent probes for cell signaling. Annu Rev Neurosci 12: 227-253. [DOI] [PubMed] [Google Scholar]
- Wilson RI, Nicoll RA (2001) Endogenous cannabinoids mediate retrograde signalling at hippocampal synapses. Nature 410: 588-592. [DOI] [PubMed] [Google Scholar]
- Wilson RI, Kunos G, Nicoll RA (2001) Presynaptic specificity of endocannabinoid signaling in the hippocampus. Neuron 31: 453-462. [DOI] [PubMed] [Google Scholar]
- Zador A, Koch C (1994) Linearized models of calcium dynamics—formal equivalence to the cable equation. J Neurosci 14: 4705-4715. [DOI] [PMC free article] [PubMed] [Google Scholar]
- Zucker RS, Regehr WG (2002) Short-term synaptic plasticity. Annu Rev Physiol 64: 355-405. [DOI] [PubMed] [Google Scholar]