

Abstract
DNA is thought to behave as a stiff elastic rod with respect to the ubiquitous mechanical deformations inherent to its biology. Here, we measure the mean and variance of end-to-end length for a series of DNA double helices in solution, using small-angle X-ray scattering interference between gold nanocrystal labels. The data rule out the conventional elastic rod model. Specifically, the variance in end-to-end length follows a quadratic dependence on the number of base pairs rather than the expected linear dependence. Absent applied tension, DNA is at least one order of magnitude softer than measured by single-molecule stretching experiments. Our observations indicate that DNA stretching is cooperative over more than two turns of the DNA double helix, and support the idea of long-range allosteric communication through DNA structure.
Since its double helical structure was discovered fifty years ago (1), the average structure and internal fluctuations of DNA have been the object of intense study. Near its equilibrium structure, the DNA duplex is generally viewed as an ideal elastic rod. Current estimates put the bending rigidity B at ~230 pN•nm2, the torsional rigidity C at 200-500 pN•nm2, and the stretching modulus S (the extrapolated force required to double the length of the DNA) at ~1000 pN (2-7). Recent experimental observations, however, have called into question the accuracy of this simple mechanical picture. For example, single-molecule measurements show that over-twisting of DNA induces helix stretching (8). This twist-stretch coupling leads to a revised picture of DNA in which the helix core is modeled as an elastic rod while the phosphodiester backbone is modeled as a rigid wire. Analysis of DNA bending on short length scales has also yielded surprises. Specifically, ~100 base pair DNA helices appear to circularize 2-4 orders of magnitude faster than would be predicted by the elastic rod model, leading to the idea that discrete kinks contribute significantly to DNA bending (9, 10).
The most straightforward way to characterize DNA structural fluctuations would be to directly visualize them under non-perturbing solution conditions. Kilobase sized DNA structures have been imaged in real time, but it has not been possible to resolve bending, twisting and stretching fluctuations at the microscopic level. Alternatively, analyzing the motions of very short DNA fragments simplifies the problem by limiting the contributions from bending. In practice, this has proved technically challenging. The experimental tools suited to the job, molecular rulers, provide an indirect readout of distance that is difficult to relate quantitatively to variation in end-to-end length. Indeed, short DNA duplexes are often assumed to be completely rigid and used as length standard controls for new molecular rulers (11-14).
Our investigations apply a recently developed technique for measuring distance distributions based on small-angle X-ray scattering interference between heavy-atom nanocrystals (15). Gold nanocrystals with radii of 7 Å are site-specifically attached to the ends of DNA double helices of varying length, as illustrated for a 20 base-pair DNA segment in Fig. 1a. The experimental scattering profile for this molecule (Fig. 1b) displays a characteristic oscillation with an inverse period of 86 Å, due to the scattering interference between the nanocrystals. This interference pattern is decomposed into a linear combination of basis scattering functions corresponding to discrete separation distances between the nanocrystals, providing the inter-particle distance distribution (Fig. 1c). Distributions measured this way can be extremely sharp if the probes are at fixed distances, and reveal broadened, highly skewed, or even bimodal distance distributions if they are present (15). The X-ray ruler reads out an effectively instantaneous distribution of distances, due to the short timescale of X-ray scattering from bound electrons. The nanocrystal labels produce no detectable disruption of the structure of DNA double helices as monitored by CD spectroscopy, and negligibly alter the melting thermodynamics of the helices into single strands (Table S1 and Fig. S1). As a further precaution against any undetected effects on DNA structure from the gold probes, we base our conclusions below on the change in probe separation as the helix length is increased, and not on the absolute value of the measurement for a single DNA construct.
Figure 1.
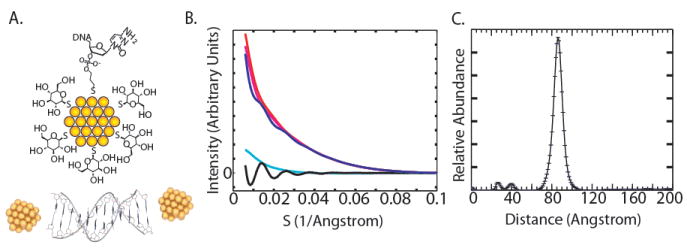
[a] Top: Schematic of a thioglucose passivated gold nanocrystal coupled to a deoxycytidylate base bearing a 3’-thiol group. The thiol forms a bond directly to the gold nanocrystal core. Bottom: Model coordinates of a DNA duplex with a gold nanocrystal at either end. Cluster ligands and propyl linkers are not shown.
[b] Scattering intensity as a function of scattering angle for the 20 base-pair double-labeled [blue], single-labeled [red, magenta; indistinguishable], and unlabeled [cyan] DNA duplexes. The intensity of the double-labeled sample has been scaled by a factor of one half to aid visual comparison. The pattern of scattering interference between the two nanocrystal labels [black] is obtained by summing the intensities of the double-labeled and unlabeled samples, and subtracting off the intensities of the two single-labeled samples (15). The data were obtained at 200 μM DNA concentration and are averages of ten one-second exposures. Measurements were made at 25 °C in the presence of 70 mM Tris-HCl, pH 8.0, 100 mM NaCl, and 10 mM ascorbic acid. The scattering parameter S is defined as 2sin(θ)/λ, where 2θ is the scattering angle and λ is the X-ray wavelength.
[c] Transformation of the nanocrystal scattering interference pattern into a weighted sum of sinusoidal basis functions (corresponding to different inter-probe distances) yields the probability distribution for nanocrystal center-of-mass separation (15).
We prepared labeled DNA duplexes with lengths between 10 and 35 base pairs in 5 base-pair increments (Table S2). The scattering interference profiles for these molecules (Fig. 2a) give end-to-end distance distributions with approximately symmetric fluctuations around a well-defined mean distance (Fig. 2b). The inter-probe distance increases approximately linearly with the number of helix base pairs (Fig. 3a). A fit to these data that takes into account the potential displacement of the gold probes off of the helix axis (Fig. S2) gives an average rise per base-pair of 3.29±0.07 Å (Fig. 3a), in close agreement with the average crystallographic value of 3.32±0.19 Å (16). To estimate measurement errors, we compared distributions from independently prepared samples exposed at two different X-ray beamlines and with different detectors and calibration standards (Fig. S3). The scatter in the mean was 0.4 Å for the shortest duplex and 0.9 Å for the longest duplex, with intermediate values for the other constructs (the error bars are smaller than the marker size in Fig. 3a). The deviation of the fit from the data exceeds the measurement error, and may reflect sequence-dependent variation in the rise per base-pair (16). The X-ray ruler gives a rise per base-pair intermediate between the lower values (2.9-3.1 Å) observed in microscopy experiments (17-19) and the somewhat higher “canonical” value (3.4 Å) obtained for DNA in condensed states or under tension (20, 21).
Figure 2.
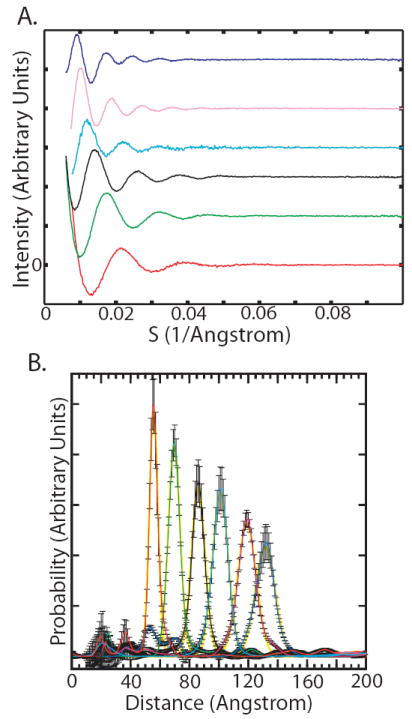
[a] Nanocrystal scattering interference patterns obtained for the 10 [red], 15 [green], 20 [black], 25 [cyan], 30 [magenta], and 35 [blue] base-pair duplexes are offset vertically. See Table S2 for DNA sequences.
[b] Probability distance distribution curves for the 10 [red], 15 [green], 20 [black], 25 [cyan], 30 [magenta], and 35 [blue] base-pair duplexes. The distributions are normalized to sum to unity. Each distribution was fit to a Gaussian curve [yellow] using the ‘fminsearch’ function in MATLAB. See Fig. S10 for distance distribution curves plotted individually with error bars, and Fig. S3 for repeated measurements using independently prepared samples at two different X-ray synchrotron beamlines.
Figure 3.

[a] Mean nanocrystal-nanocrystal separation distance of end-labeled duplexes [circles] and internally labeled duplexes [triangles] is plotted with respect to the number of intervening DNA base-pair steps. The distances for the end-labeled duplexes oscillate around a straight line [dashed blue line]. A three-variable fit accounting for rotation of the nanocrystal probes around the helix axis [solid black line, Fig. S2, R2=0.9995] gives a rise per base pair of 3.29 ± 0.07 Å and a 9 Å radial displacement of the nanocrystals off of the helix axis. A similar two-variable fit to the internally labeled duplex distances [dashed black line, R2=0.9992] gives a rise per base pair of 3.27 ± 0.1 Å and a 21 Å radial displacement of the nanocrystals off of the helical axis. Each fit takes into account the reduction in end-to-end length expected from bending fluctuations (Table S3). The distance data points derive from the Gaussian curves in Figure 2b. The measurement errors are estimated to be ± 0.5%, based on repeat experiments with independently prepared samples at two different synchrotrons, and are smaller than the graph symbols (Fig. S3).
[b] Variance in nanocrystal-nanocrystal separation distance of end-labeled duplexes [circles] and internally labeled duplexes [triangles] is plotted with respect to the number of intervening DNA base-pair steps. The variance predictions for an ideal elastic rod with a stretching modulus of 1000 pN (the value measured in single molecule stretching experiments) are shown [dashed black line] and deviate grossly from the data. A linear relationship between variance and base-pair steps [dashed cyan line, two variables, R2=0.919] is expected if the stretching of base-pair steps is uncorrelated along the DNA duplex (Appendix B). Alternatively, a quadratic relationship [solid black line, two variables, R2=0.997] should hold if the DNA stretches cooperatively. The quadratic fit indicates that each base-pair step contributes 0.21 Å of standard deviation to the end-to-end length of a duplex. The y-intercept of 5.7 Å2 corresponds to variance arising from experimental factors. The variance data points derive from the Gaussian curves in Figure 2b. Each fit takes into account the reduction in variance expected from bending fluctuations (Table S3). The uncertainties in the variance values are estimated to be ± 6.6%, based on the standard deviation of repeated measurements for the 25 base-pair duplex at independent beamlines and with independently prepared samples (Fig. S3).
Structural fluctuations of the DNA should be reflected in the width of the measured distance distributions after other sources of variance, such as linker flexibility and nanocrystal size heterogeneity, have been taken into account (Fig. 3b). DNA-independent factors are expected to contribute the same amount of variance to measurements with different duplexes (~6 Å2 as fit in Fig. 3b). Thus, the increase in distribution width with DNA length must derive from structural changes in the DNA itself. Three facts argue that stretching fluctuations, rather than bending fluctuations or twisting fluctuations, dominate the approximately ±10% spread in end-to-end distance that we observe. First, the DNA samples studied here are significantly shorter than the bending persistence length of double helical DNA (22). Both Monte Carlo calculations and an analytical approximation (Table S3 and (23)) give 7 Å2 to be the maximum contribution of bending fluctuations to the end-to-end length variance of the 35 base-pair duplex. This value accounts for only fourteen percent of the observed variance. Second, DNA bends produce asymmetrical distributions with shoulders at shorter distances (15), whereas the distributions we observe are symmetrical (Fig. 2b). Finally, because the nanocrystals lie close to the helical axis (Fig. 3a and Supporting Fig. S2), twisting fluctuations have small effects on the measured end-to-end distances and cannot account for the observed variance.
The distance distributions are not consistent with the conventional model of the DNA duplex as an ideal elastic rod with a stretch modulus of ≈1000 pN. To illustrate the point, suppose that the entire 8.5 Å2 variance of the 10 base-pair duplex distribution arises from experimental sources unrelated to DNA stretching. Presumably, the same 8.5 Å2 applies to the other duplex samples, which differ only by addition of base pairs to the center of the duplex sequence. The conventional model predicts that for the longest 35 base-pair duplex, DNA stretching should contribute an additional 3.3 Å2 of variance, for a total variance of 11.8 Å2 (dashed black line in Fig. 3b and Appendix A). In fact, the observed variance is 51 Å2; the contribution of DNA stretching to the variance is roughly thirteen-fold larger than predicted. A linear fit of the observed variances with respect to DNA length (dashed cyan line in Fig. 3b) indicates an apparent stretch modulus of ≈91 pN. The resistance of DNA to stretching is thus significantly weaker in the absence of tension, as measured herein, than in the presence of high tension, as in single-molecule stretching experiments.
A notable feature of the X-ray scattering data is how the variances change with duplex length (Fig. 3b). The elastic rod model predicts that the variance should increase linearly with the number of base steps (dashed lines in Fig. 3b). In contrast, we observe a quadratic dependence of variance on DNA length. The errors in the measured variances fall between 0.2 and 2.0 Å2, based on replicate measurements at different X-ray beamlines with independently prepared samples (Fig. S3). The data fit a quadratic dependence to within this measurement error (black line; χ2= 7.5 with 7 degrees of freedom; P = 0.39) but not a linear dependence (cyan dashed line; χ2= 91 with 7 degrees of freedom; P = 7.4×10⁻¹⁷). A quadratic increase in variance can only occur if the stretching fluctuations of neighboring base steps in a duplex are tightly correlated (Appendix B). Fits to models that interpolate between linear and quadratic dependences with a range of correlation lengths are given in Fig. S4. These fits demonstrate that the stretching correlation must persist over at least two turns of a double helix. Thus, short DNA fragments stretch cooperatively: as the first two bases move further apart, so do the last two bases.
We performed numerous controls to rule out experimental artifacts. One worry was that the nanocrystals or DNA might be damaged by X-ray radiation. A variety of tests show that, in the presence of the radical scavenger ascorbate, the samples are not damaged during data collection (Fig. S5 and (15)). Another concern was that as the synthetic DNA fragments became longer, the incidence of single base deletions might increase, resulting in an anomalous length-variance trend. However, electrophoretic and chromatographic analyses show that all of the samples are >94% pure (Fig. S5 and S6). A third possibility was that a lower signal-to-noise ratio in the longer duplex data sets might lead to broadened distributions. However, when all of the data sets are degraded by truncation at low scattering angles and by addition of white noise so as to match the 35 base-pair data set, the measured means and variances do not change appreciably (Fig. S7). To control for possible end effects, three duplexes were labeled internally by attaching gold probes to the DNA bases (Fig. S8). The distance measurements for these internally labeled duplexes are consistent with the measurements for the end-labeled duplexes (Fig. 3). Finally, we examined how long-range electrostatic forces might affect the end-to-end distance distributions. The nanocrystals prepared for these studies possess a weak net negative charge (based on gel electrophoresis; data not shown). Nevertheless, measurements at 10 mM, 100 mM, and 1M NaCl (Debye screening lengths of 30 Å, 10 Å, and 3 Å, respectively) give indistinguishable variances, indicating a negligible role of electrostatic repulsion between the two probes and between the probe and DNA in the variance measurements. The melting temperatures for the unlabeled, singly labeled and doubly labeled duplexes also indicate a negligible interaction energy between the nanocrystals (Table S1).
In light of our findings, we re-examined previous structural studies of short DNA duplexes (24). A comprehensive analysis of the end-to-end lengths for DNA duplexes in the Nucleic Acid Database reveals a range of distances that is consistent with our solution observations (Fig. S9). However, this crystallographic distribution might be artificially broadened because it includes many different DNA sequences and crystallization conditions, or artificially narrowed because it includes many structures solved at 109°K. A plot of crystallographic length variance with respect to number of base steps is noisy, and can be fit equally well with linear or quadratic curves. These data are therefore inconclusive with respect to the cooperativity of DNA stretching. We also reevaluated recently published time-resolved single-molecule Forster resonance energy transfer (FRET) (25) and electron spin resonance data (26) measured on DNA duplex samples. Plots of the end-to-end length variance derived from these data with respect to duplex length are clearly better fit by a quadratic relationship than by a linear relationship (Fig. S9; both fits have two degrees of freedom). Although the data are noisy, the independent molecular-ruler measurements support the conclusion that short DNA duplexes stretch cooperatively.
A remaining puzzle is why DNA under tension appears to be much stiffer than relaxed DNA. One possibility is that the soft stretching mechanism we observe has a limited range, and is fully extended at tensions greater than ~10 pN (the force above which helix stiffness is typically measured in single-molecule force-extension curves). For example, suppose that each base step can adopt either a short or a long conformation (say 3.3 Å ± 10%) of equivalent energy, and that the conformational state of contiguous bases is correlated over a length of thirty-five nucleotides. In the absence of tension, short DNA duplexes would populate equally the short and long conformations and therefore exhibit end-to-end distance distributions covering ± 10% of the mean length (Fig. 4). The variance of these distributions would grow quadratically with duplex length (Appendix B). Under a stretching force, however, the DNA would preferentially adopt the long conformation, and this degree of freedom would saturate at modest tensions. Ninety-nine percent of the base steps would exist in the long conformation at room temperature under 8 pN of applied force, and the apparent stretching modulus would be 1000 pN (Appendix B). Thus, a very soft stretching degree of freedom in the absence of tension can behave as a very stiff stretching degree of freedom when the duplex is under tension. The stretching of DNA at larger forces would presumably occur by a different mechanism. We note that this two-state model is oversimplified with respect to our data because our measurements would spatially resolve the short and long states if only two existed. However, the saturation behavior holds for models with a larger number of states.
Figure 4.

Molecular models of 30 base-pair B-form DNA double helices with lengths 10% smaller (top) and 10% larger (bottom) than the canonical length (center) preserve base pairing geometry and are sterically allowed. The models were produced using Rosetta with constraints on local rise parameters to induce compression or stretching (30). The starting model coordinates were generated by the DNA Star Web Server (31). The figure was rendered using PovScript+ (32).
Additional theoretical and experimental work will be required to reveal the microscopic basis for correlated DNA stretching fluctuations, and its potential relation to other recently discovered non-ideal properties of DNA (8-10). Interestingly, whereas FRET experiments with nanosecond time resolution indicate large DNA stretching fluctuations (25), alternative FRET experiments that average single-molecule FRET signals over hundreds of microseconds do not (27). Thus, DNA stretching dynamics likely occur on a timescale between 10-8 and 10-5 seconds. Molecular simulations intended to model DNA stretching will have to access this time regime.
The presence of long-range stretching correlations implies that DNA double helices can, in principle, transmit information over at least twenty base pairs through an allosteric “domino effect” (28, 29). For example, in the context of the two-state model, a protein that favors binding to a stretched segment of double helix would disfavor the binding of another protein that prefers a compressed conformation. This effect would propagate to sites within twenty base-pairs, and possibly further. Whether such DNA-mediated allosteric communication alters how the double helix and its specific binding partners interact to regulate biological processes remains to be tested.
Supplementary Material
References and Notes
- 1.Watson JD, Crick FH. Nature. 1953;171:737. doi: 10.1038/171737a0. [DOI] [PubMed] [Google Scholar]
- 2.Bryant Z, Stone MD, Gore J, Smith SB, Cozzarelli NR, Bustamante C. Nature. 2003;424:338. doi: 10.1038/nature01810. [DOI] [PubMed] [Google Scholar]
- 3.Smith SB, Cui Y, Bustamante C. Science. 1996;271:795. doi: 10.1126/science.271.5250.795. [DOI] [PubMed] [Google Scholar]
- 4.Shore D, Baldwin RL. J Mol Biol. 1983;170:957. doi: 10.1016/s0022-2836(83)80198-3. [DOI] [PubMed] [Google Scholar]
- 5.Shore D, Baldwin RL. J Mol Biol. 1983;170:983. doi: 10.1016/s0022-2836(83)80199-5. [DOI] [PubMed] [Google Scholar]
- 6.Wang MD, Yin H, Landick R, Gelles J, Block SM. Biophys J. 1997;72:1335. doi: 10.1016/S0006-3495(97)78780-0. [DOI] [PMC free article] [PubMed] [Google Scholar]
- 7.Depew DE, Wang JC. Proc Natl Acad Sci USA. 1975;72:4275. doi: 10.1073/pnas.72.11.4275. [DOI] [PMC free article] [PubMed] [Google Scholar]
- 8.Gore J, Bryant Z, Nollmann M, Le MU, Cozzarelli NR, Bustamante C. Nature. 2006;442:836. doi: 10.1038/nature04974. [DOI] [PubMed] [Google Scholar]
- 9.Cloutier TE, Widom J. Mol Cell. 2004;14:355. doi: 10.1016/s1097-2765(04)00210-2. [DOI] [PubMed] [Google Scholar]
- 10.Cloutier TE, Widom J. Proc Natl Acad Sci USA. 2005:3645. doi: 10.1073/pnas.0409059102. [DOI] [PMC free article] [PubMed] [Google Scholar]
- 11.Hillisch A, Lorenz M, Diekmann S. Curr Opin Struct Biol. 2001;11:201. doi: 10.1016/s0959-440x(00)00190-1. [DOI] [PubMed] [Google Scholar]
- 12.Sönnichsen C, Reinhard BM, Liphardt J, Alivisatos AP. Nat Biotechnol. 2005;23:741. doi: 10.1038/nbt1100. [DOI] [PubMed] [Google Scholar]
- 13.Zhu P, Clamme JP, Deniz AA. Biophys J. 2005;89:L37. doi: 10.1529/biophysj.105.071027. [DOI] [PMC free article] [PubMed] [Google Scholar]
- 14.Churchman LS, Okten Z, Rock RS, Dawson JF, Spudich JA. Proc Natl Acad Sci. 2005;102:1419. doi: 10.1073/pnas.0409487102. [DOI] [PMC free article] [PubMed] [Google Scholar]
- 15.Mathew-Fenn RS, Das R, Silverman JA, Walker PA, Harbury PB. 2008 doi: 10.1371/journal.pone.0003229. submitted. [DOI] [PMC free article] [PubMed] [Google Scholar]
- 16.Olson WK, Gorin AA, Lu XJ, Hock LM, Zhurkin VB. Proc Natl Acad Sci USA. 1998;95:11163. doi: 10.1073/pnas.95.19.11163. [DOI] [PMC free article] [PubMed] [Google Scholar]
- 17.Griffith JD. Science. 1978;201:525. doi: 10.1126/science.663672. [DOI] [PubMed] [Google Scholar]
- 18.Rivetti C, Guthold M, Bustamante C. J Mol Biol. 1996;264:919. doi: 10.1006/jmbi.1996.0687. [DOI] [PubMed] [Google Scholar]
- 19.Sakata-Sogawa K, Kurachi M, Sogawa K, Fujii-Kuriyama Y, Tashiro H. Eur Biophys J. 1998;27:55. doi: 10.1007/s002490050110. [DOI] [PubMed] [Google Scholar]
- 20.Zimmerman SB, Pheiffer BH. J Mol Biol. 1979;135:1023. doi: 10.1016/0022-2836(79)90526-6. [DOI] [PubMed] [Google Scholar]
- 21.Ulyanov NB, James TL. Methods Enzymol. 1995;261:90. doi: 10.1016/s0076-6879(95)61006-5. [DOI] [PubMed] [Google Scholar]
- 22.Baumann CG, Smith SB, Bloomfield VA, Bustamante C. Proc Natl Acad Sci USA. 1997;94:6185. doi: 10.1073/pnas.94.12.6185. [DOI] [PMC free article] [PubMed] [Google Scholar]
- 23.Fujimoto BS, Schurr JM. Biopolymers. 2000;54:561. doi: 10.1002/1097-0282(200012)54:7<561::AID-BIP80>3.0.CO;2-M. [DOI] [PubMed] [Google Scholar]
- 24.See supporting material on Science online.
- 25.Laurence TA, Kong X, Jager M, Weiss S. Proc Natl Acad Sci USA. 2005;102:17348. doi: 10.1073/pnas.0508584102. [DOI] [PMC free article] [PubMed] [Google Scholar]
- 26.Cai Q, et al. Nucleic Acids Res. 2006;34:4722. doi: 10.1093/nar/gkl546. [DOI] [PMC free article] [PubMed] [Google Scholar]
- 27.Nir E, et al. J Phys Chem B. 2006;110:22103. doi: 10.1021/jp063483n. [DOI] [PMC free article] [PubMed] [Google Scholar]
- 28.Schurr JM, Delrow JJ, Fujimoto BS, Benight AS. Biopolymers. 1997;44:283. doi: 10.1002/(SICI)1097-0282(1997)44:3<283::AID-BIP7>3.0.CO;2-R. [DOI] [PubMed] [Google Scholar]
- 29.Kosikov KM, Gorin AA, Zhurkin VB, Olson WK. J Mol Biol. 1999;289:1301. doi: 10.1006/jmbi.1999.2798. [DOI] [PubMed] [Google Scholar]
- 30.Morozov AV, Havranek JJ, Baker D, Siggia ED. Nucleic Acids Res. 2005;33:5781. doi: 10.1093/nar/gki875. [DOI] [PMC free article] [PubMed] [Google Scholar]
- 31.Yongxing L, Beveridge DL. 1999 http://ludwig.chem.wesleyan.edu/dna/
- 32.Fenn TD, Ringe D, Petsko GA. J Appl Cryst. 2003;36:944. [Google Scholar]
- 33.We gratefully acknowledge early discussions with C.J. Ackerson on nanocrystal synthesis and insights into DNA from R.L. Baldwin, F.E. Boas, Z.D. Bryant, L.S. Churchman, A.R. Dunn, D.R. Halpin, D. Herschlag, W.L. Martin, B.H. Robinson, J.M. Schurr, A.L. Smith, R.M. Weisinger, and S.J. Wrenn. We thank Y. Bai, S. Doniach, K. Ito, J. Lipfert, I.S. Millett, S. Seifert, P. Thiyagarajan and H. Tsuruta for their assistance with and advice on X-ray scattering. We thank T.D. Fenn for writing code that was used to calculate crystallographic dispersion values and for valuable discussions throughout this work. We thank P.A. Walker for expert assistance with DNA synthesis, and P. Bradley and D. Baker for permitting use of unpublished code to prepare Figure 4. This work was supported by the National Institutes of Health (GM068126-01 to P.B.H.). We acknowledge additional funding from the NIH (training grant fellowship to R.S.F. and support of SSRL), the NSF (graduate fellowship to R.D.), and the U.S. DOE. (Contract W-31-109 Eng-438 to the APS, and support of SSRL).
Associated Data
This section collects any data citations, data availability statements, or supplementary materials included in this article.