Abstract
Enhancer of zeste homolog 2 (EZH2) is a mammalian histone methyltransferase that contributes to the epigenetic silencing of target genes and that regulates the survival and metastasis of cancer cells. EZH2 is overexpressed in aggressive solid tumors by mechanisms that remain unclear. Here, we show that the expression and function of EZH2 in cancer cell lines is inhibited by microRNA-101 (miR-101). Analysis of human prostate tumors revealed that miR-101 expression decreases during cancer progression, paralleling an increase in EZH2 expression. One or both of the two genomic loci encoding miR-101 were somatically lost in 37.5% of clinically localized prostate cancers (6/16) and 66.7% of metastatic disease (22/33). We propose that genomic loss of miR-101 in cancer leads to overexpression of EZH2 and concomitant dysregulation of epigenetic pathways, resulting in cancer progression.
Polycomb Group Proteins, including EZH2, play a master regulatory role in controlling important cellular process such as maintaining stem cell pluripotency (1–3), cell proliferation (4, 5), early embryogenesis (6), and X chromosome inactivation (7). EZH2 functions in a multi-protein complex called Polycomb Repressive Complex 2 (PRC2) which includes SUZ12 (Suppressor of Zeste 12) and EED (Embryonic Ectoderm Development) (8, 9). The primary activity of the EZH2 protein complex is to tri-methylate histone H3 lysine 27 (H3K27) at target gene promoters, leading to epigenetic silencing (10, 11). Mounting evidence suggests that EZH2 has properties consistent with those of an oncogene, as overexpression promotes cell proliferation, colony formation, and increased invasion of benign cells in vitro (4, 5, 12) and induces xenograft tumor growth in vivo (13). Likewise, knock-down of EZH2 in cancer cells results in growth arrest (4, 13) as well as diminished tumor growth (10) and metastasis in vivo (14).
EZH2 was initially found to be elevated in a subset of aggressive, clinically localized prostate cancers and almost all metastatic prostate cancers (4). Subsequently EZH2 has also been found to be aberrantly overexpressed in breast cancer (12), melanoma (15), bladder cancer (16), gastric cancer (17) and other cancers (5). Thus, while EZH2 is broadly overexpressed in aggressive solid tumors and has properties of an oncogene, the genetic mechanism of EZH2 elevation in cancer is unclear.
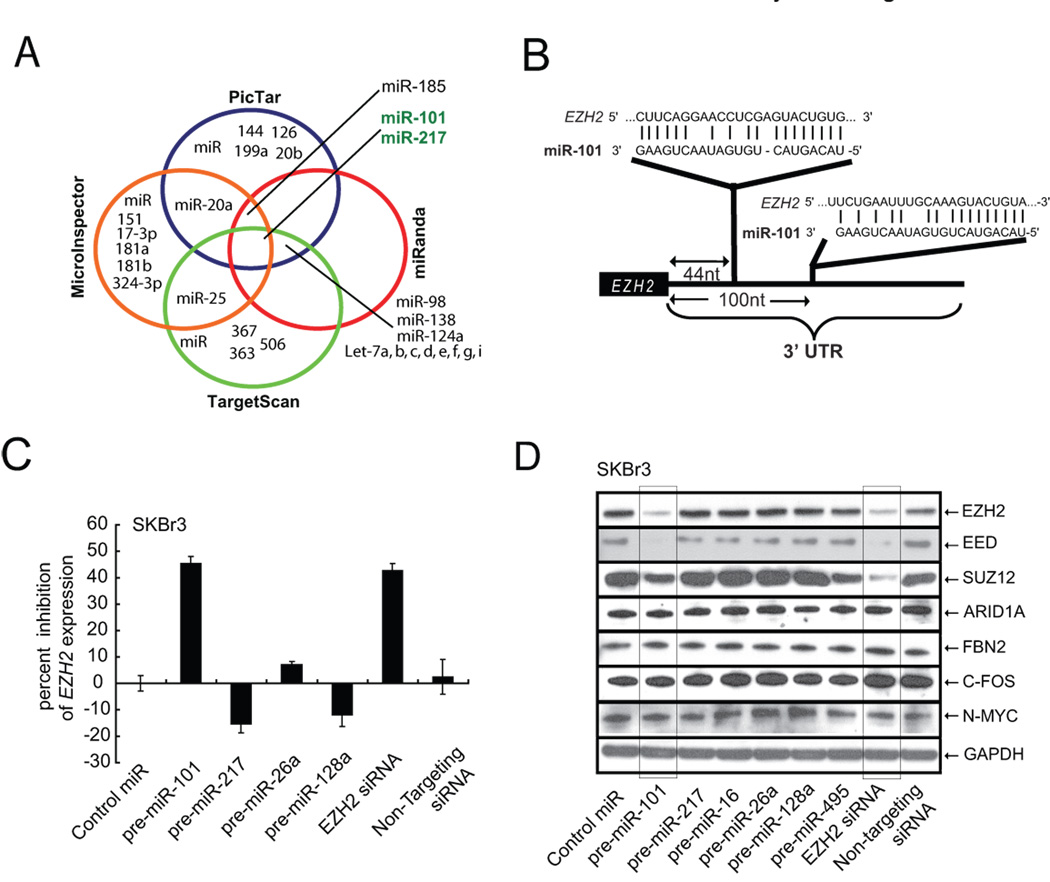
As microRNAs (miRNAs) have gained considerable attention as regulators of gene expression (18), and play important roles in cellular differentiation and embryonic stem cell development (19), we postulated that they may play a role in modulating EZH2 expression. In order to test whether miRNAs play a role in controlling EZH2 expression, we computationally nominated those that might contribute to EZH2 regulation. Since it has been determined that intersecting the results of multiple prediction algorithms can increase specificity, at the cost of lower sensitivity (20), we chose to integrate the results of the prediction programs PicTar (21), TargetScan (22), miRanda (23), and miRInspector (24). Overall, only 29 miRNAs were found by any program to target EZH2, while only miR-101 and miR-217 were found by all four programs to be predicted to regulate EZH2 (Fig. 1A and table S1) (25). Furthermore, PicTar, miRanda, and TargetScan predicted two miR-101 binding sites within the EZH2 3’UTR (Fig. 1B) whereas PicTar and TargetScan predicted two miR-217 binding sites within the EZH2 3’UTR. Of the 34 miRNAs predicted to regulate EZH2 by at least one program (table S1), only miR-101 had a strong negative association with prostate cancer progression from benign to localized disease to metastasis (as covered later in Fig. 4A).
Fig. 1.
miR-101 regulates EZH2 transcript and protein expression. (A) Venn diagram displaying miRNAs computationally predicted to target EZH2 from PicTar (blue), miRanda (red), TargetScan (green), and MicroInspector (orange). (B) Schematic of two predicted miR-101 binding sites in the EZH2 3’UTR. (C) miR-101 regulates EZH2 transcript expression. qRT-PCR of EZH2 in SKBr3 cells transfected with precursor miR-101. Control miR and other precursor miRNAs (miR-26a, miR-128a, and miR-217) were also used for transfection. (D), miR-101 regulates Polycomb Group Complex 2 protein expression. miR-101 downregulates EZH2 protein as well as Polycomb members SUZ12 and EED in SKBr3 cells. Control miRs and EZH2 specific siRNA were also used for transfection. The experiment was performed three independent times and a representative result displayed.
Fig. 4.
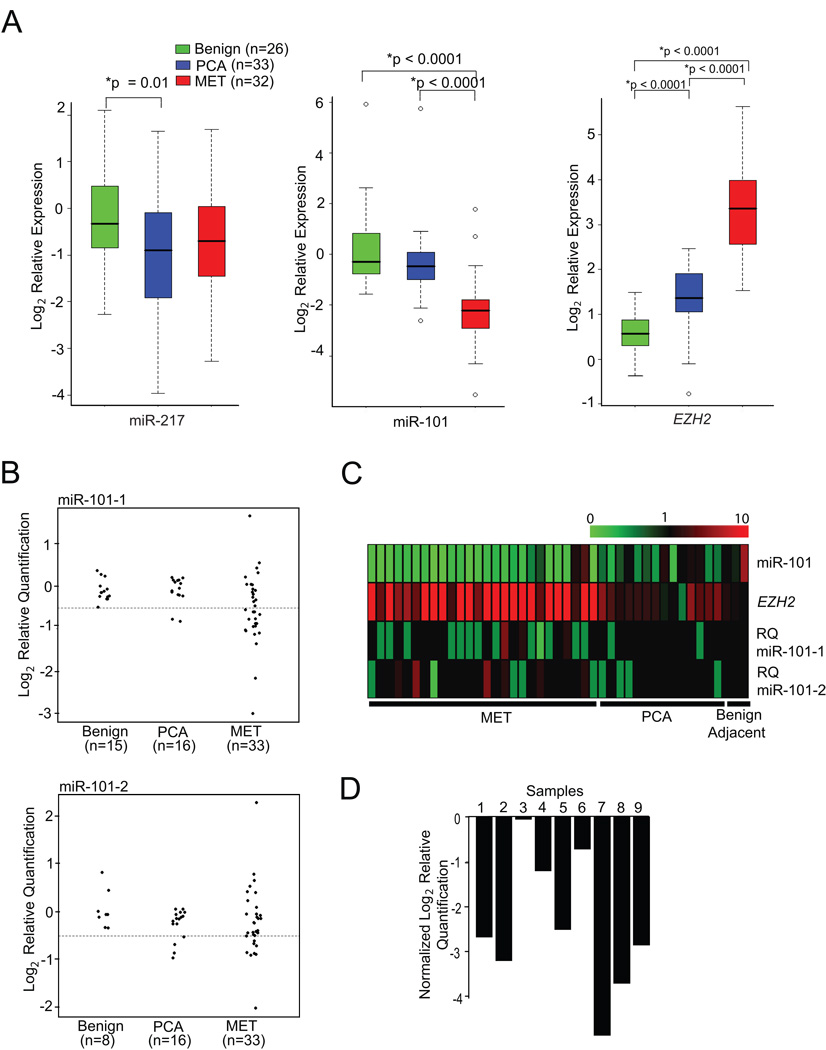
Genomic loss of the miR-101 locus may explain overexpression of EZH2 in solid tumors. (A) miR-101 transcript levels are inversely correlated with EZH2 expression in prostate cancer progression. qPCR was performed for miR-101 and miR-217 using total RNA from benign adjacent prostate, prostate cancer (PCA), and metastatic (MET) prostate cancer tissue. EZH2 expression was analyzed from the same RNA samples. (B) Genomic PCR of miR-101-1 and miR-101-2 in prostate cancer progression. Vertical axes represent log (base 2) relative quantification values; dashed lines are shown at the deletion threshold of log2(0.7)≈−0.51. For clarity, points have been horizontally displaced within each sample class. (C) Heatmap representation of matched normal, tumor, and metastatic samples (from right to left) in which miR-101 transcript, EZH2 transcript, and both miR-101-1 and miR-101-2 relative copy number were assessed. miR-101 and EZH2 expression is represented by a color scale highlighting down-regulation (green), no alteration (black), and up-regulation (red) of transcripts. miR-101-1 and miR-101-2 relative quantitation (RQ) of copy number are represented as homozygous loss (< 0.3; bright green), single copy loss (< 0.7; light green), no copy number change (>= 0.7 and <= 1.3; black), single copy gain (> 1.3; light red), and double copy gain (> 1.7; bright red). (D) Evidence that the miR-101-1 locus is somatically lost in tumors samples relative to matched normal samples. Nine metastatic prostate cancers were chosen that have copy number loss in the miR-101-1 locus, and matched normal tissue were analyzed for comparison. Bar heights represent differences in log2(RQ) values between metastatic and matched normal tissues.
To examine whether miR-101 could regulate the 3’UTR of EZH2, we generated luciferase reporters encoding the normal, antisense, and mutated versions of the EZH2 3'UTR. Overexpression of miR-101, but not miR-217 or control miRNA decreased the activity of the luciferase reporter encoding the 3’UTR of EZH2 (fig. S1). Similarly, the antisense and mutant EZH2 3’UTR activity were not inhibited by miR-101. In order to test whether the 3’UTR binding by miR-101 results in down-regulation of the EZH2 transcript, we transfected SKBr3 breast cancer cells (which express high level of endogenous EZH2) with precursors of miR-101, miR-217, control miRNA as well as several other unrelated miRNAs. qRT-PCR clearly demonstrated a reduction in EZH2 transcript levels by miR-101 (Fig. 1C), but not miR-217 or other control miRs.
To determine whether miR-101 represses EZH2 protein expression, we performed immunoblot analysis using an EZH2 specific antibody, as well as antibodies to other PRC2 members, including EED and SUZ12 (Fig. 1D). In addition to miR-101, we also included other miRNAs predicted to regulate EZH2 including miR-217 and miR-26a. Control miR-495 was predicted by TargetScan to target PRC1 component BMI-1. Only miR-101 and EZH2 siRNA attenuated EZH2 protein expression. Interestingly, miR-101 overexpression also leads to repression of EZH2’s tight binding partners in the PRC2 complex, EED, and to a lesser extent SUZ12. These proteins, are thought to form a co-regulated functional complex and altering the expression of one affects the expression of the others (5, 26, 27). In this particular case, upon further inspection of the 3’UTRs of the PRC2 components, miR-101 binding sites were found in EED (fig. S2) but not in SUZ12. Since miRNAs are known to regulate multiple target genes, and in some cases over hundreds of genes (18), we used the prediction algorithm TargetScan to nominate targets of miR-101. In addition to EZH2 and EED, we tested 4 miR-101 predicted targets (table S2) that have been implicated in cancer pathways including n-Myc, c-Fos, ARID1A, and FBN2. Importantly, none of these putative miR-101 targets were affected by overexpression of miR-101 (Fig. 1D). To support the findings from our miR-101 overexpression experiments, we employed antagomiR technology (28) to specifically inhibit miR-101 expression in benign immortalized breast epithelial cells (fig. S3). Two independent antagomiRs to miR101 (i and ii) induced expression of EZH2 protein in benign breast epithelial cells.
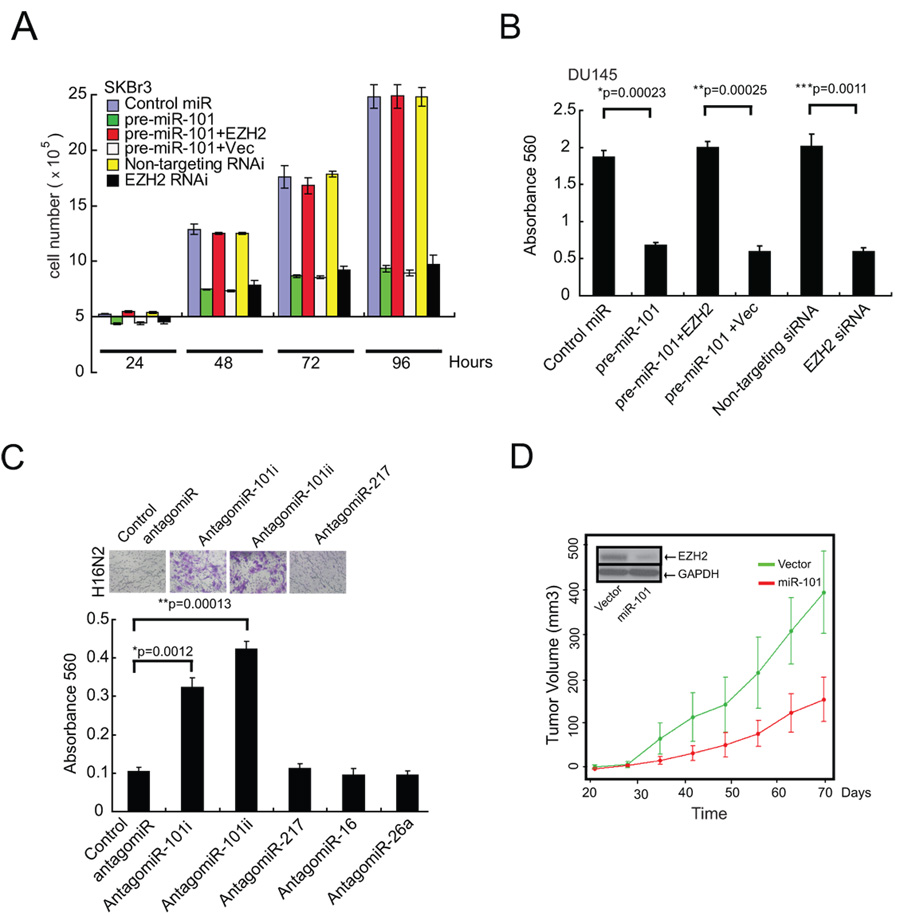
While we have strong evidence that miR-101 regulates EZH2 expression, we wanted to determine whether it affects EZH2 and PRC2 function. To accomplish this we evaluated cellular proliferation, a property known to be regulated by EZH2 (4, 5). miR-101 overexpression in SKBr3 and DU145 cells markedly attenuated cell proliferation (Fig. 2A, fig. S4). Importantly, overexpression of EZH2 (without an endogenous 3’UTR) rescued the inhibition of cell growth by miR-101 suggesting target specificity.
Fig. 2.
The role of miR-101 in regulating cell proliferation, invasion and tumor growth. (A) miR-101 overexpression reduces cell proliferation. Cell growth assay of SKBr3 cells treated with either precursor miR-101 or siRNA targeting EZH2. Cell growth relative to the control miRNA and control siRNA duplex was measured. Rescue experiments were performed by overexpressing EZH2 (minus its endogenous 3’UTR) in miR-101-treated cells. (B) miR-101 expression decreases cell invasion of DU145 prostate carcinoma cells. Cells were transfected with miR-101, EZH2 specific siRNA, control miR and non-targeting siRNA. miR-101 was also overexpressed in those cells overexpressing EZH2 by andenoviral infection. All cells were subjected to a matrigel invasion assay. (C) AntagomiRs to miR-101 induce the invasiveness of benign immortalized H16N2 breast epithelial cells. Representative fields of invaded and stained cells are shown in the inset. P-values were calculated between control antagomiR and antagomiR-101i and ii. (D) Overexpression of miR-101 attenuates prostate tumor growth. Overexpression of miR-101 reduces DU145 tumor growth in a mouse xenograft model. Plot of mean tumor volume trajectories over time for the mice inoculated with miR-101 (red) and vector (green) expressing DU145 cells. Error bars represent the standard error of the mean at each time point. Inset displays decrease of EZH2 protein levels in miR-101 expressing cell lines.
Previously, we showed that upon overexpression, EZH2 can induce cell invasion in matrigel-coated basement membrane invasion assays (12). Here we show that miR-101 overexpression markedly inhibits the in vitro invasive potential of DU145 prostate cancer cells (Fig. 2B) and SKBr3 breast cancer cells (fig. S5). Similarly, stable expression of miR-101 in DU145 cells showed reduction in EZH2 expression and reduced invasion (fig. S6A, B). Overexpression of EZH2, rescued the inhibition mediated by miR-101. Another in vitro readout for cancer potential, increased cell migration, was also inhibited by miR-101 (fig. S7). As overexpression of miR-101 attenuates cancer invasion, inhibition of miR-101 should enhance this neoplastic phenotype. Two independent antagomiRs targeting miR-101 (i and ii) induced an invasive phenotype when transfected into benign immortalized breast epithelial cell lines H16N2 or HME (Fig. 2C, fig. S8).
To assess whether miR-101 inhibits anchorage-independent growth, we employed a soft agar assay. DU145 prostate cancer cells stably overexpressing miR-101 exhibited markedly reduced colony formation relative to the parental cells or vector controls (fig. S9). Furthermore, in vivo, DU145 cells expressing miR-101 grew significantly slower than the vector control xenografts (p= 0.0001, Fig. 2D) demonstrating that miR-101 has properties consistent with that of a tumor suppressor in these particular assays.
As EZH2 and PRC2 are known to regulate gene expression by tri-methylating H3K27, we hypothesized that miR-101 overexpression would result in decreased overall H3K27 tri-methylation in cancer cells. SKBr3 breast cancer and DU145 prostate cancer cells transfected with miR-101 or EZH2 siRNA for 7 days displayed global decrease in tri-methyl H3K27 levels (fig. S10A). The effect of miR-101 on H3K27 methylation can be negated by overexpression of EZH2 (fig. S10B).
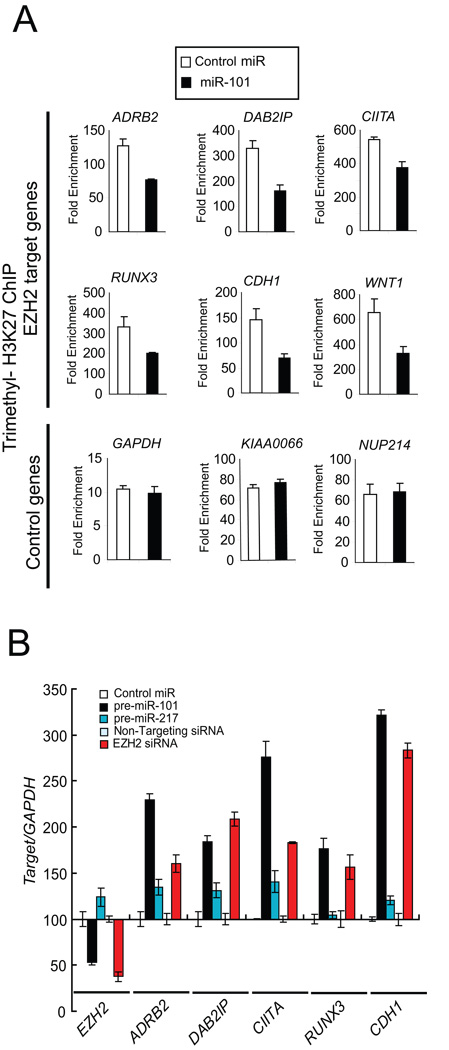
In order to test the level of promoter occupancy of the H3K27 histone mark, we performed chromatin immunoprecipitation (ChIP) assays in cancer cells overexpressing miR-101. We found significant reduction in the tri-methyl H3K27 histone mark at the promoter of known PRC2 target genes such as ADRB2, DAB2IP, CIITA and WNT1 in miR-101 overexpressing SKBr3 cells and EZH2 siRNA treated cells (Fig. 3A, fig. S11). In order to test if the reduced promoter occupancy by H3K27 results in concomitant reduction of gene expression, we performed qRT-PCR on the PRC2 targets tested by ChIP assay. As expected, there was a significant increase in target gene expression in both miR-101 and EZH2 siRNA treated cells (Fig. 3B). To further explore miR-101 regulation of EZH2 and test similarities with EZH2 specific RNA interference, we tested whether miR-101 overexpression and EZH2 knockdown generated similar gene expression profiles. To assess this, we conducted gene expression array analysis of SKBr3 cells transfected with either miR-101 or EZH2 siRNA duplexes. Genes that were overexpressed at the 2-fold threshold were significantly overlapping in both the miR-101 and EZH2 siRNA transfected cells (p= 6.08e-17) (fig. S12). Similarly, those genes that were repressed also had significant overlap (p= 3.24e-27).
Fig. 3.
miR-101 regulation of the cancer epigenome through EZH2 and H3K27 tri-methylation. (A) Chromatin immunoprecipitation (ChIP) assay of the trimethyl H3K27 histone mark when miR-101 is overexpressed. Known PRC2 repression targets were examined in SKBr3 cells. ChIP was performed to test H3K27 trimethylation at the promoters of ADRB2, DAB2IP, CIITA, RUNX3, CDH1 and WNT1. GAPDH, KIAA0066 and NUP214 gene promoters served as controls. (B) qRT-PCR of EZH2 target genes was performed using SKBr3 cells transfected with miR-101. The EZH2 transcript and its known targets including ADRB2, DAB2IP, CIITA, RUNX3 and E-cadherin (CDH1) were measured.
Next, we wanted to determine whether miR-101 expression inversely correlates with EZH2 levels in human tumors. A meta-analysis of a majority of the publicly available miRNA expression datasets suggested that miR-101 is significantly under-expressed in prostate, breast, ovarian, lung and colon cancers (table S3). As EZH2 was initially found to be overexpressed in a subset of aggressive clinically localized prostate cancers and almost universally elevated in metastatic disease(4), we proceeded to examine miR-101 in a similar context of prostate cancer progression by doing qPCR analysis (Fig. 4A, fig. S13). As expected, metastatic prostate cancers expressed significantly higher levels of EZH2 as compared to clinically localized disease or benign adjacent prostate tissue (p<0.0001). Consistent with a functional connection between miR-101 and EZH2, miR-101 expression was significantly decreased in metastatic prostate cancer relative to clinically localized disease or benign adjacent prostate tissue (p<0.0001). Importantly, miR-217, which like miR-101 was predicted to regulate EZH2, did not exhibit significant differences between metastatic disease and clinically localized prostate cancer or benign prostate (p=0.35 and 0.13, respectively).
To investigate the mechanism for miR-101 transcript loss in prostate cancer progression, we performed quantitative genomic PCR for miR-101. Of note, miR-101 has two genomic loci that are on chromosome 1 (miR-101-1) and chromosome 9 (miR-101-2) (fig. S14A, B). Based on genomic PCR, 2 of 16 clinically localized prostate cancers and 17 of 33 metastatic prostate cancers exhibited loss of the miR-101-1 locus (Fig. 4B). Similarly, 4 of 16 clinically localized prostate cancers and 8 of 33 metastatic prostate cancers displayed loss of miR-101-2 (Fig. 4B). Fig. 4C displays a heatmap representation of matched samples in which miR-101 transcript, EZH2 transcript, miR-101-1 genomic loci and miR-101-2 genomic loci were monitored. EZH2 transcript levels were inversely associated with miR-101 transcript levels across prostate cancer progression to metastasis (p<0.0001). EZH2 tended to be uniformly elevated in samples in which the miR-101-1 or miR-101-2 genomic loci exhibited copy number loss (p=0.004, permutation test).
To formally demonstrate that genomic loss of miR-101 loci was somatic in nature, we identified 9 metastatic prostate cancers which exhibited loss of miR-101-1 and obtained DNA from matched normal tissue. As expected, 8 of 9 cases exhibited a marked decrease in relative levels of miR-101-1 copy number in the cancer when compared to matched normal tissue (Fig. 4D). To extend our findings to other cancers we explored miR-101 genomic loss in a variety of tumor types. Using a number of experimental platforms we demonstrated focal loss (~ 20kB) of miR-101-1 in a subset of breast, gastric and prostate cancers (fig. S15–S17). Furthermore, we explored public domain high–density array CGH and SNP array datasets and observed genomic loss of one or both miR-101 loci in a subset of gliobastoma multiforme, lung adenocarcinoma, and acute lymphocytic leukemia (supplementary text, fig. S18).
miR-101, by virtue of its regulation of EZH2, may have profound control over the epigenetic pathways active not only in cancer cells, but in normal pluripotent embryonic stem cells. Overexpression of miR-101 presumably can configure the histone code of cancer cells to more of a benign phenotype. As the loss of miR-101 and concomitant elevation of EZH2 is most pronounced in metastatic cancer, we postulate that miR-101 loss may represent a progressive molecular lesion in the development of more aggressive disease. Approaches to re-introduce miR-101 into tumors may have therapeutic benefit by reverting the epigenetic program of tumor cells to a more normal state.
Supplementary Material
Supporting Online Material, www.sciencemag.org, Materials and Methods, Supplementary Results and Discussion, Figs. S1 to S18, Table S1 to S10
References and Notes
- 1.Boyer LA, et al. Nature. 2006 May 18;441:349. [Google Scholar]
- 2.Lee TI, et al. Cell. 2006 Apr 21;125:301. doi: 10.1016/j.cell.2006.02.043. [DOI] [PMC free article] [PubMed] [Google Scholar]
- 3.Sher F, et al. Stem Cells. 2008 Aug 7; [Google Scholar]
- 4.Varambally S, et al. Nature. 2002;419:624. doi: 10.1038/nature01075. [DOI] [PubMed] [Google Scholar]
- 5.Bracken AP, et al. EMBO J. 2003 Oct 15;22:5323. doi: 10.1093/emboj/cdg542. [DOI] [PMC free article] [PubMed] [Google Scholar]
- 6.Erhardt S, et al. Development. 2003 Sep;130:4235. doi: 10.1242/dev.00625. [DOI] [PubMed] [Google Scholar]
- 7.Plath K, et al. Science. 2003 Apr 4;300:131. doi: 10.1126/science.1084274. [DOI] [PubMed] [Google Scholar]
- 8.Cao R, et al. Science. 2002;298:1039. doi: 10.1126/science.1076997. [DOI] [PubMed] [Google Scholar]
- 9.Kuzmichev A, Nishioka K, Erdjument-Bromage H, Tempst P, Reinberg D. Genes Dev. 2002 Nov 15;16:2893. doi: 10.1101/gad.1035902. [DOI] [PMC free article] [PubMed] [Google Scholar]
- 10.Yu J, et al. Cancer Cell. 2007 Nov;12:419. doi: 10.1016/j.ccr.2007.10.016. [DOI] [PubMed] [Google Scholar]
- 11.Cao Q, et al. Oncogene. 2008 [Google Scholar]
- 12.Kleer CG, et al. Proc Natl Acad Sci U S A. 2003 Sep 30;100:11606. doi: 10.1073/pnas.1933744100. [DOI] [PMC free article] [PubMed] [Google Scholar]
- 13.Croonquist PA, Van Ness B. Oncogene. 2005 Sep 15;24:6269. doi: 10.1038/sj.onc.1208771. [DOI] [PubMed] [Google Scholar]
- 14.Takeshita F, et al. Proc Natl Acad Sci U S A. 2005 Aug 23;102:12177. doi: 10.1073/pnas.0501753102. [DOI] [PMC free article] [PubMed] [Google Scholar]
- 15.Bachmann IM, et al. J Clin Oncol. 2006 Jan 10;24:268. doi: 10.1200/JCO.2005.01.5180. [DOI] [PubMed] [Google Scholar]
- 16.Weikert S, et al. Int J Mol Med. 2005 Aug;16:349. [PubMed] [Google Scholar]
- 17.Matsukawa Y, et al. Cancer Sci. 2006 Jun;97:484. doi: 10.1111/j.1349-7006.2006.00203.x. [DOI] [PMC free article] [PubMed] [Google Scholar]
- 18.Lewis BP, Burge CB, Bartel DP. Cell. 2005 Jan 14;120:15. doi: 10.1016/j.cell.2004.12.035. [DOI] [PubMed] [Google Scholar]
- 19.Marson A, et al. Cell. 2008 Aug 8;134:521. doi: 10.1016/j.cell.2008.07.020. [DOI] [PMC free article] [PubMed] [Google Scholar]
- 20.Sethupathy P, Megraw M, Hatzigeorgiou AG. Nat Methods. 2006 Nov;3:881. doi: 10.1038/nmeth954. [DOI] [PubMed] [Google Scholar]
- 21.Krek A, et al. Nat Genet. 2005 May;37:495. doi: 10.1038/ng1536. [DOI] [PubMed] [Google Scholar]
- 22.Lewis BP, Shih IH, Jones-Rhoades MW, Bartel DP, Burge CB. Cell. 2003 Dec 26;115:787. doi: 10.1016/s0092-8674(03)01018-3. [DOI] [PubMed] [Google Scholar]
- 23.John B, et al. PLoS Biol. 2004 Nov;2:e363. doi: 10.1371/journal.pbio.0020363. [DOI] [PMC free article] [PubMed] [Google Scholar]
- 24.Rusinov V, Baev V, Minkov IN, Tabler M. Nucleic Acids Res. 2005 Jul 1;33:W696. doi: 10.1093/nar/gki364. [DOI] [PMC free article] [PubMed] [Google Scholar]
- 25.Materials and Methods are available on Science Online.
- 26.Pasini D, Bracken AP, Jensen MR, Lazzerini Denchi E, Helin K. Embo J. 2004 Oct 13;23:4061. doi: 10.1038/sj.emboj.7600402. [DOI] [PMC free article] [PubMed] [Google Scholar]
- 27.Fiskus W, et al. Mol Cancer Ther. 2006 Dec;5:3096. doi: 10.1158/1535-7163.MCT-06-0418. [DOI] [PubMed] [Google Scholar]
- 28.Krutzfeldt J, et al. Nature. 2005 Dec 1;438:685. doi: 10.1038/nature04303. [DOI] [PubMed] [Google Scholar]
- 29.We thank Saravana M. Dhanasekaran, Scott Tomlins and Jianjun Yu for helpful discussions and Javed Siddiqui and Mithil Pandhi for technical assistance. We thank Jill Granger and Karen Giles for critically reading the manuscript. A.M.C. is supported by a Burroughs Welcome Foundation Award in Clinical Translational Research. This work was supported in part by the National Institutes of Health (Prostate SPORE P50CA69568 to A.M.C., and the Early Detection Research Network (UO1 111275 to A.M.C.)) and the Department of Defense (Era of Hope Scholar BC075023 to A.M.C., PC051081 to A.M.C. and S.V., BC083217 to J.C.B.). C.A.M. was supported by an NIH post-doctoral training grant and currently derives support from the American Association of Cancer Research Amgen Fellowship in Clinical/Translational Research and the Canary Foundation and American Cancer Society Early Detection Postdoctoral Fellowship. The microarray data used in this study have been deposited in the NCBI Gene Expression Omnibus (GEO) with the accession number GSE13286.
Associated Data
This section collects any data citations, data availability statements, or supplementary materials included in this article.
Supplementary Materials
Supporting Online Material, www.sciencemag.org, Materials and Methods, Supplementary Results and Discussion, Figs. S1 to S18, Table S1 to S10


