

Abstract
Affinity purified Shiga toxin 2 (Stx2) i.p. to mice caused weight loss and hind limb paralysis followed by death. Globotriaosylceramide (Gb3), the receptor for Stx2, was localized to neurons of the central nervous system (CNS) of normal mice. Gb3 was not found in astrocytes nor endothelial cells of the CNS. In human cadaver CNS, we found Gb3 in neurons and endothelial cells. Mouse Gb3 localization was confirmed by immuno-electron microscopy (EM). In Stx2 exposed mice, anti-Stx2-gold immunoreaction was positive in neurons. During paralysis, following Stx2 injection, multiple glial nuclei were observed by EM surrounding motoneurons. Also revealed was a lamellipodia-like process physically inhibiting the synaptic connection of motoneurons. Ca2+ imaging of cerebral astrocytic endfeet in Stx2 treated mouse brains suggested the toxin increased neurotransmitter release from neurons. In this report, we propose that the neuron is a primary target of Stx2, affecting neuronal function which leads to paralysis.
Keywords: Keywords: Shiga toxin, Shiga toxin producing Escherichia coli, Paralysis, Ca2+ imaging, lamellipodia-like process, Neurotoxin
Introduction
Shiga toxin-producing Escherichia coli (STEC) infection causes neurological disorders in addition to bloody diarrhea and hemolytic uremic syndrome (HUS). Approximately, 30% of HUS patients suffer from CNS complications [1-13]. Shiga toxin (Stx) is thought to play a main role in STEC infectious disease with Stx2 more commonly associated with severe symptoms [4, 14-16]. Stx1 and Stx2 are AB5 toxins comprised of an enzymatic A subunit and five receptor binding B subunits. The B subunits bind to the glycolipid receptor, globotriaosylceramide (Gb3), where the holotoxin is internalized into cells by endocytosis [17, 18]. The holotoxin is then transferred to the endoplasmic reticulum (ER) by retrograde transport [19], then the A subunit depurinates adenine 4324 of the 28S ribosomal RNA in the cytoplasm, and stops protein synthesis [20].
Gb3 expressing cells are recognized as targets of the Stxs. Gb3 addition to Gb3 null cells makes them susceptible to the Stxs [21], indicating that Gb3 expression and susceptibility to Stxs are related. For example, it has been shown that primary human renal microvascular endothelial cells are susceptible to Stx [22, 23], and their susceptibility generally correlates with the amount of Gb3 [22]. It was also shown that primary human cerebral microvascular endothelial cells became susceptible to Stxs upon TNF-α induced expression of Gb3[24]. In the present study, we report the localization of Gb3 on neurons within the mouse central nervous system (CNS) by a free-floating immunofluorescence method. Furthermore, we demonstrate the co-localization of Gb3 and Stx2 by ultracryo-immunogold labeling of the motoneurons in the ventral horn of the spinal cord from Stx2 injected animals.
Neuron-glia interaction in the nervous system is important to maintain neuronal functions. Disruption of the neuron-glia interaction has been shown in many experimental animal injury models. The peripheral nerve axotomy is a tool for observing microglial activation induced by neuronal alteration in the CNS. It has been shown that after incision of facial nerve or sciatic nerve, detachment of presynapse from motoneuronal soma occurs. This detachment is thought to make it easier for surrounding glial cells to ensheath their foot processes between the synaptic cleft which inhibits synaptic connection. Microglial foot processes [25, 26] as well as astrocytic processes [26] are found at these sites. Other experimental procedure as Botulinum toxin (BoNT) type A injection to peripheral nerve [27] and BCG injection to intracortical region along with peripheral challenge [28], can cause ensheathment of lamellipodia-like processes as well. In these reports, astrocytic processes and microglial processes are observed by BoNT treatment and BCG treatment, respectively. In this article, we demonstrate for the first time that Stx2 induces a glial lamellipodia-like process between presynapse and motoneuronal soma.
Functional studies of neuronal reaction to Stx2 have not been reported. However, recording of Ca2+ transients in cerebral astrocytes makes it possible to determine if the toxin alters neuronal function. Using fluorescent Ca2+ indicators, Ca2+ transients in astrocytes and astrocytic endfeet have been reported to reflect mostly glutamate release from neuronal pre-synaptic endings in live brain slices [29, 30]. Electric stimuli to the brain slice specifically excite neurons and excited neurons release glutamate from their pre-synaptic endings. Astrocytic processes surrounding synapses accept glutamate by their metabotropic glutamate receptor which then signals to the ER to release stored Ca2+ into the cytoplasm. Thus, Ca2+ transients in cerebral astrocytes after electric stimuli reflect neuronal pre-synaptic glutamate release. Using this in vitro assay system, we report for the first time that neuronal function is changed by Stx2 treatment of live brain slices.
Materials and Methods
Animals
Specific pathogen free, C57BL/6 male and female mice (19-22g) were purchased from Charles River (Wilmington, MA). Mice were given food and water ad libitum. All procedures were approved by the University of Virginia Animal Care Committee. All experiments were conducted with male mice except three female mice, which were included in the Ca2+ imaging assay.
Human CNS tissue
The use of cadaver tissue in this study is without personal identifiers and is considered exempt by the human investigation guidelines of the University of Virginia.
Toxin purification
Stx2 protein was purified from E. coli DH5α/pJES120, which produces Stx2 [31], by antibody affinity chromatography using anti-Stx2 MAb (11E10) and by lipopolysaccharide (LPS) removal (Detoxi-Gel 20344, Pierce Chem. Co. Rockford, IL) as described previously [32]. Endotoxin content was below detection as measured by the Limulus Amebocyte Lysate assay. The Stx2 preparation was characterized as pure by SDS-PAGE with Coomassie brilliant blue stain, and cytotoxic potency in Vero cells.
Gold labeling of Ab
Anti-rat IgM (goat IgG) Ab (A104UN, American Qualex, San Clemente, CA) was labeled with 5 nm gold colloid (RDI-EMGC5, RDI Division of Fitzgerald Industries Intl, Flanders, NJ) according to manufacturer's protocol. Immunoreactivity of the antibody-gold conjugate against rat IgM was measured by western blotting before use in electron microscopy.
Exposure of mice to Stx2
Purified Stx2 was diluted in pyrogen free saline and injected intraperitoneally at a dose between 50 ng and 0.5 ng/20 g body weight (b.w.). Animal behavior and onset of symptoms was monitored every 4hrs and weight of the mice was measured every 24hrs.
Histopathological analysis
Mice were euthanized by i.p. injection of pentobarbital, then, spinal cord, brain and dorsal root ganglions (DRGs) were dissected, immersed in 4% paraformaldehyde in 0.1 M phosphate buffered saline (PFA/PBS) overnight and processed for light microscopy. After embedding in paraffin, 5 μm-thick sections were cut, mounted on a glass slide and stained by H&E or by cresyl violet for Nissl's stain.
Preparation of free-floating sections and Immunofluorescence
Mice were euthanized as described above and perfused from left cardiac ventricle by saline followed by 4% PFA/PBS. Tissues were then dissected and immersed in 4% PFA/PBS for 3hrs at 4°C with gentle agitation. All incubation processes were performed at 4°C with gentle agitation unless stated. After washing in PBS, fixed tissues were trimmed into pieces and incubated in 30% phosphate-buffered sucrose (30% sucrose/PBS) overnight. Fifty μm-thick sections were cut with a freezing microtome. Sections were collected in 30% sucrose/PBS and stored at -80°C until use. For immunoreaction, antibodies were used as listed in table 1. For blocking of anti-Gb3 Ab or its isotype control rat IgM, a blocking solution containing a goat anti-rat IgM Ab (1:50) (F104UN, American Qualex) was used, and for other immunoreactions, secondary Ab matched normal sera (1:20) were used, and slices were incubated in U-shaped 96-well plates for 1hr. After blocking, slices were incubated with primary Ab for 2hrs except anti-Gb3/CD77 that was incubated overnight. After washing with PBS for 1hr, fluorescence conjugated secondary Abs were applied except for anti-GFAP-Cy3, and incubated for 2hrs. DAPI (D21490, Molecular Probes) was employed as a nuclear stain. After staining, slices were mounted on glass slides with GEL/MOUNT mounting media (biomeda, Foster City, CA). The images were visualized and analyzed with a Zeiss LSM 510 (Carl Zeiss, Germany).
Table 1.
Antibodies used in this study
| primary Ab | subtype | dilution | catalog# | clone# | source |
|---|---|---|---|---|---|
| anti-Gb3/CD77 | rat IgM | 1:100 | IM0175 | 38.13 | Beckman Coulter |
| anti-NeuN | mouse IgG1 | 1:1000 | MAB377 | A60 | Millipore/Chemicon International, Inc. |
| anti-GFAP-Cy3a | mouse IgG1 | 1:1000 | C9205 | G-A-5 | Sigma-Aldrich |
| anti-mouseCD31 | rat IgG2a | 1:50 | 550274 | MEC13.3 | BD |
| anti-humanCD31 | mouse IgG1 | 1:20 | CBL468 | HC1/6 | Millipore/Chemicon International, Inc. |
| anti-Stx2 | rabbit poly | 1:200 | n.a. | n.a. | a gift from Dr. Fujii (Kyushu Univ. Japan) |
| secondary Ab | probe | dilution | catalog# | source | |
| anti-rat IgMb | Alexa Fluor 488 | 1:2000 | A-21212 | Invitrogen/Molecular Probe | |
| anti-mouse IgGc | Alexa Fluor 546 | 1:2000 | A-11060 | Invitrogen/Molecular Probe | |
| anti-rat IgGd | Alexa Fluor 647 | 1:2000 | A-21247 | Invitrogen/Molecular Probe | |
| anti-rat IgMe | Alexa Fluor 647 | 1:2000 | A-21248 | Invitrogen/Molecular Probe | |
| anti-mouse IgGf | Alexa Fluor 350 | 1:2000 | A-21049 | Invitrogen/Molecular Probe | |
| anti-rat IgM | 5-nm gold | 1:100 | n.a. | this study, see Material and Methods | |
| anti-rabbit IgG | 10-nm gold | 1:100 | RPN421 | GE Healthcare/Amersham Biosciences | |
Cy3 conjugated primary Ab
for Gb3 in mouse CNS
for NeuN
for mouse CD31
for Gb3 in human CNS
for CD31 and NeuN in human CNS
For human tissue preparation, postmortem brain was fixed in 20% formalin for 2 weeks, and processed for free-floating preparation as mouse tissue except with anti-human CD31 antibody. Secondary Abs were chosen to avoid autofluorescence of lipofuscin in human neurons (Table 1).
Immunoelectron microscopy
For ultracryo-immunogold labeling, animals were euthanized and perfused as described above using the same fixative as in free-floating procedure. The cryoprotection, rapid freezing and ultracryotomy of the CNS tissue were performed following the method of Tokuyasu [33] with modification of Akagi et al [34]. The immunogold labeling also followed the method of Akagi et al [34] except for antibodies. After blocking with goat anti-rat IgM antibody (1:50)(F104UN) or 10% normal goat serum, the sections were incubated in TBS containing antibody against Gb3/CD77and/or rabbit anti-Stx2 polyclonal IgG for 24 to 48 h at 4°C and then washed with TBS and incubated with gold particle-conjugated secondary Abs for 2 h at R.T. Thereafter, the sections were rinsed and embedded with a mixture of 1% polyvinyl alcohol containing 0.1% uranyl acetate, dried and observed with an electron microscope (H-7100 or H-7650, Hitachi, Tokyo Japan).
Electron Microscopic Analysis to detect Stx2 lesion in CNS
Animals were perfused intracardially through the left ventricle with a fixative consisting 2.5% GA and 2.0% PA in 0.1 M PB, pH 7.4. Spinal cords were dissected and immersed in the same fixative overnight at 4°C. After osmification in a 1% osmium tetroxide solution, the specimens were dehydrated through a graded alcohol series and embedded in Epon 812 (TAAB Laboratories, Berks, UK). Semi-thin sections were stained with 0.5% toluidine blue in 10 mM PBS, pH 7.4. Ultrathin sections were cut in an Ultracut microtome (Reichert, NY) and stained with uranyl acetate and lead citrate. The sections were observed under a transmission electron microscope (Hitachi H-7100, H-7650, Japan).
Brain slice preparation for Ca2+ imaging
Brain slices were prepared from mice as described previously [29] with minor modifications. The composition of ice-cold artificial Cerebro-Spinal Fluid (aCSF) buffer was (in mM) 3 KCl, 125 NaCl, 1.0 MgCl2, 26 NaHCO3, 1.25 NaH2PO4, 10 glucose, 2.0 CaCl2, and 400 μM L-ascorbic acid, equilibrated with 95% O2 / 5% CO2. Brain slices were divided in two groups, with one treated with Stx2 in aCSF and the other with aCSF alone (control) for 30 min at 37°C. Slices were transferred to 10 μM Fluo-4 AM with 0.05% pluronic acid in aCSF solution, and incubated for 90 min at R.T. in the dark. For some experiments, Stx2 incubation was performed 1) at R.T. for 60 min prior to Fluo-4 AM incubation or 2) together with Fluo-4 AM at R.T. for 90 min. Using this loading protocol, Ca2+ transients in astrocytes were visualized. Under these conditions, neurons do not load Fluo-4AM sufficiently [35, 36].
Ca2+ imaging
Ca2+ imaging was performed according to Filosa et al [29] with minor modification. Parenchymal microvessels were visualized with a X60 water-immersion objective (NA 1.0). Electrical field stimulation (EFS) was induced with a pair of platinum wires placed parallel to the brain slice (50 Hz; 0.3-millisecond pulses for 5 to 8 seconds). Fluorescence images were obtained using a krypton/argon laser at 488 nm and emitted light at >495 nm. Images were acquired at 15 frames per second for 60 seconds.
Ca2+ data analysis
Ca2+ image experiments were analyzed with QED InVivo software (Media Cybernetics, Inc.). Fractional fluorescence (F/F0) was determined by dividing the fluorescence intensity (F) within a region of interest (ROI) by a baseline fluorescence value (F0) determined from 50 images showing no activity.
Statistics
Data was expressed as mean +/- SEM. Differences between two means were determined using two-tailed Student t test. Statistical significance was tested at 95% (p<0.05) and 90% (p<0.1) confidence level.
Results
Weight loss, viability and neurological symptoms
Mice lost weight after Stx2 administration i.p., in a dose dependent manner. In Fig.1A, weight loss representative of several experiments is shown in which the animals received Stx2 at 50ng (N=5), 10ng (N=4), 5ng (N=4), 1ng (N=4), 0.5ng (N=4) per 20 g b.w. or saline control (N=5). Stx2 lethality was also dose dependent as shown in Fig.1B for the 50ng (N=38), 10ng (N=14), 5ng (N=9), 1ng (N=9), 0.5ng (N=4) per 20 g b.w. and saline control (N=34) groups.
Figure 1.
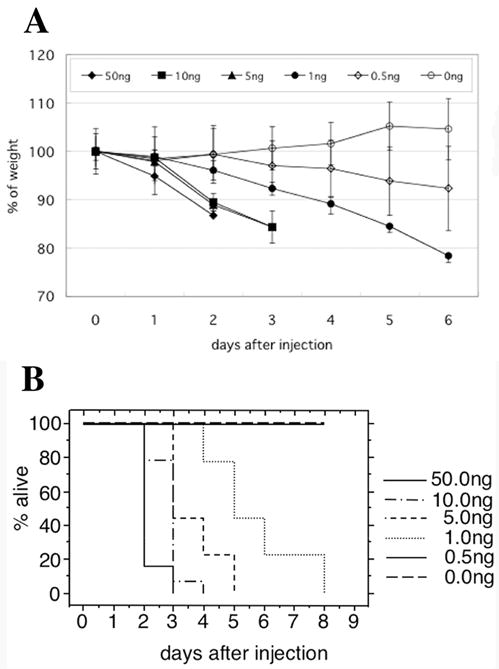
Stx2 Dose-dependent weight loss and viability of mice. C57BL/6 mice were injected i.p. with different doses of toxin (ng/20g b.w.), then weight (A) and viability (B) were monitored. (A) Weight loss was toxin dose-dependent, whereas saline control animals gained weight. (B) Toxin-injected mice (doses from 50 to 1ng) died, and time to death was toxin dose-dependent.
Onset of neurological abnormalities, observed at several hours before death, included lethargy, shivering followed by abnormal gait, and hind limb paralysis. Approximately 80% of mice exhibited spasm like seizures that appeared suddenly and spontaneously during which their hind limbs straightened and stiffened, and prevented an upright body position. Mice injected with 1ng or more Stx2 developed hind limb paralysis and exhibited unilateral body mobility. Throughout these symptoms, the mice retained sensory neuron function in response testing.
Localization of Gb3 in mouse nervous systems by immunofluorescence
We examined the olfactory bulb, cerebrum including the cortex and hippocampus, cerebellum, brain stem, spinal cord and dorsal root ganglions (DRGs) from normal mice. In all CNS and peripheral nervous system (PNS) tissues examined, different types of neurons were positive by anti-Gb3 immunoreaction (Fig.2). This was confirmed by double staining with the neuronal marker NeuN (Fig.2B). Spinal cord neurons including motoneurons in the ventral horn (Fig.2), other neurons such as mitral cells, periglomerular cells in the olfactory bulb, cortex neurons including motor cortex, CA1, CA2-3 pyramidal cells and dentate gyrus cells in the hippocampus, and Purkinje cells and granule cells in the cerebellum were also positive by anti-Gb3 immunoreaction (data not shown). It was revealed that anti-CD31 positive endothelial cells (Fig.2D) in the mouse nervous system were Gb3 negative. From 4 normal mice, total of 24 images of CD31/Gb3/GFAP/DAPI stain were acquired. All images showed that CD31(+) cells were Gb3(-). In addition, GFAP positive astrocytes in the spinal cord (Fig.2A and 2D) and in other parts of the CNS were Gb3 negative. Isotype immunoglobulin controls were all negative (Fig.2C).
Figure 2.

Neurons but not endothelial cells in mouse spinal cord are Gb3 positive. Free floating spinal cord sections from normal mice are stained by (A) anti-Gb3-FITC (green), anti-GFAP-Cy3 (red) and DAPI (blue, nuclei). Arrows demonstrate examples of Gb3 positive cells. GFAP positive astrocytes are not positive for Gb3. Examples of a GFAP positive astrocyte and a Gb3 positive cell are emphasized in inserts. In (B), sections are stained by anti-Gb3-FITC and anti-NeuN-AlexaFluor 546 (red). All Gb3 positive cells are double positive for neuron specific NeuN (arrows; examples of Gb3+/NeuN+ cells). The insert is an example of a Gb3 and NeuN positive neuron (yellow). (C) Isotype control stain of spinal cord appears negative. In (D), sections are stained by anti-Gb3-FITC (green), anti-CD31-AlexaFluor 647 (blue) and anti-GFAP-Cy3 (red). CD31 positive endothelial cells are not positive for Gb3 (arrowheads). Bars indicate 100μm for lower magnification and 10μm for higher magnification (inserts).
Localization of Gb3 in human CNS by immunofluorescence
Anti-Gb3 staining of normal human CNS tissue revealed that neurons as well as the luminal side of vascular endothelial cells were positive Gb3 (Fig.3). In patients of E. coli O157:H7 disease, endothelial cell damage in the brain is often reported as edema, infiltration of leukocytes and infarct [37, 38], all of which are not observed in the Stx2 injected mouse model. Expression of the receptor Gb3 in human brain endothelial cells might explain why human pathology differs from that of the mouse. Taken together, the data suggest that the Stx2 injected mouse model is useful to analyze a putative effect of Stx2 on neurons in the CNS.
Figure 3.

Localization of Gb3 in human CNS. Normal human motor cortex is used to determine Gb3 localization. (A-C) Anti-Gb3 stain is in green with DAPI-stained nuclei in blue. Gb3 is localized to the cytoplasmic area of cells with large nuclei (arrows) and to loop-like structures (arrow heads). Cells with small nuclei do not express Gb3 (*). (D-F) Anti-Gb3 (green) localizes to the luminal side (arrow head) of vessel/endothelial cells (CD31/red). A couple of Gb3/Pk antigen positive red blood cells are seen inside of the vessel. (G-I) Gb3 (green) positive cells are also positive for neuron specific NeuN (red) (arrows). Bars indicate 10 μm.
Localization of Gb3 and detection of anti-Stx2 immunogold by immunoelectron microscopy
In spinal cords of normal mice, anti-Gb3 immunogold labeling (5 nm) was found in the endoplasmic reticulum (Fig.4b), the plasma membrane surface, the Golgi apparatus, and vesicles in motoneurons. In other cell types including endothelial cells and glial cells, Gb3 was not detected. In Stx2 exposed mice, anti-Stx2 immunogold (10 nm) was found in the same cellular structures as anti-Gb3 immunogold including the plasma membrane surface, vesicles, ER and the Golgi apparatus of motoneurons (Fig.4c and d). In Fig.4d, examples of double positive anti-Stx2 immunogold and anti-Gb3 immunogold stains are shown in the Golgi apparatus of the motoneuron. Negative controls, in which samples were treated with isotype primary antibodies or were processed in the absence of primary antibodies, showed no signal either in normal, saline injected or Stx2 injected mouse spinal cords (data not shown).
Figure 4.

Immunoelectron microscopy for localization of Gb3 and Stx2 in motoneuron. (a), (c) and (d) are from a 50ng Stx2/20g b.w. i.p. injected mouse lumbar spinal cord. (a) and (d) are double stained by anti-Gb3 immunogold (5 nm) and anti-Stx2 immunogold (10 nm), whereas (c) is single stained by anti-Gb3 imuunogold (5 nm). (b) is prepared from a normal mouse lumbar spinal cord, and single stained by anti-Gb3 immunogold (5 nm).
In (a), an endothelial cell (E), an astrocyte endfoot (As) and a myelin fiber (mf) in Stx2 injected (2hrs) mouse spinal cord are negative for both anti-Gb3 and anti-Stx2 stain. Note that mf appears white because of omitted osmication in this procedure. In (b) and (c), anti-Gb3 stains are shown in 5 nm gold dots (black arrows). Gb3 localization is observed at endoplasmic reticulum (Er) of motoneurons in normal mouse spinal cord (b), and at the surface of plasma membrane (open arrow head in insert of (c)) as well as inside of motoneuron (MN) in Stx2 injected (2hrs) animal (c). An astrocyte (As) in (c) remains negative. White part in (c) is an exfoliation artifact between the MN and As in this procedure. In (d), double stain of anti-Stx2 (10nm gold, white arrows) and anti-Gb3 (5 nm gold, black arrows) are shown positive at Golgi apparatus (G) of MN in Stx2 injected (2hrs) animal. Upper left in (d) is cis-side and lower right is trans-side. Note that anti-Stx2 stains in normal and saline mice are negative, and isotype control stain in all the samples are negative (data not shown). Black bars indicate 250 nm, whereas white bars indicate 100 nm.
Histopathological analysis
From cervical to lumbar regions of the spinal cord of moribund mice, no morphological abnormality was detected by hematoxylin and eosin (H&E) staining or Nissl's staining compared to normal or saline controls (data not shown). There was no cell infiltration, fibrin thrombi or degeneration of neurons. Abnormalities were also absent in other nervous system tissues such as the cerebrum, cerebellum and DRG (data not shown).
EM findings of Stx2 induced paralyzed mouse lumbar spinal cord
Approximately 60hrs after injection of 4ng/20g b.w. purified Stx2, mice developed hindlimb paralysis. At this time point, during hindlimb paralysis, the lumbar spinal cord was sampled and prepared for EM analysis. We found that 1) multiple glial nuclei surrounded the lumbar motoneuron of the Stx2 injected mouse (Fig.5A), but not in the saline control mouse (Fig.5B), and 2) a layer of lamellipodia-like process was seen between the pre-synaptic membrane (inter-neuronal) and the post-synaptic membrane (Fig.5E and F). The extra membrane seems to be blocking the synaptic connection physically, whereas in the saline control (Fig.5G and H), the pre-synaptic membrane and the post-synaptic membrane exhibited a normal appearance. Among 196 motoneurons form 7 mice of Stx2 paralyzed and 128 motoneurons from 4 saline control mice, 3 or more glial cells attached to neurons are significantly increased in Stx2 mice (p<0.1, t-test, two-tailed analysis), whereas neurons without glial cells attached was significantly greater in saline control (p<0.05, t-test, two-tailed analysis). Considering the fact that multiple glial cells are seen around the Stx2 mouse's motoneuron, it is likely that the lamellipodia-like process is from the neighboring glias.
Figure 5.

Stx2 induced alteration observed by Electron microscopy. The spinal cords from 4ng Stx2/20g b.w. injected and hindlimb paralyzed mice are prepared for EM analysis. A motoneuron surrounded by three glial cells is shown in (A), (C), (E) and (F). The control saline injected mouse lumbar spinal cord is shown in (B), (D), (G) and (H). In (A), a motoneuron (MN) is neighbored by three gial cells (g). Blood vessels (bv) appear intact. A close up image of the area between the MN and g (boxed area of (A)), is shown in (C). Within this area, synaptic terminals, presumably from an inter neuron are seen and indicated as terminal 1 (t1) and terminal 2 (t2). High magnification images of t1 and t2 along with soma of the MN are shown in (E) and (F) respectively. Arrows point to thin processes of presumable glial cells between the neuron and terminals, whereas arrow heads label cell membranes with electron dense material. In (B), the same region of lumbar spinal cord motoneuron (MN) from a saline control mouse is shown. Note that the control has normal appearance without multiple glial cells. Blood vessels (bv) also appear intact. The boxed area of (B) is depicted in (D). Synaptic terminals from inter neurons are labeled as t3 and t4. (G) and (H) are higher magnification of t3 and t4 along with the MN. Arrowheads show the pre-synaptic membrane with electron dense material. Bars indicate 10μm for (A) and (B), 1 μm for (C) and (D), and 0.1 μm for (E-H).
Alteration of neuronal function by Stx2
To determine whether Stx2 changed neuronal physiology, Ca2+ imaging of astrocytic endfeet was conducted. A consistent finding in Stx2 treated brain slices was that cerebral astrocytic endfeet had increased Ca2+ transients in response to EFS (Fig.6). Both female and male Stx2 treated brain slices showed significant increase of F/Fo in astrocytic endfeet. A total of 33 astrocytic endfeet from Stx2 treated and of 29 from control (aCSF) were analyzed for Ca2+ transient activity. Stx2 treatment increased F/Fo approximately 50%, and the increase was shown to be statistically significant by unpaired t-test (p=0.0002, two-tailed).
Figure 6.

Effect of Stx2 on Ca2+ transients in cortical astrocytic endfeet. Freshly prepared brain slices were incubated with 1nM (72ng/ml) Stx2 at 37°C, 5% CO2 for 30 min, followed by Fluo-4 AM incubation as described in materials and methods. Brain slices were stimulated with electrical field stimulation (EFS), and Ca2+ transients in astrocytic endfeet were recorded. In the left column (female), mean of three similar experiments using female brains is shown. In the middle column (male), mean of two experiments using male brains is shown. In the right column (all), mean of 5 total independent experiments is shown. Data are expressed as mean +/- SEM. Number of astrocytic endfeet recorded in the experiments is shown in each graph. p value from t-test is shown at the top. p<0.05 is taken as significant (*).
Discussion
We present data in this article that Gb3 localizes to many types of neurons in the mouse and human CNS. Thus, neurons at any location in the CNS could be affected by Stx2. Therefore, the limited outcome of hindlimb paralysis in the mouse might not be the only symptom of neuronal disorder. In humans, CNS symptoms of this disease are diverse and include cortical blindness, poor fine-motor coordination, coma, seizures, etc. Among them, it is noticed that defects in posturing as hemiparesis, and ataxia in humans [1-13] resembles, in part, the hindlimb paralysis observed in the Stx2-injected mouse.
Determining Gb3 expressing cell types is crucial to understand the effect of Stx2 on cells and tissues. When unfixed and uncryoprotected snap frozen sections are prepared, it is possible that membranous structures are destroyed by ice crystals, thus reducing localization specificity. During preparation of CNS tissue, protecting membranous structures of neurons might be more difficult than other tissues. Also, when paraffinized sections are prepared, although their morphology appears better, ethanol treatment might dissolve the lipid portion of Gb3, thus reducing sensitivity of detection. In the present study, we performed Gb3 immunodetection using methods which preserve the antigenicity of membranous glycolipid, and we detected Gb3 in CNS neurons. This is consistent with Utsunomiya et al. [39] in which Gb3 was detected in peripheral neurons. We further performed immunoelectronmicroscopy to show the cellular compartments where Gb3 is expressed were consistent with the organelle in which Stx2 was detected in the Stx2 injected animal. Also, the detection of Stx2 in neurons of mice injected with purified Stx2 proved that Stx2 itself crosses either the blood-brain barrier (BBB) or the blood-cerebrospinal fluid barrier (BCSFB). This is consistent with previous report of Goldstein et al. [40].
The physical blocking of motoneuron synapses in the mouse by a lamellipodia-like process was shown to be due to Stx2 in this study. This phenomenon resembles ‘the stripping’ that was formally reported by others. Moran and Graeber described in detail [26] that peripheral nerve axotomy induced detachment of the afferent synaptic ending in the CNS, and subsequently, the synapse was displaced by microglial processes (‘the stripping’) after one week, and later (in 2-3 weeks) the microglial processes were replaced by astrocytic processes. It is not yet known which glial cell type is responsible for Stx2 induced stripping. Also, how Stx2 causes this change is still unclear, but Stx2 influences neurons and alters neuron-glia interactions via this effect. Pastor et al. [27] reported that Botulinum neurotoxin (BoNT) type A induced the stripping in abducens motoneurons, however, the physiological alterations in synaptic potentials occurred in advance. Therefore, they concluded that synaptic detachment was secondary to the physiological changes caused by the BoNT.
In order to find out whether Stx2 functionally alters neurons through Gb3, a physiological study was performed on murine brain slices. Since the EFS condition used in this study only depolarizes neurons, the change in Ca2+ in astrocytes is downstream of this event. Thus, a change in Ca2+ transients in astrocytes reflects a Stx2 effect on neurons. We detected a significant increase of Ca2+ transients in astrocytes in Stx2 treated brains suggesting that the toxin altered neuronal physiological function to release an increased amount of glutamate.
The mechanism of increased neurotransmitter release by Stx2 is unknown. However, Fujimoto's group has reported that Stx could induce signal transduction via a Src family kinase associated with lipid rafts [41]. They also have shown that human renal tubular epithelial carcinoma cells treated with Stx pentameric B subunits alone induced cytoskeleton remodeling which is thought to be downstream of Src signaling [42]. Recently, Hehnly et al. reported that Stx binding to the receptor alters microtubule dynamics [43]. The latter two papers showed that these effects were through small GTPases. Importantly, the small GTPase Rho is known to be involved in increasing neurotransmitter vesicle transport to the active zone, thus increasing neurotransmitter release from neurons. The possibility of signal transduction by B subunits in neurons in relation to neurotransmitter release needs further study.
In STEC infectious disease, the outer membrane lipopolysaccharide (LPS) is also involved in progression of symptoms. Sugatani et al. demonstrated that co-administration of LPS and Stx2 increased the hemorrhage compared to Stx2 alone [44], which resembled STEC-induced human CNS pathology reported as edema and infarct with hemorrhage[12, 38, 45-48]. As we demonstrated in this article, Stx2 alone induces hindlimb paralysis, however, LPS might enhance the Stx CNS lesion by impairing the BBB and allowing more Stx into the CNS parenchyma where the toxin affects neurons. Recently, we reported that both Stx2 and LPS are required to cause HUS in mice [32]. Therefore, in the future, it is important to determine the involvement of LPS in addition to Stx in STEC induced CNS disease.
Acknowledgments
We thank Mr. Kinji Ishida (EMBIR, Iwate Med. Univ.) for ultracryo sectioning, and thank Dr. James Mandell (University of Virginia, Neuropathology) for examining H&E and Nissl's stained sections and for his useful discussions.
Financial support: (1) Grants-in-Aid of Scientific Research (KT, SS:15650066), (2) Grants-in-Aid for Advanced Medical Science Research (KT, FO) by the Ministry of Science, Education, Sports and Culture, Japan, (3) USPHS grants AI024431 (TO) and HL 44455 (MN).
Footnotes
Potential conflicts of interest: none to be reported.
Presented in part: VTEC Melbourne Oct 2006 (abstract# P10.1.09)
References
- 1.Valles PG, Pesle S, Piovano L, et al. Postdiarrheal Shiga toxin-mediated hemolytic uremic syndrome similar to septic shock. Medicina (B Aires) 2005;65:395–401. [PubMed] [Google Scholar]
- 2.Verweyen HM, Karch H, Allerberger F, Zimmerhackl LB. Enterohemorrhagic Escherichia coli (EHEC) in pediatric hemolytic-uremic syndrome: a prospective study in Germany and Austria. Infection. 1999;27:341–7. doi: 10.1007/s150100050040. [DOI] [PubMed] [Google Scholar]
- 3.Milne LM, Plom A, Strudley I, et al. Escherichia coli O157 incident associated with a farm open to members of the public. Commun Dis Public Health. 1999;2:22–6. [PubMed] [Google Scholar]
- 4.Cimolai N, Carter JE. Bacterial genotype and neurological complications of Escherichia coli O157:H7-associated haemolytic uraemic syndrome. Acta Paediatr. 1998;87:593–4. doi: 10.1080/08035259850158353. [DOI] [PubMed] [Google Scholar]
- 5.Perez N, Spizzirri F, Rahman R, Suarez A, Larrubia C, Lasarte P. Steroids in the hemolytic uremic syndrome. Pediatr Nephrol. 1998;12:101–4. doi: 10.1007/s004670050413. [DOI] [PubMed] [Google Scholar]
- 6.Tapper D, Tarr P, Avner E, Brandt J, Waldhausen J. Lessons learned in the management of hemolytic uremic syndrome in children. J Pediatr Surg. 1995;30:158–63. doi: 10.1016/0022-3468(95)90554-5. [DOI] [PubMed] [Google Scholar]
- 7.Tinaztepe K, Akkok N, Tinaztepe B. Hemolytic-uremic syndrome (HUS): a clinicopathological study of 15 cases. Turk J Pediatr. 1993;35:23–36. [PubMed] [Google Scholar]
- 8.Cimolai N, Morrison BJ, Carter JE. Risk factors for the central nervous system manifestations of gastroenteritis-associated hemolytic-uremic syndrome. Pediatrics. 1992;90:616–21. [PubMed] [Google Scholar]
- 9.Hughes DA, Beattie TJ, Murphy AV. Haemolytic uraemic syndrome: 17 years' experience in a Scottish paediatric renal unit. Scott Med J. 1991;36:9–12. doi: 10.1177/003693309103600105. [DOI] [PubMed] [Google Scholar]
- 10.Hahn JS, Havens PL, Higgins JJ, O'Rourke PP, Estroff JA, Strand R. Neurological complications of hemolytic-uremic syndrome. J Child Neurol. 1989;4:108–13. doi: 10.1177/088307388900400206. [DOI] [PubMed] [Google Scholar]
- 11.Taylor CM, White RH, Winterborn MH, Rowe B. Haemolytic-uraemic syndrome: clinical experience of an outbreak in the West Midlands. Br Med J (Clin Res Ed) 1986;292:1513–6. doi: 10.1136/bmj.292.6534.1513. [DOI] [PMC free article] [PubMed] [Google Scholar]
- 12.Sheth KJ, Swick HM, Haworth N. Neurological involvement in hemolytic-uremic syndrome. Ann Neurol. 1986;19:90–3. doi: 10.1002/ana.410190120. [DOI] [PubMed] [Google Scholar]
- 13.Bos AP, Donckerwolcke RA, van Vught AJ. The hemolytic-uremic syndrome: prognostic significance of neurological abnormalities. Helv Paediatr Acta. 1985;40:381–9. [PubMed] [Google Scholar]
- 14.Lopez EL, Diaz M, Grinstein S, et al. Hemolytic-uremic syndrome and diarrhea in Argentine children: the role of Shiga-like toxins. J Infect Dis. 1989;160:469–75. doi: 10.1093/infdis/160.3.469. [DOI] [PubMed] [Google Scholar]
- 15.Ostroff SM, Tarr PI, Neill MA, Lewis JH, Hargrett-Bean N, Kobayashi JM. Toxin genotypes and plasmid profiles as determinants of systemic sequelae in Escherichia coli O157:H7 infections. J Infect Dis. 1989;160:994–8. doi: 10.1093/infdis/160.6.994. [DOI] [PubMed] [Google Scholar]
- 16.Gerber A, Karch H, Allerberger F, Verweyen HM, Zimmerhackl LB. Clinical course and the role of shiga toxin-producing Escherichia coli infection in the hemolytic-uremic syndrome in pediatric patients, 1997-2000, in Germany and Austria: a prospective study. J Infect Dis. 2002;186:493–500. doi: 10.1086/341940. [DOI] [PubMed] [Google Scholar]
- 17.Khine AA, Lingwood CA. Capping and receptor-mediated endocytosis of cell-bound verotoxin (Shiga-like toxin). 1: Chemical identification of an amino acid in the B subunit necessary for efficient receptor glycolipid binding and cellular internalization. J Cell Physiol. 1994;161:319–32. doi: 10.1002/jcp.1041610217. [DOI] [PubMed] [Google Scholar]
- 18.Sandvig K, Olsnes S, Brown JE, Petersen OW, van Deurs B. Endocytosis from coated pits of Shiga toxin: a glycolipid-binding protein from Shigella dysenteriae 1. J Cell Biol. 1989;108:1331–43. doi: 10.1083/jcb.108.4.1331. [DOI] [PMC free article] [PubMed] [Google Scholar]
- 19.Sandvig K, Garred O, Prydz K, Kozlov JV, Hansen SH, van Deurs B. Retrograde transport of endocytosed Shiga toxin to the endoplasmic reticulum. Nature. 1992;358:510–2. doi: 10.1038/358510a0. [DOI] [PubMed] [Google Scholar]
- 20.Endo Y, Tsurugi K, Yutsudo T, Takeda Y, Ogasawara T, Igarashi K. Site of action of a Vero toxin (VT2) from Escherichia coli O157:H7 and of Shiga toxin on eukaryotic ribosomes. RNA N-glycosidase activity of the toxins. Eur J Biochem. 1988;171:45–50. doi: 10.1111/j.1432-1033.1988.tb13756.x. [DOI] [PubMed] [Google Scholar]
- 21.Waddell T, Cohen A, Lingwood CA. Induction of verotoxin sensitivity in receptor-deficient cell lines using the receptor glycolipid globotriosylceramide. Proc Natl Acad Sci U S A. 1990;87:7898–901. doi: 10.1073/pnas.87.20.7898. [DOI] [PMC free article] [PubMed] [Google Scholar]
- 22.Obrig TG, Louise CB, Lingwood CA, Boyd B, Barley-Maloney L, Daniel TO. Endothelial heterogeneity in Shiga toxin receptors and responses. J Biol Chem. 1993;268:15484–8. [PubMed] [Google Scholar]
- 23.Hughes AK, Ergonul Z, Stricklett PK, Kohan DE. Molecular basis for high renal cell sensitivity to the cytotoxic effects of shigatoxin-1: upregulation of globotriaosylceramide expression. J Am Soc Nephrol. 2002;13:2239–45. doi: 10.1097/01.asn.0000027873.85792.52. [DOI] [PubMed] [Google Scholar]
- 24.Ergonul Z, Hughes AK, Kohan DE. Induction of apoptosis of human brain microvascular endothelial cells by shiga toxin 1. J Infect Dis. 2003;187:154–8. doi: 10.1086/345861. [DOI] [PubMed] [Google Scholar]
- 25.Blinzinger K, Kreutzberg G. Displacement of synaptic terminals from regenerating motoneurons by microglial cells. Z Zellforsch Mikrosk Anat. 1968;85:145–57. doi: 10.1007/BF00325030. [DOI] [PubMed] [Google Scholar]
- 26.Moran LB, Graeber MB. The facial nerve axotomy model. Brain Res Brain Res Rev. 2004;44:154–78. doi: 10.1016/j.brainresrev.2003.11.004. [DOI] [PubMed] [Google Scholar]
- 27.Pastor AM, Moreno-Lopez B, De La Cruz RR, Delgado-Garcia JM. Effects of botulinum neurotoxin type A on abducens motoneurons in the cat: ultrastructural and synaptic alterations. Neuroscience. 1997;81:457–78. doi: 10.1016/s0306-4522(97)00200-5. [DOI] [PubMed] [Google Scholar]
- 28.Trapp BD, Wujek JR, Criste GA, et al. Evidence for synaptic stripping by cortical microglia. Glia. 2007;55:360–8. doi: 10.1002/glia.20462. [DOI] [PubMed] [Google Scholar]
- 29.Filosa JA, Bonev AD, Nelson MT. Calcium dynamics in cortical astrocytes and arterioles during neurovascular coupling. Circ Res. 2004;95:e73–81. doi: 10.1161/01.RES.0000148636.60732.2e. [DOI] [PubMed] [Google Scholar]
- 30.Zonta M, Angulo MC, Gobbo S, et al. Neuron-to-astrocyte signaling is central to the dynamic control of brain microcirculation. Nat Neurosci. 2003;6:43–50. doi: 10.1038/nn980. [DOI] [PubMed] [Google Scholar]
- 31.Melton-Celsa AR, OB A. Shiga toxins of Shigella dysenteriae and Escherichia coli. In: Aktories K, J I, editors. Handbook of Experimental Phamacology. Freiburg: Springer; 2000. pp. 385–406. [Google Scholar]
- 32.Keepers TR, Psotka MA, Gross LK, Obrig TG. A murine model of HUS: Shiga toxin with lipopolysaccharide mimics the renal damage and physiologic response of human disease. J Am Soc Nephrol. 2006;17:3404–14. doi: 10.1681/ASN.2006050419. [DOI] [PubMed] [Google Scholar]
- 33.Tokuyasu KT. Use of poly(vinylpyrrolidone) and poly(vinyl alcohol) for cryoultramicrotomy. Histochem J. 1989;21:163–71. doi: 10.1007/BF01007491. [DOI] [PubMed] [Google Scholar]
- 34.Akagi T, Ishida K, Hanasaka T, et al. Improved methods for ultracryotomy of CNS tissue for ultrastructural and immunogold analyses. J Neurosci Methods. 2006;153:276–82. doi: 10.1016/j.jneumeth.2005.11.007. [DOI] [PubMed] [Google Scholar]
- 35.Peters O, Schipke CG, Hashimoto Y, Kettenmann H. Different mechanisms promote astrocyte Ca2+ waves and spreading depression in the mouse neocortex. J Neurosci. 2003;23:9888–96. doi: 10.1523/JNEUROSCI.23-30-09888.2003. [DOI] [PMC free article] [PubMed] [Google Scholar]
- 36.Yuste R, Majewska A, Cash SS, Denk W. Mechanisms of calcium influx into hippocampal spines: heterogeneity among spines, coincidence detection by NMDA receptors, and optical quantal analysis. J Neurosci. 1999;19:1976–87. doi: 10.1523/JNEUROSCI.19-06-01976.1999. [DOI] [PMC free article] [PubMed] [Google Scholar]
- 37.Siegler RL, Pavia AT, Christofferson RD, Milligan MK. A 20-year population-based study of postdiarrheal hemolytic uremic syndrome in Utah. Pediatrics. 1994;94:35–40. [PubMed] [Google Scholar]
- 38.Tzipori S, Chow CW, Powell HR. Cerebral infection with Escherichia coli O157:H7 in humans and gnotobiotic piglets. J Clin Pathol. 1988;41:1099–103. doi: 10.1136/jcp.41.10.1099. [DOI] [PMC free article] [PubMed] [Google Scholar]
- 39.Utsunomiya I, Ren J, Taguchi K, et al. Immunohistochemical detection of verotoxin receptors in nervous system. Brain Res Brain Res Protoc. 2001;8:99–103. doi: 10.1016/s1385-299x(01)00091-5. [DOI] [PubMed] [Google Scholar]
- 40.Goldstein J, Loidl CF, Creydt VP, Boccoli J, Ibarra C. Intracerebroventricular administration of Shiga toxin type 2 induces striatal neuronal death and glial alterations: an ultrastructural study. Brain Res. 2007;1161:106–15. doi: 10.1016/j.brainres.2007.05.067. [DOI] [PubMed] [Google Scholar]
- 41.Katagiri YU, Mori T, Nakajima H, et al. Activation of Src family kinase yes induced by Shiga toxin binding to globotriaosyl ceramide (Gb3/CD77) in low density, detergent-insoluble microdomains. J Biol Chem. 1999;274:35278–82. doi: 10.1074/jbc.274.49.35278. [DOI] [PubMed] [Google Scholar]
- 42.Takenouchi H, Kiyokawa N, Taguchi T, et al. Shiga toxin binding to globotriaosyl ceramide induces intracellular signals that mediate cytoskeleton remodeling in human renal carcinoma-derived cells. J Cell Sci. 2004;117:3911–22. doi: 10.1242/jcs.01246. [DOI] [PubMed] [Google Scholar]
- 43.Hehnly H, Sheff D, Stamnes M. Shiga toxin facilitates its retrograde transport by modifying microtubule dynamics. Mol Biol Cell. 2006;17:4379–89. doi: 10.1091/mbc.E06-04-0310. [DOI] [PMC free article] [PubMed] [Google Scholar]
- 44.Sugatani J, Igarashi T, Munakata M, et al. Activation of coagulation in C57BL/6 mice given verotoxin 2 (VT2) and the effect of co-administration of LPS with VT2. Thromb Res. 2000;100:61–72. doi: 10.1016/s0049-3848(00)00305-4. [DOI] [PubMed] [Google Scholar]
- 45.Bale JF, Jr, Brasher C, Siegler RL. CNS manifestations of the hemolytic-uremic syndrome. Relationship to metabolic alterations and prognosis. Am J Dis Child. 1980;134:869–72. doi: 10.1001/archpedi.1980.02130210053014. [DOI] [PubMed] [Google Scholar]
- 46.Hamano S, Nakanishi Y, Nara T, et al. Neurological manifestations of hemorrhagic colitis in the outbreak of Escherichia coli O157:H7 infection in Japan. Acta Paediatr. 1993;82:454–8. doi: 10.1111/j.1651-2227.1993.tb12721.x. [DOI] [PubMed] [Google Scholar]
- 47.Steinborn M, Leiz S, Rudisser K, Griebel M, Harder T, Hahn H. CT and MRI in haemolytic uraemic syndrome with central nervous system involvement: distribution of lesions and prognostic value of imaging findings. Pediatr Radiol. 2004;34:805–10. doi: 10.1007/s00247-004-1289-2. [DOI] [PubMed] [Google Scholar]
- 48.Ogura H, Takaoka M, Kishi M, et al. Reversible MR findings of hemolytic uremic syndrome with mild encephalopathy. AJNR Am J Neuroradiol. 1998;19:1144–5. [PMC free article] [PubMed] [Google Scholar]