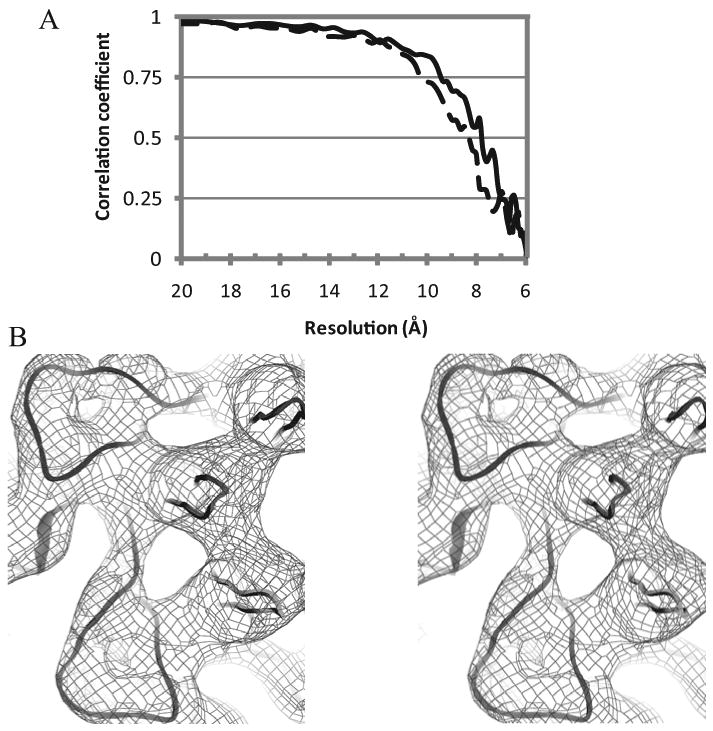
Figure 2. Assessment of map quality.

(A) Fourier shell correlation (FSC) comparing the signal from two halves of the image set as a function of resolution. The correlation for the virus alone is shown in solid line and that of the heparin complex dashed. Resolutions are estimated from the points at which the correlation coefficients drop below 0.5. (B) Example region of the 7.8 Ǻ resolution native reconstruction rendered at ∼8 e.u and overlaid on the crystallographic structure. The view is inwards, parallel to a 5-fold axis, around which 3 copies of the HI loop can be seen on the right, with two copies of the EF loop (top left & bottom). The reconstruction allows features of the virus to be resolved at the level of surface loops.
