

Abstract
Infrared spectroscopy identifies molecules by detection of vibrational patterns characteristic of molecular bonds. We apply this approach to measure protein acetylation after treatment with histone deacetylase inhibitors. The anticancer activity of histone deacetylase inhibitors (HDACi) is ascribed to the hyperacetylation of both core nucleosomal histones and non-histone proteins critical to the maintenance of the malignant phenotype. 1, 2 After incubating peripheral blood mononuclear cells in vitro with the HDACi SNDX-275, a benzamide drug derivative, vibrational spectral changes in the methyl and methylene stretching mode regions, which reflect concentration-dependent increases in protein acetylation, were detected and quantified. We applied these metrics, based upon spectral differences, to peripheral blood mononuclear cells (PBMCs) from patients treated in vivo with this agent. The data demonstrate a new approach to a sensitive assessment of global molecular modifications that is independent of antibodies, requires minimal cell processing, and is easily adapted to high-throughput screening.
Keywords: acetylation, histone, vibrational spectroscopy, imaging, epigenetics, cancer
Introduction
The compact nuclear packing of the mammalian genome both strengthens DNA for mitosis and meiosis processing and serves as a mechanism to control gene expression. Specifically, chromatin units consist of 146 base pairs of DNA wrapped around a histone octamer comprised of two copies each of the core histones H2A, H2B, H3, and H4. Core histones represent globular domains in which lysine-rich, positively charged amino-terminal tails bind to the negatively charged DNA-phosphate backbone. Nucleosomes contain sites for various post-translational modifications that are critical in inducing chromatin structural changes which ultimately affect gene expression. Most post-translational modifications are dynamic processes. Histone acetyltransferases (HATs) and histone deacetylases (HDACs) maintain appropriate histone acetylation and provide a mechanism for linking the degree of histone acetylation with that of transcriptional activation.1 Histone acetylation neutralizes the positively charged lysine residues which then reduces the affinity of the histone N-terminal tails for DNA and enhances the access of transcriptional factors to promoter regions of DNA, thus allowing active transcription. Histone modifications may also affect chromatin structure by recruiting non-histone proteins that, enzymatically, further modify chromatin.
As HAT and HDAC enzymes act reciprocally to regulate the acetylation of cellular proteins, inhibitors of HAT and HDAC enzymes represent anticancer drug targets. 2,3 Reduced HDAC activity leads to an increase in histone acetylation which re-activates specific silenced genes due to the previously more tightly bound DNA/histone structure. Since HDAC inhibitors, HDACi, exhibit promise for use as anticancer agents, the measurement of cellular protein acetylation may provide an important indicator for monitoring HAT and HDAC activity. Recent studies demonstrate that cytoplasmic non-histone proteins, which include proteins that are important in cancer cell biology, may become acetylated in response to HDACi. This suggests that the measurement of non-histone protein acetylation should also be considered in an analysis of HDACi antineoplastic activity. 4-7 The emerging interest in epigenetic research offers a great potential in identifying biomarkers for detecting and diagnosing disease in its earliest stages; since epigenetic changes can be reversed by chemical agents, new opportunities arise for cancer prevention and treatment.8
Vibrational infrared spectroscopy allows a detailed characterization of various biochemical species and an elucidation of protein structural reorganizations in cellular components. 9-11 Given the sensitivity of vibrational spectroscopic techniques to molecular changes associated with disease, observed spectral differences between healthy and diseased tissue support the potential utility of spectroscopic techniques to provide an efficient molecular biomarker assay platform both in vitro and in vivo.12 When used in an imaging mode, vibrational spectroscopy provides correlations between the spectral map and specimen histopathology of heterogeneous tissue.13
Molecular efficacy often proves challenging to quantify. Although a number of methods exist for the measurement of discrete molecular events arising from pharmacologic agents, the majority of assays on patient samples rely on antibody detection methods. Antibody mediated methods, although robust, require different antibodies to measure each individual epitope. In particular, the production of high affinity and high specificity antibodies for some epitopes is difficult. Infrared spectroscopy, however, offers the capacity to measure quantitatively discrete molecular events with high precision on a global scale with limited sample preparation. In an effort to access potential spectral biomarkers related to protein acetylation and to assess the ability of the vibrational infrared spectroscopic imaging approach for detecting cellular acetylation, we identify specifically vibrational patterns for measuring protein acetylation after the treatment with an HDACi drug, SNDX-275 (formerly MS-275). In applying the spectral markers associated with the infrared spectra collected from lymphocytes treated in vitro, we were able to quantify global lysine deacetylation in a dose dependent manner. We subsequently applied these metrics to peripheral blood mononuclear cells from patients treated in vivo.
Experimental Section
Preparation of cells
PBMCs were isolated from whole blood by centrifugation on Ficoll-Paque Plus. PBMC samples from healthy donors were incubated in vitro with 10, 30, 100, and 300 nM SNDX-275 at 37°C for 24 hours. PBMCs were washed with phosphate buffered saline, fixed for 30 min at 37°C in 0.4% paraformaldehyde, washed with PBS, and 10 μl of the cell solution were spotted and air-dried on aluminum-coated slides for infrared spectral acquisition. The cells were then directly spotted on to aluminum coated slides, allowed to dry and then subject to Fourier- transform infrared spectroscopy (FTIR) imaging.
Patient samples
Peripheral blood samples were obtained from patients enrolled in the National Cancer Institute phase I study of the drug SNDX-275, N-(2-Aminophenyl)-4-[N-(pyridine-3-ylmethoxy-carbonyl) aminomethyl] benzamide, (Mitsui Pharmaceuticals and Schering AG, licensed to Syndax Pharmaceuticals) in advanced and refractory solid tumors or lymphoma. Patient characteristics, study design, and assessment of toxicity and response have been described. 14 The SNDX-275 trials were conducted under IRB-approved protocols of an NCI-sponsored IND. The protocol design and conduct have followed all applicable regulations, guidance, and local policies.
Infrared Spectrum Collection and Data Analysis
Infrared spectra from PBMCs were collected using the Perkin-Elmer (Shelton, CT) Spectrum One/ Spotlight 300 imaging system equipped with a liquid nitrogen-cooled MCT 16 element linear array detector and a motorized sample stage. The infrared images were acquired in the reflection mode and the acquisition time for a 250 μm by 250 μm sampling area was approximately 30 min with 16 scans per pixel at 4 cm-1 spectral resolution within the 4000-700 cm-1 spectral range.
From the scanned area, cellular spectra were obtained using the Band Target Entropy Minimization (BTEM) method 15-17, a multivariate analysis that allows an effective separation of the spectral features of interest from background signals and spectral noise. The image data sets were first subjected to a singular value decomposition (SVD) computation. SVD generates three independent matrices: the matrix of scores, the matrix of singular values, and the matrix of loadings. The matrix of loadings contains orthogonal basis vectors, and the matrix of scores represents the concentrations of the basis vectors. Following SVD, both Band Target Entropy Minimization (BTEM) and the traditional approach of Principal Component Analysis (PCA) were used to produce physically meaningful, pure component spectra. BTEM is a relatively new self-modeling curve resolution method in which the orthogonal basis vectors obtained from SVD computations are transformed into individual pure component spectra. The basic concept stems from information entropy theory with the goal of maximizing the simplicity of the recovered pure component spectrum. Thus, a proper spectral estimate is obtained through the minimization of a proposed information entropy function or through the minimization of the summation of the derivatives and integrated areas of the spectral estimate. To obtain spectroscopically meaningful results, non-negative constraints were also imposed on the recovered spectral estimate and its corresponding concentrations. A major advantage of the BTEM method is the focus on an individual spectrum, as well as its capability of recovering spectra of minor spectral components arising from low spectroscopic signals. The application of BTEM has been illustrated in detail using FT-IR measurements of highly overlapping spectra of component mixtures. 15-17 In PCA, the linear combinations of selected orthogonal basis vectors (eigenvectors) obtained from an SVD computation were used to produce spectroscopically meaningful factors that result in positive scores. All multivariate data analyses were performed using software written in Matlab 7.1 (The Mathworks, Inc.).
Spectral deconvolution was carried out using GRAMS/AI software (Thermo Galactic, Inc.). The method is based on the Levenberg-Marquardt algorithm of nonlinear peak fitting 18, a useful approach for determining individual peak positions, band widths, band intensities and band areas from a set of overlapping peaks. Student's t-tests were conducted to determine whether methyl to methylene band area ratios differed between separate concentrations of SNDX-275 in healthy donor cells and between patient samples prior to and after SNDX-275 therapy. Throughout the statistical analyses, p≤0.05 was considered significant.
Results and Discussion
A representative infrared spectrum of cells obtained from a healthy donor using BTEM analysis, targeting the amide I band at 1654 cm-1, is shown in Figure 1. In addition to the amide I and amide II protein features observed at 1654 cm-1 and 1542 cm-1, respectively, spectra of cellular components contain other prominent cellular spectral bands: the PO2- symmetric stretching mode at 1088 cm-1, the amide III protein band at 1236 cm-1, and bands resulting from the methyl and methylene carbon-hydrogen (C-H) stretching modes in the 3000-2800 cm-1 spectral region.19 Figure 2a displays the concentration-dependent spectral changes observed in the C-H stretching mode region of healthy donor cells treated in vitro with increased concentrations of SNDX-275. Each spectrum represents the average of three representative spectra from three sample regions and is normalized to the ∼2924 cm-1 band. Both the intensity of the 2956 cm-1 asymmetric stretching methyl modes and the shift to higher frequencies of the 2924 cm-1 antisymmetric methylene stretching modes band position increases for increased concentrations of SNDX-275. Intensity and frequency shifts also occur in the 2850 cm-1 symmetric stretching methylene mode spectral region.
Figure 1.
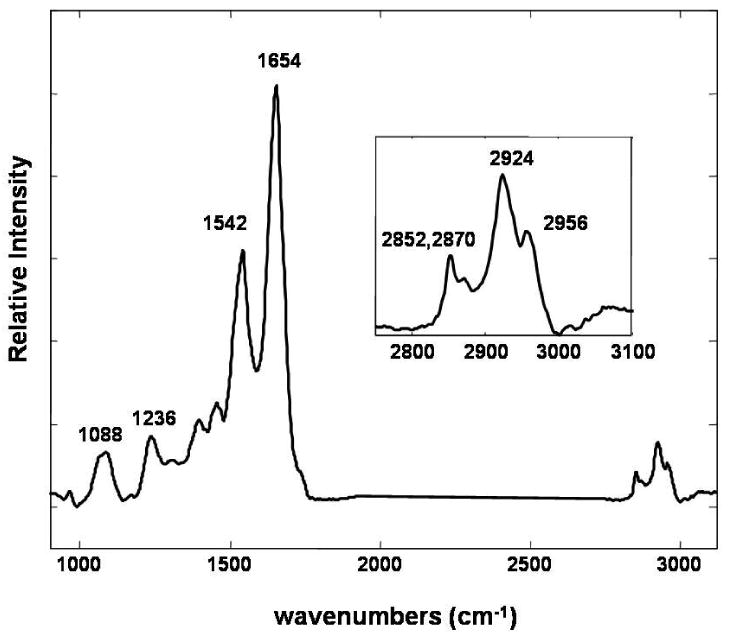
A representative infrared spectrum of PBMCs from a healthy donor obtained using multivariate analysis (Band Target Entropy Minimization). The 1088, 1236, 1542, and 1654 cm -1 bands are assigned to the PO2- symmetric stretching modes, the amide III, amide II, amide I protein modes, respectively. The inset figure displays an enlargement of the C-H stretching modes in the 3000-2800 cm-1 spectral interval.
Figure 2.
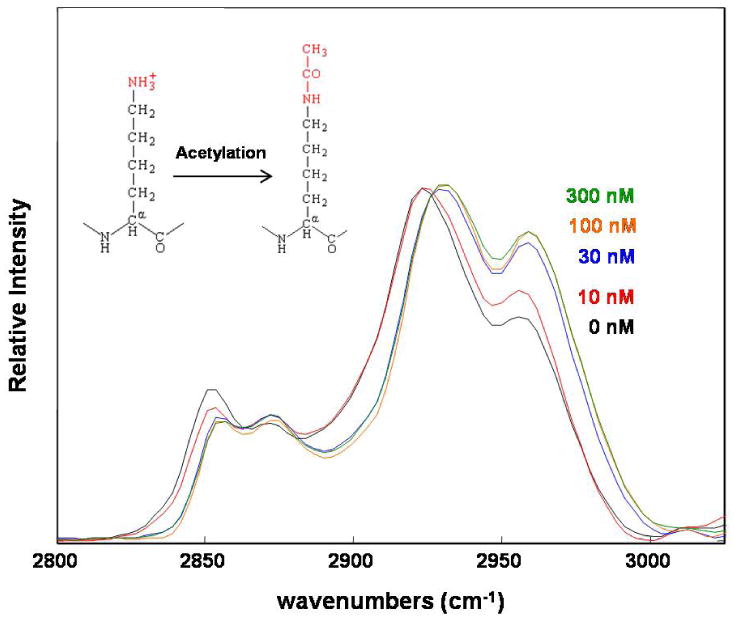
Infrared spectra of peripheral blood mononuclear cells from a healthy donor treated in vitro with increased concentrations of the HDACi, SNDX-275. Spectra are shown in the C-H stretching mode interval. Traces from bottom to top represent spectra from HDACi concentrations of 0, 10, 30, 100 and 300 nM. Both the intensity of the 2956 cm-1 band and the shift to higher frequencies of the 2924 cm-1 band position increase for increased concentrations of SNDX-275. On the upper-left of the figure, a diagram displays the molecular changes on lysine residues in the acetylation reaction.
Infrared spectroscopic band area measurements are useful for quantitation purposes since they are directly proportional to molecular absorption cross sections and, therefore, the concentration of the molecular groups reflecting specified molecular vibrations. The methyl and methylene C-H stretching mode region between 2800 cm-1 and 3000 cm-1 in the infrared spectrum is a broad feature which consists of several underlying components.20, 21 In order to quantitatively evaluate spectral changes in the C-H stretching region, after applying multivariate analysis to determine the pure cellular spectra from the region scanned, the characteristic C-H stretching mode features were assigned as follows: the CH3 asymmetric stretching modes at ∼2975 and ∼2960 cm-1, the CH3 symmetric stretching mode Fermi resonance components at ∼2872 and ∼2937 cm-1, the CH2 antisymmetric stretching modes at ∼2924 cm-1, and the CH2 symmetric stretching modes at ∼2850 cm-1. Figure 3a displays the deconvolved spectra for this spectral interval for untreated cells and for cells treated with 30 nM SNDX-275. The band area ratios of (2975+2960+ 2937+2872)/ (2924+2850) cm-1 (i.e. the ratio of the deconvoluted CH3 methyl to the CH2 methylene stretching mode band intensities) were determined. These parameters increased with increased concentrations of HDAC inhibitor; that is, increased cellular protein was acetylated. Band area ratios were obtained from three separate cellular regions reflecting the same HDAC inhibitor concentration and averaged, resulting in a single value for each concentration of HDAC inhibitor. As an example, Figure 3b displays increased methyl stretching mode intensities, attributed to the acetylation of the lysine residue epsilon-amino group, as a function of HDAC inhibitor concentration in cells from a healthy donor.
Figure 3a.
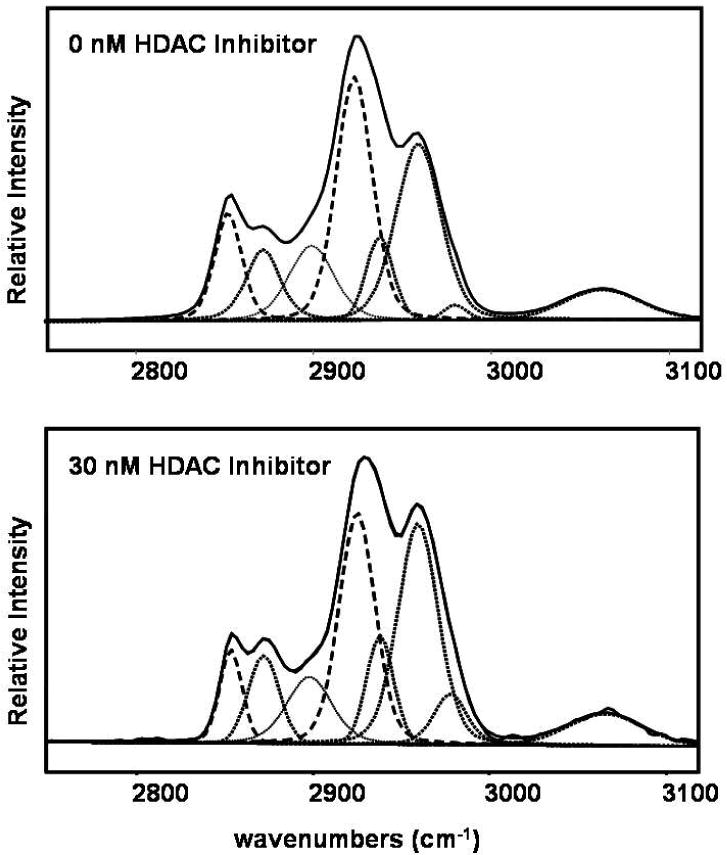
Curve-fitting was applied to resolve underlying components at C-H stretching mode region for cell spectra obtained from healthy donors. The resolved components are: the CH3 asymmetric stretching modes at ∼2975 and ∼2960 cm-1, the CH3 symmetric stretching mode Fermi resonance components at ∼2872 and ∼2937 cm-1, the CH2 antisymmetric stretching modes at ∼2924 cm-1, and the CH2 symmetric stretching modes at ∼2850 cm-1. The CH3 methyl stretching mode band intensities increased for cells with 30 nM SNDX-275 treatment. [Top: No SNDX-275 treatment. Bottom: 30 nM SNDX-275 treatment.]
Figure 3b.
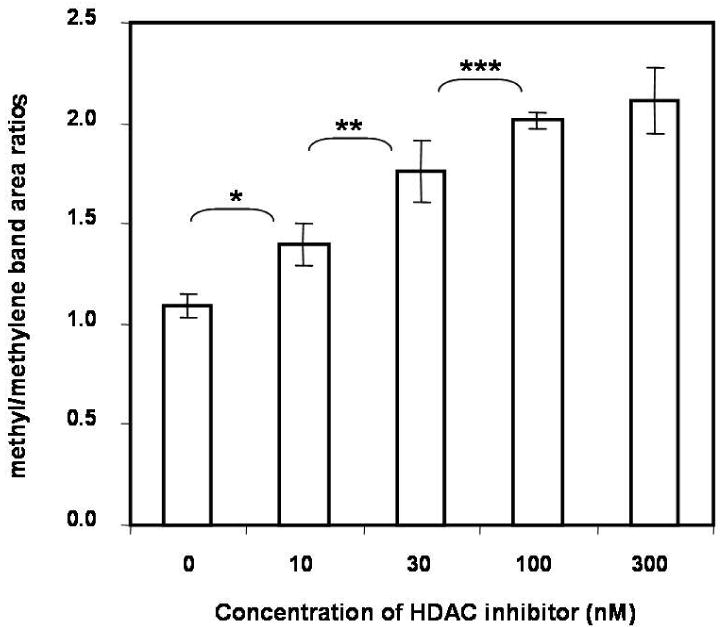
The ratio of the total methyl (CH3) to total methylene (CH2) stretching mode intensities calculated using the resolved curve-fitting components. The ratio increased with increasing concentration of SNDX-275. (* p=0.012, ** p=0.028, ***p=0.047)
Because of the complexity of the spectral data generated in these vibrational imaging measurements, multivariate analyses are useful in extracting information for the development of spectral metrics. To obtain spectrally distinct species and to visualize the spatial distribution of the species, we applied principal component analyses (PCA) to the 3000-2800 cm-1 spectral interval in each image. Within a spectral image consisting of two species that have different spatial distributions throughout the sample, the PCA analysis resolves the species into two distinct factors. Two resolved primary spectra are shown in Figure 4: Top left is the dominant spectral species (A) with bands at 2922 cm-1 and 2956 cm-1, and bottom left, spectral species (B) with bands at 2932 cm-1 and 2966 cm-1, arising from hyper-acetylated lysine residues. For each spectral species, a corresponding mark-up image exhibits in psuedocolor the relative concentration of that species in the imaged area. The degree of cellular acetylation can be calculated by dividing the total concentration of hyper-acetylated cellular protein in the cells, represented by the mark-up image of species A multiplied by the band area of spectrum A, by the concentration of the less acetylated lysine residues, given by the mark-up image of species B multiplied by the band area of spectrum B. The resulting ratio images for control and cells treated with increasing concentrations of SNDX-275 are shown in Figure 5. These computations are converted to a pseudocolored image where cells with more highly acetylated protein, hence cells with more hyper-acetylated lysine residues, have a greater percentage of pixels of high intensity, as indicated by the warm (yellow-to-red) color.
Figure 4.
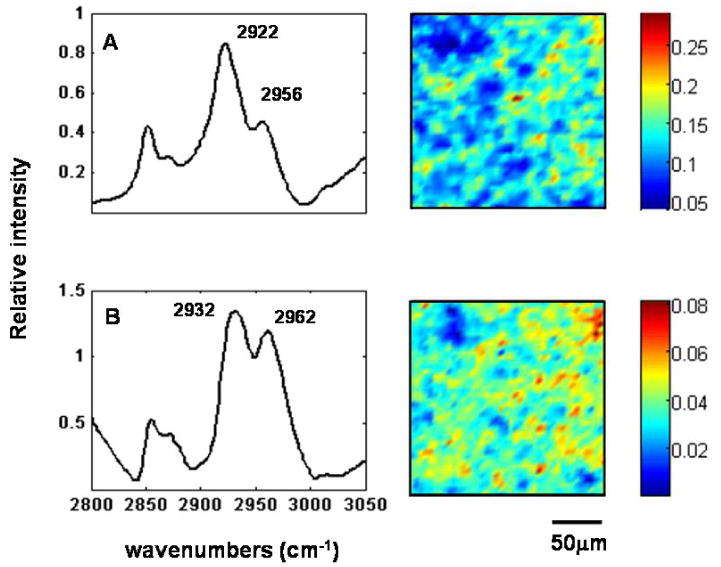
Principle component analysis of infrared images of cells from a healthy donor treated with SNDX-275 in vitro. On the left, two major spectral species resulted from linear combinations of the factors obtained using PCA. Species A with C-H stretching mode vibrations at 2922 cm-1 and 2956 cm-1, and species B with C-H stretching mode vibrations at 2932 cm-1 and 2962 cm-1 arising from hyper-acetylated lysine residues. Score images corresponding to the spectral species are shown on the right.
Figure 5.
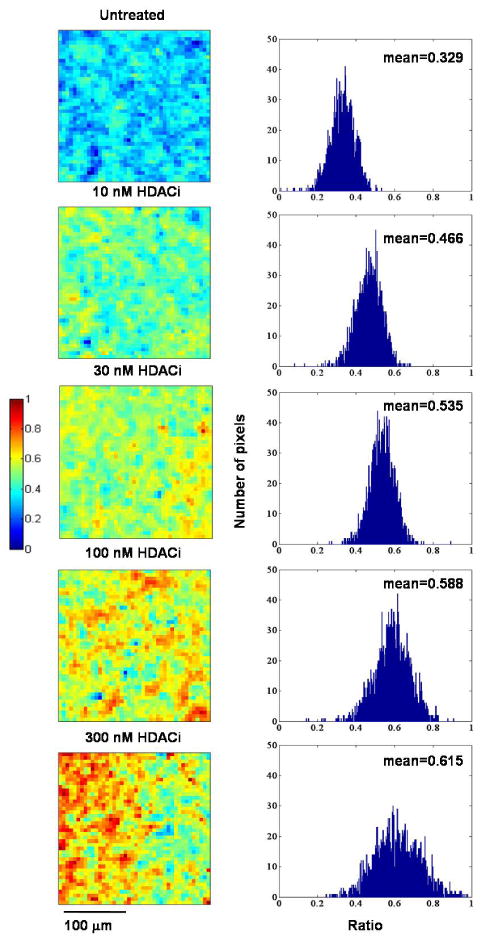
Pseudocolored images of untreated and SNDX-275 treated healthy donor PBMCs displaying the degree of cellular acetylation calculated from the score of the hyper-acetylated lysine residues and the score of non-hyper-acetylated lysine residues. Histogram of each pseudocolored image shows the distribution of the ratios representing the degree of cellular acetylation in the imaged area.
To assess the performance of our infrared spectroscopic method in monitoring drug effects in patients participating in an SNDX-275 phase I clinical trial, we also examined PBMCs from three patients before and after treatment. Figure 6a shows spectral changes in the C-H stretching mode region. Increased 2956 cm-1 band intensities were found in all patients subsequent to the SNDX-275 treatment. After resolving the underlying components in the C-H stretching mode region, the ratios of the CH3 methyl to the CH2 methylene stretching mode intensities obtained for the patients before and after treatment are summarized in Table 1. The significantly increased ratios of methyl to methylene indicate increased degree of protein acetylation in all patients after SNDX-275 treatment. Figure 6b shows the degree of protein acetylation before and after SNDX-275 treatment as determined from the ratio of total amount of hyper-acetylated protein in the cells (species A) to proteins containing less acetylated lysine residues (species B). The increased number of “warm color” pixels in the imaged area indicates increased degree of acetylation after SNDX-275 treatment.
Figure 6a.
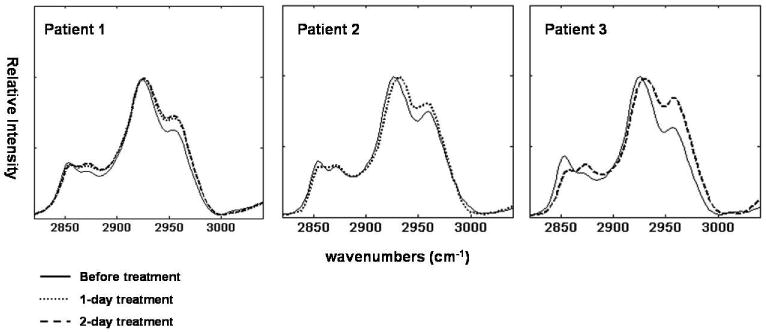
Infrared spectra of PBMCs from three patients receiving SNDX-275 therapy. Solid line: before treatment, dotted line: 1-day post-SNDX-275 treatment, and dashed line: 2 days post SNDX-275 treatment. Lower 2956 cm-1 band intensities were found in all patients prior to SNDX-275 treatment. Quantitative results are shown in Table 1.
Table 1.
Ratio of methyl to methylene stretching mode intensities before and after SNDX-275 treatment. p-values are calculated using Student t-test. Values are reported as mean (standard deviation, number of measurements).
| Patient | 1 | 2 | 3 |
|---|---|---|---|
| Before treatment | 1.12 (0.155, n=5) | 1.44 (0.120, n=3) | 1.23 (0.086, n=4) |
| Day 1 | 1.47 (0.013, n=4) | 1.75 (0.121, n=4) | - |
| Day 2 | 1.56 (0.134, n=4) | - | 1.86 (0.428, n=3) |
|
| |||
| p-value | 0.04† | 0.02 | 0.032 |
p-value is from comparison of the pre-treatment and day 2 treatment samples.
Figure 6b.
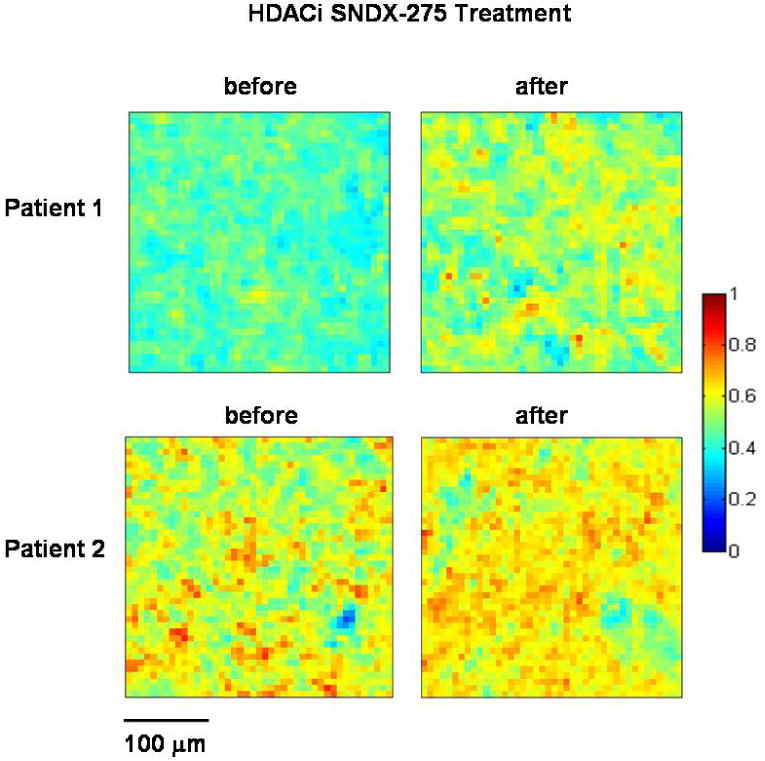
Pseudocolored images displaying relative concentration of hyper-acetylated lysine residues in patient samples calculated from the ratio of the score of hyper-acetylated lysine residues to non-hyper-acetylated lysine residues. Images on the left are cells before SNDX-275 treatment and images on the right are cells after SNDX-275 treatment.
We demonstrate here the capability of infrared vibrational spectroscopic techniques to detect dosage-dependent protein acetylation both in vitro and in vivo. In this study we utilized the small HDAC inhibitor molecule SNDX-275, which is currently in clinical development as a novel anticancer drug. This general approach has broad implications. We demonstrate the means of measuring a dose-dependent drug effect at the molecular level in vitro and then show that this method can then be directly transferred to measuring the same effect in vivo. This technique could facilitate early drug development, including phase 0 clinical trials of agents that have mechanisms of action that can be monitored at the molecular level.
With the HDACi SNDX-275, the spectral change observed in the methyl and methylene C-H stretching mode regions is indicative of chromatin and non-histone protein modifications that are associated with varying degrees of acetylation. The measurement of core histone hyperacetylation in peripheral blood mononuclear cells measured by antibody-mediated detection methods was originally thought to be adequate as a biomarker for the assessment of the efficacy of anticancer drugs. However, recent studies have demonstrated that a large number of non-histone proteins in the nucleus and cytoplasm which are subject to acetylation in response to HDAC inhibitors are functionally regulated by this process. These proteins contain subsets of proteins that are important in cancer cell biology. This suggests that measurement of non-histone protein acetylation should also be considered in an analysis of HDAC inhibitor antineoplastic activity. 22 It is impractical to attempt to measure these effects via antibody mediated approaches, as each individual acetylated amino acid requires a different antibody. The epitope for the detection of the acetyl amino acid, although specific to the presence of absence or the acetyl moiety includes the adjacent amino acids. As such, determining the relative global acetylation has significant value in an assessment of the efficacy of HDCA inhibitors.
Since infrared vibrational spectroscopic imaging methods detect the relative amounts of acetylated lysine using spectral markers arising from the acetyl chemical functional groups, the potential exists to determine a quantitative measurement of all acetylated proteins for correlating a therapeutic response to HDAC inhibitors. Because of the ability of HDAC inhibitors to reverse epigenetic abnormalities, such as aberrant histone deacetylation, there has been an increased interest in developing HDAC inhibitors as therapeutic drugs in clinical trials, 23, 24 as well as in the development of assays for monitoring HDACi drug effects in patients.25, 26 An anti-acetylated lysine assay was also used as a companion to measure protein acetylation in healthy peripheral blood mononuclear cells treated in vitro with 10 to 300 nM of HDAC inhibitor. No significant increase of protein acetylation was detected (data not shown), suggesting that the infrared spectroscopic technique provides an extremely sensitive measurement of protein acetylation.
In comparison to existing assays used to measure molecular changes as a result of drug treatment, infrared vibrational spectroscopic approaches represent a non-invasive technique that allows an assay of total cellular events mediated by the agent; that is, assays not limited to only those events detected by a specific antibody. Since vibrational spectroscopic techniques do not involve sample staining or antibody attachment for detecting acetylated proteins, several advantages arise: first, the spectroscopic approach is free from antibody affinity and specificity problems. Detection of a biomarker with an antibody is a complex assay in which multiple reagents are utilized under specific conditions. Further, the modification of the assay or reagents directly impacts the sensitivity and specificity of the assay.27, 28 Second, pre-analytic issues including sample handling are more straightforward than antibody-based assays which require the maintenance of primary, secondary and, in some instances, tertiary protein structure.13 Third, infrared spectroscopic imaging methods can be applied directly and non-invasively to the specimen, which can then be utilized in other types of assays.
Conclusions
We demonstrate the utilization of infrared imaging spectroscopy toward assessing the molecular vibrational signatures of protein acetylation and its modulation by HDAC inhibitor treatment. In applying this approach, infrared spectroscopic imaging has the potential to become a new and powerful biomarker platform for measuring drug action at the molecular level both in vitro and in vivo.
Acknowledgments
We acknowledge support from the intramural research program of the National Institute of Diabetes and Digestive and Kidney Diseases and the Center for Cancer Research, National Cancer Institute, National Institutes of Health. We thank Dr. Susan Leitman and the Department of Transfusion Medicine, Clinical Center, NIH, for help in obtaining and processing peripheral blood leukocytes from healthy donors. JBT received research funding under a Cooperative Research and Development Agreement between the NCI and Schering AG.
References
- 1.Marks PA, Richon VM, Breslow R, Rifkind RA. Curr Opin Oncol. 2001;13:477–483. doi: 10.1097/00001622-200111000-00010. [DOI] [PubMed] [Google Scholar]
- 2.Mai A, Massa S, Rotili D, Cerbara I, Valente S, Pezzi R, Simeoni S, Ragno R. Med Res Rev. 2005;25:261–309. doi: 10.1002/med.20024. [DOI] [PubMed] [Google Scholar]
- 3.Conley BA, Wright JJ, Kummar S. Cancer. 2006;107:832–840. doi: 10.1002/cncr.22064. [DOI] [PubMed] [Google Scholar]
- 4.Blagosklonny MV, Robey R, Sackett DL, Du L, Traganos F, Darzynkiewicz Z, Fojo T, Bates SE. Mol Cancer Ther. 2002;1:937–941. [PubMed] [Google Scholar]
- 5.Fu MF, Wang CG, Zhang XP, Pestell RG. Biochem Pharmacol. 2004;68:1199–1208. doi: 10.1016/j.bcp.2004.05.037. [DOI] [PubMed] [Google Scholar]
- 6.Vigushin DM, Coombes RC. Curr Cancer Drug Tar. 2004;4:205–218. doi: 10.2174/1568009043481560. [DOI] [PubMed] [Google Scholar]
- 7.Johnstone RW, Licht JD. Cancer Cell. 2003;4:13–18. doi: 10.1016/s1535-6108(03)00165-x. [DOI] [PubMed] [Google Scholar]
- 8.Verma M, Srivastava S. Lancet Oncol. 2002;3:755–763. doi: 10.1016/s1470-2045(02)00932-4. [DOI] [PubMed] [Google Scholar]
- 9.Carden A, Morris MD. J Biomed Opt. 2000;5:259–268. doi: 10.1117/1.429994. [DOI] [PubMed] [Google Scholar]
- 10.Diem M, Chiriboga L, Lasch P, Pacifico A. Biopolymers. 2002;67:349–353. doi: 10.1002/bip.10109. [DOI] [PubMed] [Google Scholar]
- 11.Zhang GJ, Moore DJ, Flach CR, Mendelsohn R. Anal Bioanal Chem. 2007;387:1591–1599. doi: 10.1007/s00216-006-0852-0. [DOI] [PMC free article] [PubMed] [Google Scholar]
- 12.Haka AS, Volynskaya Z, Gardecki JA, Nazemi J, Lyons J, Hicks D, Fitzmaurice M, Dasari RR, Crowe JP, Feld MS. Cancer Res. 2006;66:3317–3322. doi: 10.1158/0008-5472.CAN-05-2815. [DOI] [PubMed] [Google Scholar]
- 13.Fernandez D, Bhargava R, Hewitt S, Levin I. Nat Biotechnol. 2005;23:469. doi: 10.1038/nbt1080. [DOI] [PubMed] [Google Scholar]
- 14.Ryan QC et al. J Clin Oncol. 2005;23:3912–3922. doi: 10.1200/JCO.2005.02.188. [DOI] [PubMed] [Google Scholar]
- 15.Widjaja E, Crane N, Chen TC, Morris MD, Ignelzi MA, McCreadie BR. Appl Spectrosc. 2003;57:1353–1362. doi: 10.1366/000370203322554509. [DOI] [PubMed] [Google Scholar]
- 16.Widjaja E, Li CZ, Chew W, Garland M. Anal Chem. 2003;75:4499–4507. doi: 10.1021/ac0263622. [DOI] [PubMed] [Google Scholar]
- 17.Widjaja E, Garland M. J Magn Reson. 2005;173:175–182. doi: 10.1016/j.jmr.2004.11.028. [DOI] [PubMed] [Google Scholar]
- 18.Marquardt DW. J Soc Ind Appl Math. 1963;11:431–441. [Google Scholar]
- 19.Diem M, Chiriboga L, Yee H. Biopolymers. 2000;57:282–290. doi: 10.1002/1097-0282(2000)57:5<282::AID-BIP50>3.0.CO;2-R. [DOI] [PubMed] [Google Scholar]
- 20.Hill IR, Levin IW. J Chem Phys. 1979;70:842–851. [Google Scholar]
- 21.Michaelian KH, Zhang SLL, Hall RH, Bulmer JT. Can J Anal Sci Spect. 2001;46:10–22. [Google Scholar]
- 22.Johnstone RW, Licht JD. Cancer Cell. 2003;4:13–18. doi: 10.1016/s1535-6108(03)00165-x. [DOI] [PubMed] [Google Scholar]
- 23.Minucci S, Pelicci PG. Nat Rev Cancer. 2006;6:38–51. doi: 10.1038/nrc1779. [DOI] [PubMed] [Google Scholar]
- 24.Oh HJ, Chung EJ, Lee S, Loaiza-Perez A, Sausville EA, Trepel JB. Cancer Chemoprevention: Promising Cancer Chemoprevention Agents Cancer Drug Discovery and Development Cancer Chemoprevention. 2004;1:659–677. [Google Scholar]
- 25.Chung EJ, Lee S, Sausville EA, Ryan Q, Karp JE, Gojo I, Telford WG, Lee MJ, Kong HS, Trepel JB. Ann Clin Lab Sci. 2005;35:397–406. [PubMed] [Google Scholar]
- 26.Ronzoni S, Faretta M, Ballarini M, Pelicci P, Minucci S. Cytom Part A. 2005;66A:52–61. doi: 10.1002/cyto.a.20151. [DOI] [PubMed] [Google Scholar]
- 27.Hewitt SM, Takikita M, Braunschweig T, Chung JY. Biomar Med. 2007;1:313–318. doi: 10.2217/17520363.1.2.313. [DOI] [PubMed] [Google Scholar]
- 28.Henson DE. Journal of the National Cancer Institute. 2005;97:1796–1797. doi: 10.1093/jnci/dji449. [DOI] [PubMed] [Google Scholar]