

Abstract
Indian hedgehog (Ihh) controls multiple aspects of endochondral skeletal development by signaling to both chondrocytes and perichondrial cells. Previous efforts to delineate direct effects of Ihh on chondrocytes by Col2-Cre-mediated ablation of Smoothened (Smo, encoding a transmembrane protein indispensable for Ihh signaling) has been only partially successful, due to the inability to discriminate between chondrocytes and perichondrial cells. Here we report a transgenic line (Col2-Cre™) expressing under the control of the Colα1(II) promoter an inert form of Cre that is activatable by exogenous tamoxifen (TM); TM administration at proper times during embryogenesis induced Cre activity in chondrocytes but not in the perichondrium. By using this mouse line, we deleted Smo within subsets of chondrocytes without affecting the perichondrium, and found that Smo removal led to localized disruption of the expression of parathyroid hormone related protein (PTHrP) and the morphology of chondrocytes. Unexpectedly, TM invariably induced Cre activity in a subset of cells associated with the trabecular bone surface of long bones. These cells, when genetically marked and cultured in vitro, were capable of producing bone nodules. Expression of the Col2-Cre™ transgene in these cells likely reflected the endogenous Colα1(II) promoter activity, as similar cells were found to express the IIA isoform of Colα1(II) mRNA endogenously. In summary, the present study has not only provided evidence that Ihh signaling directly controls PTHrP expression and chondrocyte morphology in the growth region cartilage, but has also uncovered a distinct cell type associated with the trabecular bone that appears to possess osteogenic potential.
Keywords: Ihh, Smo, PTHrP, Type IIA procollagen, Cre, tamoxifen, cartilage, mouse
INTRODUCTION
Much of the vertebrate skeleton arises from cartilage templates that originate from mesenchymal condensations and eventually undergo endochondral ossification. Prior to overt chondrocyte differentiation, the condensing mesenchyme expresses the IIA splice form of type II collagen (Ng et al., 1993; Sandell et al., 1991; Sandell et al., 1994); subsequently cells in the core of the condensation switch to express the IIB splice form characteristic of chondrocytes, whereas the peripheral cells upregulate expression of type I collagen forming the perichondrium. Following formation of the cartilage anlage, chondrocytes initially proliferate, but progressively exit the cell cycle and undergo hypertrophy starting at the center of the element. The hypertrophic cartilage is eventually removed upon the invasion of blood vessels and replaced by bone and the marrow cavity. The continued orderly progression of chondrocytes from proliferation to hypertrophy results in the characteristic growth plates located at both ends of the cartilage template, where the round chondrocytes are near the articular surface, followed by the flat chondrocytes arranged in columns (columnar chondrocytes), and finally the hypertrophic chondrocytes adjacent to the marrow cavity. The repeated process of hypertrophy and removal of chondrocytes eventually gives rise to the final form of an endochondral bone in which much of the cartilage is replaced by bone. Thus, proper formation of an endochondral bone requires coordinated regulation of chondrocyte proliferation and maturation, vascular invasion as well as osteoblast differentiation.
Indian hedgehog (Ihh) critically controls multiple aspects of the development of endochondral bones. In the developing cartilage, Ihh is produced by prehypertrophic (immediately before hypertrophic) as well as early hypertrophic chondrocytes, and it signals to both the immature chondrocytes and the overlying perichondrial cells (St-Jacques et al., 1999; Vortkamp et al., 1996). Ihh homozygous null mutant mice exhibited a marked reduction in chondrocyte proliferation, profound dysregulation of chondrocyte maturation, a severe defect in cartilage vascularization as well as a complete lack of osteoblasts (Long et al., 2001; St-Jacques et al., 1999). More recently, genetic experiments have implicated Ihh in positively regulating the length of the columnar region, as ectopic Ihh expression induced by mosaic ablation of parathyroid hormone-related-protein receptor (PTHrP-R) in the growth plate lengthened the columnar region (Kobayashi et al., 2005). On the other hand, Col2-Cre-mediated removal of Smoothened (Smo), which encodes a transmembrane protein indispensable for all Hh signaling (Alcedo et al., 1996; van den Heuvel and Ingham, 1996; Zhang et al., 2001), abolished the same region within the growth plate (Long et al., 2006).
Genetic manipulation of Smo in the mouse has revealed that Ihh functions via either direct or indirect signaling on target cells. For instance, direct Ihh input was required for proper proliferation of chondrocytes as well as development of the osteoblast lineage (Long et al., 2004; Long et al., 2001), whereas regulation of chondrocyte maturation appeared to be mediated primarily via a secondary signal, parathyroid hormone related protein (PTHrP) (Karp et al., 2000; Long et al., 2001). Although PTHrP expression in the periarticular cartilage is known to depend upon Ihh signaling (St-Jacques et al., 1999), which most likely functions by antagonizing Gli3 repressor activity (Hilton et al., 2005; Koziel et al., 2005), it is not clear whether direct Ihh input in the periarticular chondrocytes is required for this regulation. Indeed, although earlier work suggested that Ihh may indirectly regulate PTHrP by signaling through the adjacent perichondrium (Vortkamp et al., 1996) via a secondary signal such as TGFβ2 (Alvarez et al., 2002), a recent report challenged this view as exogenous TGFβ1 failed to activate PTHrP expression in the absence of Ihh signaling in an organ culture model (Koziel et al., 2004). Moreover, although removal of Smo using a Col2-Cre line abolished PTHrP expression in the periarticular chondrocytes but not in the periarticular perichondrium (Long et al., 2001), it could not be conclusive whether the loss of PTHrP was specifically due to the removal of Ihh responsiveness in chondrocytes, as Col2-Cre was also active in at least a subset of perichondrial cells (Long et al., 2004). For the same reason, the loss of columnar region in the growth plate of the Col2-Cre; Smon/c mutant embryo could not be attributed specifically to the removal of Smo in chondrocytes (Long et al., 2006). Thus, a clear delineation of direct effects of Ihh signaling in chondrocytes awaits genetic tools better distinguishing them from perichondrial cells.
Compared to growth plate development, relatively little is understood about endochondral (within the cartilage) bone formation per se. The process begins with vascular invasion of the hypertrophic cartilage and produces the trabecular bone, and is distinct from ossification within the perichondrium that initiates slightly earlier and contributes to the cortical bone. A conventional view holds that the osteoblastic cells (osteoblasts and their progenitors) at both locations differentiate and behave similarly. On the other hand, as the trabecular versus the periosteal bone cells reside in distinct microenvironment, it is conceivable that they are regulated and maintained differently. Recent evidence supports this view as constitutive activation of PTHrP signaling in all osteoblasts in the mouse increased bone formation in the trabecular but not the cortical region (Calvi et al., 2001). However, no molecular features have been reported to distinguish the cortical versus trabecular osteoblastic cells.
Here we report the generation of a transgenic mouse line (Col2-Cre™) that can be used to restrict Cre activity to chondrocytes versus perichondrial cells upon proper administration of tamoxifen (TM). By using the Col2-Cre™ line to locally remove Smo, we have provided evidence that Ihh likely regulates PTHrP expression and chondrocyte morphology in a direct manner. In addition, we demonstrate that the Col2-Cre™ transgene is expressed by a subset of cells that are associated with the trabecular bone surface and possess osteogenic potential.
MATERIALS AND METHODS
Mouse strains
To generate the Col2-Cre™ transgene, a 2 kb cDNA encoding Cre™ (Danielian et al., 1998) was ligated into the EcoRV site of a modified form of the Col2a1 expression vector (Horton et al., 1987). The transgene was released by NotI and EcoRI digestion, purified and injected into the pronuclei of fertilized eggs from CBA/BL6-F1/J females (Jackson Laboratory). Pronuclear injection was performed by the Mouse Genetics Core (Washington University Medical School). Founder mice and their progenies were genotyped by PCR using primers specific for Cre.
Mice carrying Smon (Zhang et al., 2001) or Smoc (Long et al., 2001) alleles were as previously described.
Tamoxifen (TM) administration
TM (Sigma, St. Louis) dissolved in corn oil (Sigma) was injected intraperitoneally into either pregnant females or postnatal pups. For the initial screening of founders, 100 μg TM per gram of body weight was injected into pregnant females. Dosages for other injections were as indicated in each experiment.
Analysis of mouse embryos
Lac Z stainings were performed on either whole embryos or frozen sections. Whole embryos were stained as previously described (Whiting et al., 1991). Frozen sections were prepared and stained using a protocol based on a published procedure (Lobe et al., 1999). The sections were counterstained with nuclear fast red.
For histology and in situ hybridization, limbs were prepared and sectioned as described previously (Hilton et al., 2005; Long et al., 2001). The in situ probe for Colα1(II)A was generously provided by Dr. Linda Sandell (Washington University Medical School) (Zhu et al., 1999). All other in situ hybridization probes were as previously described (Hilton et al., 2005; Long et al., 2001).
For co-localization studies, frozen sections were first stained for Lac Z activity and then subjected to in situ hybridization using 35S-labeled riboprobes. After in situ signals were developed, the sections were counterstained with nuclear fast red.
Bone marrow stromal cell cultures
Bone marrow stromal cells were isolated from the femur and the tibia of 2-month-old mice at 12 hrs after TM administration via oral gavage at 125 μg per gram of body weight. Briefly, upon surgical removal of the epiphyseal ends, the bone shafts were flushed with α-MEM with a 25-gauge needle. Cells from a single mouse were centrifuged, treated with the red blood cell lysis buffer (Roche), rinsed and resuspended in α-MEM containing 20% fetal bovine serum, before being filtered through a 70 μm cell strainer (Falcon) and plated at 2×10⁶/well in 12-well plates. Half of the medium was changed at day 3 and all medium changed at day 6 of culture to remove floating cells. Multiple cultures were performed in parallel for each animal to allow Lac Z staining at different time points. For bone nodule assays, cells cultured to confluence were switched to mineralization medium containing ascorbic acid and β-glycerophosphate, and further cultured for 10 days. For Lac Z staining, the cultures were fixed for 5 minutes before proceeding with the protocol (Lobe et al., 1999). For von Kossa staining, cultures previously subjected to Lac Z staining were incubated with 1% silver nitrate under bright light and finally washed with PBS.
RESULTS
Generation of a Col2-Cre™ transgenic mouse line
To generate genetic tools expressing Cre specifically in chondrocytes but not in perichondrial cells, we seeked to bypass the transient Colα1(II) promoter activity present in the precursors of perichondrial cells. To this end, we took advantage of a modified form of Cre (Cre™) in which the recombinase was fused to a mutated ligand binding domain of the estrogen receptor and rendered inactive but activatable by exogenous TM (Danielian et al., 1998). Specifically, we established transgenic mice (Col2-Cre™) by injecting DNA expressing Cre™ under the Colα1(II) promoter/enhancer (Fig.1A) into the pronuclei of fertilized eggs. Fifteen male founder mice carrying the transgene were obtained and screened by crossing with the Rosa26 reporter (R26R) mouse, which expresses β-galactosidase specifically in cells that presently or previously express Cre activity (Soriano, 1999). Embryos were harvested at E12.5 without exposure to TM and those carrying the genotype of Col2-Cre™; R26R were assayed for “leaky” Cre activity. Through this procedure, 6 founders were found to express at least some level of Cre activity without TM induction, and were therefore eliminated from further analyses. The remaining 9 founders were again crossed with R26R females, which this time received intraperitoneal injections of TM at E10.5; embryos were harvested at E12.5 and assayed for β-galactosidase activity. Two founders that exhibited the most robust TM-dependent β-galactosidase activity were selected for further analyses. Since the two lines behaved identically in all assays, here we only report results obtained from one such line.
Figure 1.
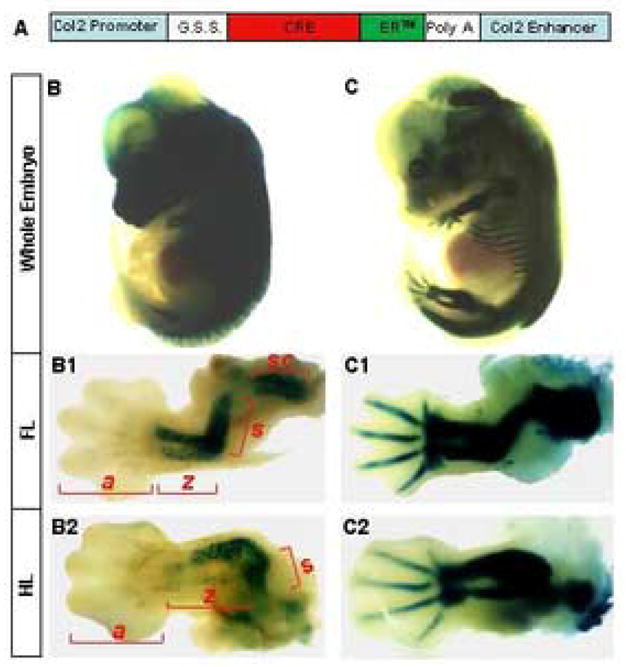
Tamoxifen (TM) inducible Col2-Cre™ transgenic mouse. (A) Schematic of the Col2-Cre™ transgene. G.S.S., β-globin splicing sequence. ER™, Modified form of the estrogen receptor responsive only to exogenous tamoxifen. (B–C) β-galactosidase activity assays (Lac Z staining) indicating induction of Cre by TM in Col2-Cre™; R26R embryos. Whole embryos were stained at E12.5 after pregnant females were injected with 75 μg/g TM (75 μg TM per gram of body weight) at either E9.5 (B) or E10.5 (C). Forelimbs (FL) (B1–C1) and hindlimbs (HL) (B2–C2) were shown at a higher magnification beneath the corresponding whole embryos. a: autopod, z: zeugopod, s: stylopod, sc: scapula.
Temporal control of Cre activity
To assess the onset of the transgene expression during embryogenesis, we generated Col2-Cre™; R26R embryos that were induced with TM at progressively earlier time points and harvested at E12.5 to assay for β-galactosidase activity. With injection at E10.5, we detected Cre activity in all cartilage throughout the embryo (Fig. 1, C). In particular, both forelimbs and hindlimbs expressed robust activities in all skeletal elements (Fig. 1, C1 and C2, respectively). However, when TM was administered at E9.5, in the limb, only the elements including and proximal to the zeugopod exhibited Cre activity, whereas the autopod had little or no activity (Fig. 1, B1 and B2). Earlier injections up to E6.5 produced a similar Lac Z staining pattern to the E9.5 injection (data not shown). In all cases, Col2-Cre™; R26R embryos not induced with TM showed no β-galactosidase activity (data not shown). Thus, expression of the Col2-Cre™ transgene in principle tracks the proximal-to-distal progression of chondrogenesis in the limb.
We next examined whether proper timing of TM administration during embryogenesis could restrict Cre activity to chondrocytes without inducing a significant level in the perichondrium. For consistency we have focused the analyses on the humerus. As preliminary analyses of the embryos induced at E10.5 had revealed Cre activity in both chondrocytes and perichondrial cells (data not shown), we next examined Col2-Cre™; R26R embryos exposed to TM at E11.5, E12.5, E13.5 or E14.5, and harvested at E17.5. With E11.5 injection, the proximal half of the humerus showed robust Cre activity in the chondrocytes (red arrow) in contrast to a minor level in the perichondrium (green arrowhead) (Fig 2, A1), but the distal half still exhibited strong activities in both chondrocytes (red arrow) and the perichondrium (green arrowhead) (Fig. 2, A2). In addition, Cre activity was also evident in the primary spongiosa (purple arrow, Fig. 2, A1) and within the elbow joint capsule (asterisk, Fig. 2, A2). On the other hand, when TM was administered at E12.5, the proximal half showed no detectable Cre activity in the perichondrium (green arrowhead) despite robust levels in chondrocytes (red arrow) (Fig. 2, B1). Within the distal half, Cre activity in both the perichondrium (green arrowhead) and the elbow joint region (asterisk) was markedly reduced (Fig. 2, B2). However, clear Cre activity remained within the primary spongiosa (purple arrow, Fig. 2, B1) (discussed below). Similar results were obtained with TM injection at E13.5 (Fig. 2, C, C1, C2) or E14.5 (Fig. 2, D, D1, D2), but Cre activity in the distal perichondrium was further reduced. Interestingly, a small number of the distal perichondrial cells remained positive even with the later injections; reasons for the discrepancy between distal and proximal perichondrium are not known but may be unique to the humerus, as a similar difference was not evident in the radius or the ulna (supplementary data, Fig. S1). On the other hand, the progressive restriction of Cre activity to chondrocytes and the primary spongiosa was confirmed in other long bones including the radius and the ulna (Fig. S1). Thus, TM administration at or after E12.5 restricted Cre largely to chondrocytes and the primary spongiosa in long bones.
Figure 2.
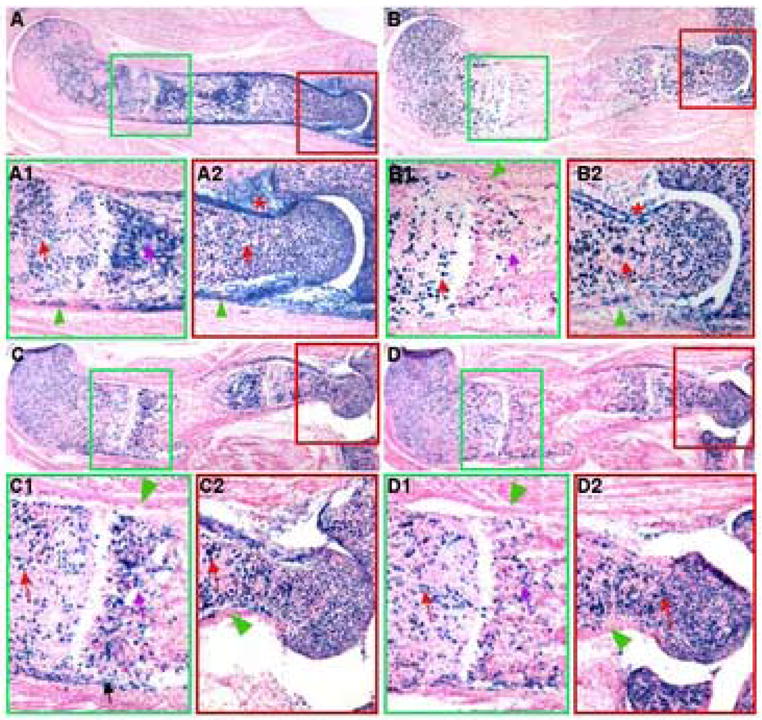
Control of cell-type specific Cre activity in the embryo. Lac Z staining was performed on cryostat longitudinal sections of the humerus from E17.5 Col2-Cre™; R26R embryos. The embryos were harvested after pregnant females were injected with 25 μg/g TM (25 μg TM per gram of body weight) at E11.5 (A), E12.5 (B), E13.5 (C) or E14.5 (D). Green and red boxes in A–D identify areas that are shown below at a higher magnification. The proximal end is to the left in all panels. Red arrows: activity in chondrocytes; purple arrows: activity in primary spongiosa; black arrow: chondrocytes of deltoid tuberocity; green arrowheads: perichondrium; asterisks: activity around joint capsule.
We next assessed whether the Col2-Cre™ line could be useful for postnatal gene removal. To this end, Col2-Cre™; R26R animals were injected TM at postnatal day 12 (P12) and 14 (P14), and then harvested at P16 for Lac Z staining. Strong signals were observed in a large number of chondrocytes at the proximal end of the humerus (Fig. 3, A). In particular, nearly 90% of the columnar chondrocytes expressed robust Cre acvitiy (Fig. 3, A2). Similarly, a high percentage of the articular chondrocytes exhibited strong activities (Fig. 3, A3). In addition, Cre activity was induced within both primary (Fig. 3, A1) and secondary (“2o”, Fig. 3, A) ossification centers. In contrast, TM injection in animals carrying Col2-Cre™ but not the R26R allele did not induce any β-galactosidase activity in any chondrocytes (Fig. 3, B–B3). Similarly, in the absence of TM animals with the genotype Col2-Cre™; R26R did not show any activity in chondrocytes (data not shown). However, the control animals showed a weak β-galactosidase-like activity within both primary and secondary ossification centers (Fig. 3, B and B1). The activity, judged by the intensity of Lac Z staining, was noticeably weaker than that induced by TM, and appeared to be transient because it was not detected either in embryonic bones, or in 2-month-old animals (see below). Overall, successful gene deletion can be achieved in the postnatal cartilage using the Col2-Cre™ transgenic line.
Figure 3.

Induction of Cre activity in postnatal mice. (A, B) Lac Z staining on cryostat longitudinal sections through the proximal end of the humerus from P16 animals. Mice with the genotype of either Col2-Cre™; R26R (A) or Col2-Cre™ (B) were injected 400 μg/g TM (400 μg TM per gram of body weight) at P12 and P14. Color-coded rectangular boxes in A and B identify areas shown at a higher magnification below (A1–A3 and B1–B3 respectively). The proximal end is to the top in all panels. 2o: secondary ossification center.
Expression of Col2-Cre™ in trabecular bone surface cells
The persistent TM-inducible β-galactosidase activity within the ossification centers of Col2-Cre™; R26R animals prompted us to examine whether bone-associated cells expressed the Col2-Cre™ transgene. To confirm that the Lac Z-positive cells in the primary spongiosa were not derived from Lac Z-postive perichondrial cells, we administered TM to Col2-Cre™; R26R embryos at E13.5 to minimize Cre activity in the perichondrium. As expected, when the embryos were assayed at E17.5, virtually no perichondrial cell within the proximal half of the humerus showed any Lac Z activity (green arrowhead, Fig. 4, A, B). However, robust Lac Z staining was detected in the primary spongiosa (purple arrow, Fig. 4, A, B). At a higher magnification, most Lac Z-positive cells appeared to adhere to the surface of the trabecular bone (green contour), assuming either flat (red arrow) or cuboidal (green arrow) morphology (Fig. 4, A1), whereas some others appeared to be osteocytes embedded within the bone matrix (blue arrows, Fig. 4, B1). Thus, in Col2-Cre™; R26R embryos, TM induced Cre activity in trabecular bone-associated cells, independent of the activity in the perichondrium.
Figure 4.
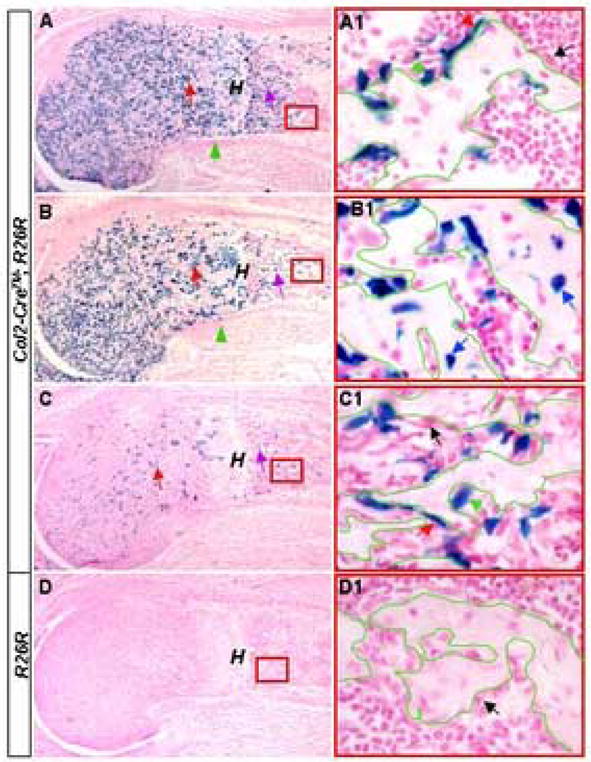
Cre activity in trabecular osteoblast-lineage cells. Lac Z staining on cryostat longitudinal sections through the humerus from E17.5 embryos with the indicated genotypes. The pregnant females were injected with 25 μg/g TM (25 μg TM per gram of body weight) at either E13.5 (A, B) or 6 hours prior to harvest (C, D). The proximal half of the humerus is shown in A–D. Red boxes in A–D indicate areas shown at a higher magnification (A1–D1, respectively). Red arrows in A–C: activity in chondrocytes; purple arrows in A–C: activity in primary spongiosa; green arrowheads in A and B: perichondrium; red arrows in A1 and C1: Lac Z-positive flat cells; green arrows in A1 and C1: Lac Z-positive cuboidal cells; black arrows in A1, C1 and D1: Lac Z-negative cells; blue arrows in B1: Lac Z-positive osteocytes; green contours in A1–D1: outlines of bone surface; H: hypertrophic zone. The proximal end is to the left in all panels.
To exclude the possibility that the Lac Z-positive cells in the primary spongiosa were progenies of chondrocytes that previously expressed Cre, we minimized the time between TM injection and embryo harvest. TM injection 6 hours prior to the harvest at E17.5 induced Cre in a small number of immature chondrocytes (red arrow) and very few hypertrophic cells (“H”) in Col2-Cre™; R26R embryos (Fig. 4, C). However, a significant number of Lac Z-positive cells were detected within the primary spongiosa (purple arrow, Fig. 4, C). Consistent with the earlier observation, most positive cells appeared to associate with the trabecular bone surface (green contour), exhibiting either flat (red arrow) or cuboidal (green arrow) morphology (Fig. 4, C1). However, no Lac Z-positive osteocytes were noticed in these samples (Fig.4, C1, and data not shown), indicating that the positive osteocytes observed earlier were probably progenies of the positive cells on bone surfaces. As a control, a littermate embryo carrying R26R but no Col2-Cre™ did not show any activity in any cells (Fig. 4, D, D1). Furthermore, TM injection 3 hours prior to the harvest also induced Cre activity in trabecular bone surface cells of Col2-Cre™; R26R embryos (data not shown). Finally, Cre activity in these cells was confirmed in a second Col2-Cre™ transgenic line (supplementary data, Fig. S2). Thus, in Col2-Cre™; R26R embryos, a pool of trabecular bone surface cells appears to actively express the transgene.
To examine whether expression of the Col2-Cre™ transgene associated with the trabecular bone reflects endogenous activity of the Colα1(II) promoter, we performed in situ hybridization for Colα1(II) mRNA on sections of developing long bones. In E18.5 embryos, a conventional probe that recognized both the IIA and the IIB form revealed a consistent but relatively weak signal in the trabecular osteoblastic cells, compared to the overwhelming levels in the growth plate chondrocytes (data not shown). On the other hand, a probe exclusively against exon 2 and therefore specific for the IIA splice form detected a markedly stronger signal in the primary spongiosa (green arrow) than in chondrocytes (asterisk), both in the tibia (Fig. 5, A) and in the humerus (data not shown). In addition, Colα1(II)A was also detected on the endosteal surface (black arrow) of the cortical bone, with little, if any, expression on the periosteal surface (purple arrow) (Fig. 5, A). Similar to the Lac Z-positive cells in Col2-Cre™; R26R embryos, the Colα1(II)A-positive cells (red arrow, Fig. 5, A1) represented a subset of cells associated with the trabecular bone surface whereas the others (blue arrow, Fig. 5, A1) did not show any expression. Thus, expression of the Col2-Cre™ transgene in the trabecular bone surface cells likely reflects the endogenous Colα1(II) promoter activity in those cells.
Figure 5.
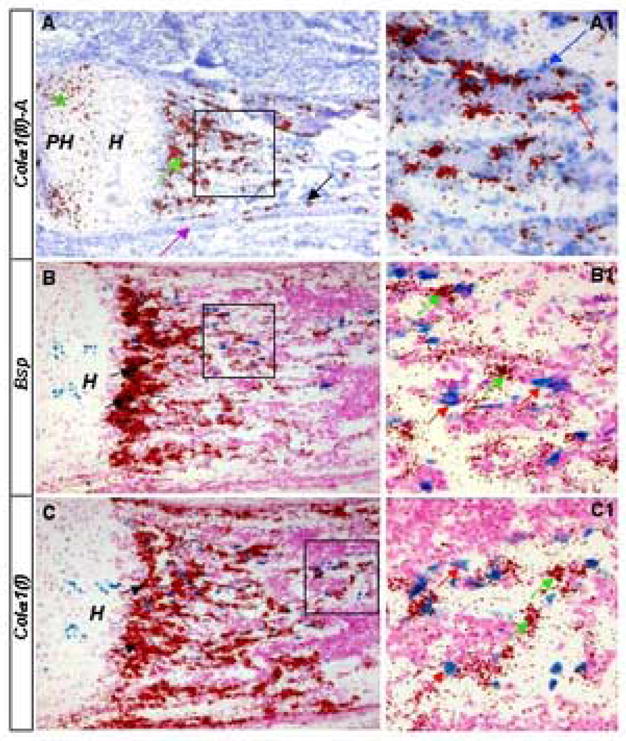
Expression of Colα1(II)A by trabecular osteoblast-lineage cells. (A) In situ hybridization using 35S-labeled riboprobe specific to (II)A on longitudinal sections through the tibia of E18.5 wild type embryos. Signal is in red and counterstain in blue. Black arrow in A: endosteal surface of cortical bone; purple arrow in A: periosteal surface of cortical bone; asterisk in A: signal in chondrocytes; green arrows in A: primary spongiosa; blue arrow in A1: cell without signal; red arrow in A1: cell with signal. (B–C) Lac Z staining followed by in situ hybridization on frozen sections through the humerus of E17.5 Col2-Cre™; R26R embryos induced with 25 μg/g TM for 6 hrs. Lac Z signal in blue, in situ signal in red, counterstain in magenta. Note that bone trabeculae were not stained. Also note that black arrows in B and C point to dark specks representing oversaturated in situ signal not Lac Z staining. Red arrows in B1 and C1: Lac Z-positive cells; green arrows in B1 and C1: high-expressers of Bsp or Colα1(I). The proximal end is to the left in all panels. Boxed regions are shown at a higher magnification to the right (A1–C1). “PH”: prehypertrophic chondrocytes; “H”: hypertrophic chondrocytes.
To explore the molecular identity of the Col2-Cre™-expressing bone surface cells, we examined the expression of Colα1(I) and bone sialoprotein (Bsp), two known osteoblast markers. Specifically, sections from E17.5 Col2-Cre™; R26R embryos induced with TM for 6 hrs were first stained for Lac Z activity and then subjected to in situ hybridization. As expected, both Colα1(I) and Bsp were expressed at high levels in the primary spongiosa (Fig 5, B, C). However, at a higher magnification, it appeared that no Lac Z-positive cells expressed high levels of either osteoblast marker (Fig. 5, B1, C1). Thus, the Col2-Cre™-positive cells associated with the trabecular bone surface appear to be distinct from the cells expressing high levels of Colα1(I) or Bsp.
Osteogenic potential of Col2-Cre™-positive cells
The finding that the Col2-Cre™-expressing cells associate with the bone surface but lack high-level Colα1(I) or Bsp expression prompted us to investigate whether they could be precursors for osteoblasts. To this end, we administered TM at 2 months of age and harvested the animals after 12 hrs. With one hindlimb of each animal, we performed Lac Z staining on sections and confirmed that acute TM treatment induced Lac Z-positive cells on trabecular bone surfaces in the Col2-Cre™; R26R animals (arrows, Fig. 6A′) but not in the Col2-Cre™ controls (Fig. 6B). With the other hindlimb, we isolated and cultured bone marrow stromal cells from the femur and the tibia. Lac Z staining of sub-confluent cultures consistently identified positive cells in the Col2-Cre™; R26R samples (Fig. 6C) but not in the controls (Fig. 6D). Importantly, when confluent stromal cells were further cultured in mineralization media to induce osteoblast differentiation, followed by Lac Z and von Kossa staining, certain von Kossa-positive bone nodules in the Col2-Cre™; R26R cultures were found to consist predominantly of Lac Z-positive cells (Fig. 6E-E′), whereas the control cultures, as expected, did not have any positive cells (Fig. 6F-F′). Thus, Col2-Cre™-positive cells isolated from the bone marrow can differentiate in vitro to produce mineralized matrix, a hallmark of osteoblasts.
Figure 6.
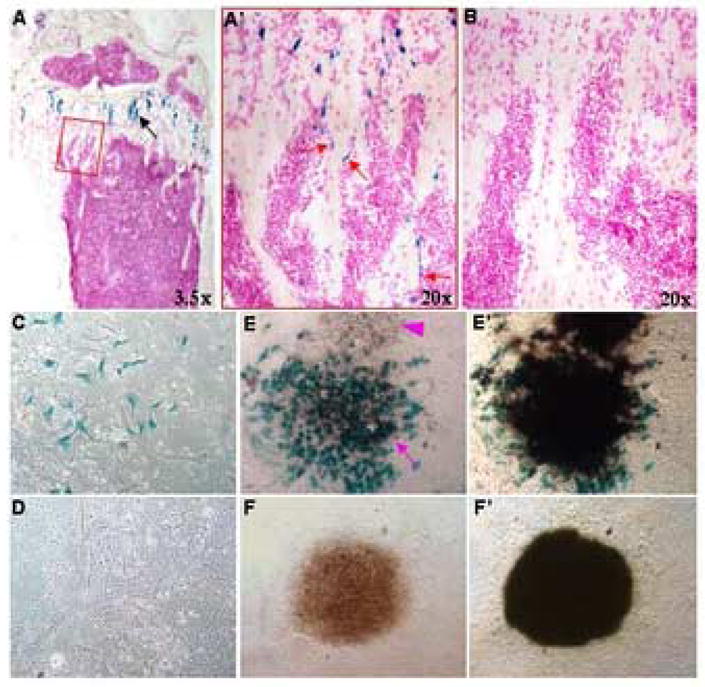
Osteogenic potential of Col2-Cre™-positive cells isolated from the bone marrow. 2-month-old mice were analyzed at 12 hrs after TM delivery via oral gavage at 125 μg per gram of body weight. (A) Lac Z staining on a longitudinal section through the tibia of a Col2-Cre™; R26R mouse. Black arrow denotes Lac Z-positive chondrocytes. (A′) The boxed area in (A) viewed at a higher magnification. Red arrows denote Lac Z-positive cells on trabecular bone surfaces. (B) An equivalent region from a Col2-Cre™ mouse containing no Lac Z-positive cells. (C–D) Lac Z staining of sub-confluent cultures of bone marrow stromal cells isolated from Col2-Cre™; R26R (C) versus Col2-Cre™ (D) animals. (E–F) Lac Z staining of bone nodules from Col2-Cre™; R26R (E) or Col2-Cre™ (F) cultures. Purple arrow denotes a bone nodule consists predominantly of Lac Z-positive cells; purple arrowhead denotes an adjacent nodule with no Lac Z-positive cells. (E′–F′) von Kossa staining of the same bone nodules following Lac Z staining in (E–F).
TM dose-dependence of Cre activity
To explore the potential utility of the Colα1(II)-Cre™ line in gene removal within subsets of chondrocytes, we examined the dose-response of Cre activity to TM. Here, embryos were administered varying amounts of TM at E16.5 and assayed for Cre activity at E17.5. A direct correlation was observed between the TM dosage and the percentage of chondrocytes expressing β-galactosidase in Col2-Cre™; R26R embryos. In particular, whereas a higher dosage induced activity in nearly 80% of the growth region chondrocytes (Fig. 7, A–A2), a lower amount of TM activated Cre in less than 10% of the chondrocytes within the proximal half of the humerus (Fig. 7, B, B1), although a slightly higher percentage was found within the distal growth plate (Fig. 7, B, B2). At the lower dosage, the positive cells were often found in small clusters (red arrow) although single positive cells were also seen at a lower rate (green arrow) (Fig. 7, B1). Thus, the amount of TM positively correlates with the percentage of chondrocytes undergoing Cre recombination in the Col2-Cre™ mouse.
Figure 7.

TM dose-dependence of Cre activity in the embryo. Lac Z staining was performed on cryostat longitudinal sections of the humerus from E17.5 Col2-Cre™; R26R embryos. The embryos were harvested after pregnant females were injected at E16.5 with either 100 (A) or 12.5 (B) μg/g TM (100 or 12.5 μg TM per gram of body weight). Green and red boxes in A and B identify areas shown below at a higher magnification (A1–A2, B1–B2, respectively). The proximal end to the left in all panels. Red arrow: a cluster of positive cells; green arrow: a single positive cell; green arrowheads: residual activity in perichondrium.
Direct regulation of PTHrP expression and chondrocyte morphology by Ihh
To examine the effects of a direct Ihh input in chondrocytes, we genetically removed Smo from subsets of cells within the growth region. To this end, we induced Cre recombination in embryos of Col2-Cre™; Smon/c that carried the Col2-Cre™ transgene, one Smo null allele (Smon) and one Smo conditional allele (Smoc). In particular, we administered an intermediate dose of TM at E11.5 and analyzed at E14.5 the proximal growth plate of the humerus, where Cre induction was found to be largely restricted to chondrocytes (see Fig. 2, A1). Since up-regulation of Patched 1 (Ptch1), a direct transcriptional target of the Hh pathway (Agren et al., 2004), requires Smo function, we have monitored Ptch1 expression to assess the removal of Smo. In the wild type embryo, Ptch1 was detected at high levels in the perichondrium (green arrowheads, Fig. 8, A6) flanking the Ihh-expressing domain (Fig. 8, A5). In addition, Ptch1 was expressed by immature chondrocytes in a graded pattern, with the highest level present in cells adjacent to the Ihh source (Fig. 8, A6). In the TM-induced Col2-Cre™; Smon/c embryos, the high-level expression was maintained in the perichondrium (green arrowheads, Fig. 8, B6, C6), confirming a normal response to Ihh in this tissue. However, groups of immature chondrocytes were found to be devoid of Ptch1 (asterisks, Fig. 8, B6, C6), indicating effective removal of Smo in those cells. Notably, the size and location of the affected region varied between the two Col2-Cre™; Smon/c embryos of the same litter (Fig. 8, B6 vs. C6), revealing a stochastic aspect of TM-induced gene deletion. Overall, proper administration of TM induced deletion of Smo within subpopulations of the growth region chondrocytes without disrupting Ihh signaling in the perichondrium.
Figure 8.

Direct regulation of PTHrP expression and chondrocyte morphology by Ihh. Histology (A1–A3, B1–B3, C1–C3) and in situ hybridization (A4–A7, B4–B7, C4–C7) performed on adjacent longitudinal sections of humerus from E14.5 wild type (WT) (A1–A7) and Col2-Cre™; Smon/c (MT1 and MT2) (B1–B7, C1–C7 respectively) littermate embryos. The embryos were harvested after pregnant females were injected 50 μg/g TM (50 μg TM per gram of body weight) at E11.5. The proximal half of each section is shown with the articular surface to the left. The color-coded boxes in A1–C1 denote areas shown at a higher magnification in A2–A3, B2–B3 and C2–C3, respectively. Red arrows in B2 and C2 denote abnormal chondrocyte morphology; asterisks in B2 and C2 indicate irregular spacing between cells. 35S-labeled probes used for in situ hybridization are as indicated directly above the panels. Signal is in red and counterstain in blue. Orange arrows in B4 and C4 denote ectopic Colα1(X) expression; color-coded contours in A6–A7, B6–B7 and C6–C7 demarcate equivalent areas in adjacent sections; asterisks in B6 and C6 indicate areas devoid of Ptch1 expression; green arrowheads in A6–C6 denote signal in perichondrium.
We next examined the effect of the local removal of Smo on PTHrP expression. For this, in situ hybridization was performed on adjacent sections for Ptch1 and PTHrP. At the proximal end of the humerus of E14.5 embryos, PTHrP was normally detected in a group of periarticular chondrocytes that also expressed a low level of Ptch1 (yellow contour, Fig. 8, A6, A7). Remarkably, in the TM-induced Col2-Cre™; Smon/c embryos, areas devoid of Ptch1 within the periarticular domain showed little to no expression of PTHrP (red contour, Fig. 8, B6, B7), whereas the adjacent domains maintaining low levels of Ptch1 also retained PTHrP expression (purple contour, Fig. 8, B6, B7). Importantly, in embryos where Ptch1 expression was not disturbed in the periarticular area but severely reduced in other domains of the growth region, PTHrP expression was not disrupted (green contour, Fig. 8, C6, C7). In fact, the PTHrP-expressing domain appeared to be expanded in these embryos (Fig. 8, compare A7 and C7), perhaps reflecting further Ihh movement into the periarticular territory (competent to express PTHrP) due to the decrease in sequestration by Ptch1 (Chen and Struhl, 1996). Thus, PTHrP expression by periarticular chondrocytes correlated with their own responsiveness to Ihh, but not with that in the perichondrium or other parts of the growth region.
We next examined whether localized removal of Smo affected the morphology of growth plate chondrocytes in the TM-induced Col2-Cre™; Smon/c embryos. Histology of the humerus revealed obvious anomalies within subdomains of the growth region in the mutant embryo. In particular, certain flat chondrocytes (Fig. 8, A2) were replaced with cells with heterogeneous morphology (red arrows) and irregular spacing (asterisks) in the mutant sample (Fig. 8, B2, C2). The abnormal morphology could not be accounted for by overt acceleration of chondrocyte maturation, as no ectopic expression of Ihh (Fig. 7, B5, C5) or PTHrP-R (data not shown) was detected, and Colα1(X) was only weakly detectable in a scattered subset of the affected cells with no correlation with the size of the cell (orange arrows, Fig. 8, B4, C4, data not shown). Importantly, the anomaly was found exclusively within areas devoid of Ptch1 expression (asterisks, Fig. 8, B6, C6), whereas adjacent regions that maintained Ptch1 expression were not affected (Fig. 8, B3, C3). Thus, removal of Ihh responsiveness from subsets of cells within the growth region locally disrupted the morphology and organization of immature chondrocytes. In summary, these results support the notion that Ihh directly controls both PTHrP expression and chondrocyte morphology in the growth region cartilage.
DISCUSSION
We have described a TM-inducible Col2-Cre™ line that can be used to selectively activate Cre in chondrocytes, overcoming a limitation of current Col2-Cre transgenic lines that express Cre in both chondrocytes and the perichondrium (Long et al., 2004; Sakai et al., 2001). Serendipitously, we found that the new line also targets a subset of cells associated with the trabecular bone surface, likely reflecting the endogenous activity of the Colα1(II) promoter that directs expression of the prechondrogenic Colα1(II)A isoform in these cells. Finally, utilization of the Col2-Cre™ line in localized removal of Smo has provided evidence that direct Ihh input is likely required for both PTHrP expression in the periarticular chondrocytes, and the proper morphology of columnar chondrocytes.
The versatility of the Col2-Cre™ line lies in the fact that both cell type-selectivity (chondrocytes vs. perichondrial cells) and localized activity (subsets of chondrocytes) can be achieved by adjusting the timing or dosage of TM administration. It should be noted however, that although a higher TM dosage generally correlated with more cells expressing Cre activity, certain variability has been observed among embryos from pregnant females receiving the same amount of TM. In addition, the location of Cre-active cells within the growth plate also varied among embryos. These observations reflect a stochastic aspect of TM-mediated Cre activation, likely resulted from the variable availability of TM to each cell especially when a lower dosage was used.
In addition to its utility in embryonic studies, the Col2-Cre™ line also promises to be a useful tool for postnatal genetic studies. In particular, our results with young pups showed that nearly all of columnar chondrocytes activated Cre after receiving two doses of TM. Similarly, a high percentage of the articular chondrocytes exhibited TM-induced Cre activity. Thus the Col2-Cre™ line may be useful for postnatal studies involving either the growth plate or the joints.
Several lines of evidence from the present study support that direct Ihh input is likely required for periarticular chondrocytes to express PTHrP. First, loss of Ihh response in subsets of periarticular chondrocytes correlated with the loss of PTHrP in those cells, whereas cells outside the affected domains maintained their normal PTHrP expression profile. Second, loss of Ihh response in chondrocytes outside the normal PTHrP-expressing periarticular domain did not diminish PTHrP expression. Third, Ihh response in the perichondrium did not correlate with periarticular PTHrP expression. However, the current data does not exclude the possibility that other signals may emanate from within the PTHrP-expressing group of cells and function in either an autocrine or a paracrine manner.
The immediate regulator of PTHrP downstream of Ihh is presently unknown. In an effort to examine potential direct regulation of the PTHrP promoter by Ihh, we identified several putative Gli binding sites approximately 4 kb upstream of the first exon of the murine PTHrP gene. However, studies of promoter fragments containing these potential sites by transient transfections in C3H10T1/2 cells have not revealed a consistent response to exogenous Hh. The most trivial explanation for the negative results is that the Hh responsive elements were not included in the tested fragments. However, since PTHrP promoter activity in the embryonic growth plate generally correlates with low- but not high-level Ihh signaling, as indicated by the low level of Ptch1 in the PTHrP-expressing cells, it is possible that a “proper” level of Hh signaling required for activating PTHrP expression was not achieved in the cell culture model. Finally, Hh may not directly control the promoter activity of PTHrP. Future studies are required to distinguish these possibilities.
The present study indicates that direct Ihh input may be required for the proper morphology of columnar chondrocytes. Local removal of Ihh responsiveness resulted in abnormal cell morphology and disorganization of chondrocytes within the affected regions. Specifically, the number of flat cells was greatly reduced and the normal “stacks” of cells were no longer evident. The morphological defect was reminiscent to that observed in Col2-Cre; Smon/c embryos where the entire columnar region was absent (Long et al., 2006), but the underlying mechanism remains unknown. Ihh could directly control the cell morphology, or, as previously suggested, regulate a “differentiation” process that encompasses the morphological changes (Kobayashi et al., 2005). Alternatively, the loss of flat cells could be secondary to the marked decrease in cell number within the region in the absence of Ihh signaling (Long et al., 2001). In any case, the regulation appears to be mediated by antagonizing Gli3 repressor activity, as removal of Gli3 restored the columnar chondrocytes in the absence of Ihh (Hilton et al., 2005).
Finally, the current study has identified a Col2-Cre™-positive cell population primarily associated with the trabecular, but not the cortical, bone surface. These cells appear to represent only a subset of the bone surface cells, and are morphologically heterogeneous as appearing on tissue sections. The role of these cells in vivo remains unknown at present, but they are capable of producing mineralized bone nodules in vitro. Molecularly, they do not express high levels of Colα1(I) or Bsp. However, it should be noted that in the “co-localization” experiment, tissue sections were first subjected to Lac Z staining prior to in situ hybridization for Colα1(I) or Bsp mRNA. Because we have noticed that the staining procedure notably reduces the in situ hybridization signals, it is possible that the Col2-Cre™-positive cells express a lower level of Colα1(I) or Bsp that is below the current sensitivity threshold. Finally, since the endogenous Colα1(II) promoter is known to be active in skeletal precursors during embryogenesis, the Col2-Cre™-expressing cells may represent a progenitor population uniquely associated with the trabecular bone both in the embryo and in postnatal life. Future studies are necessary to determine whether this is indeed the case.
Supplementary Material
Figure S1 Lac Z staining on a longitudinal section of the forearm from an E17.5 Col2-Cre ™; R26R embryo. The embryo was harvested after the pregnant female was injected with 25 μg/g TM (25 μg TM per gram of body weight) at E13.5 (C). Boxed region in A is shown in B at a higher magnification. Red arrow: activity in chondrocytes; purple arrows: activity in primary spongiosa; green arrowhead: perichondrium. u: ulna; r: radius; h: humerus.
Figure S2 Induction of Cre activity by a second Col2-Cre™ transgenic line. Lac Z staining was performed on a longitudinal section of the humerus from an E17.5 Col2-Cre™; R26R embryo after injection of 25 μg/g TM at E16.5. Red arrow: activity in chondrocytes; purple arrows: activity in primary spongiosa; green arrowhead: perichondrium.
Acknowledgments
We thank Dr. Yoshi Yamada (NIH) for the Colα1(II) expressing vector, Dr. Andrew P. McMahon (Harvard University) for Cre-ER™ cDNA, Dr. Jian Q. Feng (University of Missouri-Kansas City) for a Lac Z staining protocol for bone, and Dr. Linda Sandell (Washington University Medical School) for the IIA-specific Colα1(II) in situ hybridization probe. This work was supported by a NIH grant DK065789 (F.L.) and a NIH postdoctoral training grant 5T32AR07033 (M.J.H.).
Footnotes
Publisher's Disclaimer: This is a PDF file of an unedited manuscript that has been accepted for publication. As a service to our customers we are providing this early version of the manuscript. The manuscript will undergo copyediting, typesetting, and review of the resulting proof before it is published in its final citable form. Please note that during the production process errors may be discovered which could affect the content, and all legal disclaimers that apply to the journal pertain.
References
- Agren M, Kogerman P, Kleman MI, Wessling M, Toftgard R. Expression of the PTCH1 tumor suppressor gene is regulated by alternative promoters and a single functional Gli-binding site. Gene. 2004;330:101–14. doi: 10.1016/j.gene.2004.01.010. [DOI] [PubMed] [Google Scholar]
- Alcedo J, Ayzenzon M, Von Ohlen T, Noll M, Hooper JE. The Drosophila smoothened gene encodes a seven-pass membrane protein, a putative receptor for the hedgehog signal. Cell. 1996;86:221–32. doi: 10.1016/s0092-8674(00)80094-x. [DOI] [PubMed] [Google Scholar]
- Alvarez J, Sohn P, Zeng X, Doetschman T, Robbins DJ, Serra R. TGFbeta2 mediates the effects of hedgehog on hypertrophic differentiation and PTHrP expression. Development. 2002;129:1913–24. doi: 10.1242/dev.129.8.1913. [DOI] [PubMed] [Google Scholar]
- Calvi LM, Sims NA, Hunzelman JL, Knight MC, Giovannetti A, Saxton JM, Kronenberg HM, Baron R, Schipani E. Activated parathyroid hormone/parathyroid hormone-related protein receptor in osteoblastic cells differentially affects cortical and trabecular bone. J Clin Invest. 2001;107:277–86. doi: 10.1172/JCI11296. [DOI] [PMC free article] [PubMed] [Google Scholar]
- Chen Y, Struhl G. Dual roles for patched in sequestering and transducing Hedgehog. Cell. 1996;87:553–63. doi: 10.1016/s0092-8674(00)81374-4. [DOI] [PubMed] [Google Scholar]
- Danielian PS, Muccino D, Rowitch DH, Michael SK, McMahon AP. Modification of gene activity in mouse embryos in utero by a tamoxifen-inducible form of Cre recombinase. Curr Biol. 1998;8:1323–6. doi: 10.1016/s0960-9822(07)00562-3. [DOI] [PubMed] [Google Scholar]
- Hilton MJ, Tu X, Cook J, Hu H, Long F. Ihh controls cartilage development by antagonizing Gli3, but requires additional effectors to regulate osteoblast and vascular development. Development. 2005;132:4339–51. doi: 10.1242/dev.02025. [DOI] [PubMed] [Google Scholar]
- Horton W, Miyashita T, Kohno K, Hassell JR, Yamada Y. Identification of a phenotype-specific enhancer in the first intron of the rat collagen II gene. 1987 doi: 10.1073/pnas.84.24.8864. [DOI] [PMC free article] [PubMed] [Google Scholar]
- Karp SJ, Schipani E, St-Jacques B, Hunzelman J, Kronenberg H, McMahon AP. Indian hedgehog coordinates endochondral bone growth and morphogenesis via parathyroid hormone related-protein-dependent and -independent pathways. Development. 2000;127:543–8. doi: 10.1242/dev.127.3.543. [DOI] [PubMed] [Google Scholar]
- Kobayashi T, Soegiarto DW, Yang Y, Lanske B, Schipani E, McMahon AP, Kronenberg HM. Indian hedgehog stimulates periarticular chondrocyte differentiation to regulate growth plate length independently of PTHrP. J Clin Invest. 2005;115:1734–42. doi: 10.1172/JCI24397. [DOI] [PMC free article] [PubMed] [Google Scholar]
- Koziel L, Kunath M, Kelly OG, Vortkamp A. Ext1-dependent heparan sulfate regulates the range of Ihh signaling during endochondral ossification. Dev Cell. 2004;6:801–13. doi: 10.1016/j.devcel.2004.05.009. [DOI] [PubMed] [Google Scholar]
- Koziel L, Wuelling M, Schneider S, Vortkamp A. Gli3 acts as a repressor downstream of Ihh in regulating two distinct steps of chondrocyte differentiation. Development. 2005;132:5249–60. doi: 10.1242/dev.02097. [DOI] [PubMed] [Google Scholar]
- Lobe CG, Koop KE, Kreppner W, Lomeli H, Gertsenstein M, Nagy A. Z/AP, a double reporter for cre-mediated recombination. Dev Biol. 1999;208:281–92. doi: 10.1006/dbio.1999.9209. [DOI] [PubMed] [Google Scholar]
- Long F, Chung UI, Ohba S, McMahon J, Kronenberg HM, McMahon AP. Ihh signaling is directly required for the osteoblast lineage in the endochondral skeleton. Development. 2004;131:1309–18. doi: 10.1242/dev.01006. [DOI] [PubMed] [Google Scholar]
- Long F, Joeng KS, Xuan S, Efstratiadis A, McMahon AP. Independent regulation of skeletal growth by Ihh and IGF signaling. Dev Biol. 2006;298:327–33. doi: 10.1016/j.ydbio.2006.06.042. [DOI] [PubMed] [Google Scholar]
- Long F, Zhang XM, Karp S, Yang Y, McMahon AP. Genetic manipulation of hedgehog signaling in the endochondral skeleton reveals a direct role in the regulation of chondrocyte proliferation. Development. 2001;128:5099–108. doi: 10.1242/dev.128.24.5099. [DOI] [PubMed] [Google Scholar]
- Ng LJ, Tam PP, Cheah KS. Preferential expression of alternatively spliced mRNAs encoding type II procollagen with a cysteine-rich amino-propeptide in differentiating cartilage and nonchondrogenic tissues during early mouse development. Dev Biol. 1993;159:403–17. doi: 10.1006/dbio.1993.1251. [DOI] [PubMed] [Google Scholar]
- Sakai K, Hiripi L, Glumoff V, Brandau O, Eerola R, Vuorio E, Bosze Z, Fassler R, Aszodi A. Stage-and tissue-specific expression of a Col2a1-Cre fusion gene in transgenic mice. Matrix Biol. 2001;19:761–7. doi: 10.1016/s0945-053x(00)00122-0. [DOI] [PubMed] [Google Scholar]
- Sandell LJ, Morris N, Robbins JR, Goldring MB. Alternatively spliced type II procollagen mRNAs define distinct populations of cells during vertebral development: differential expression of the amino-propeptide. J Cell Biol. 1991;114:1307–19. doi: 10.1083/jcb.114.6.1307. [DOI] [PMC free article] [PubMed] [Google Scholar]
- Sandell LJ, Nalin AM, Reife RA. Alternative splice form of type II procollagen mRNA (IIA) is predominant in skeletal precursors and non-cartilaginous tissues during early mouse development. Dev Dyn. 1994;199:129–40. doi: 10.1002/aja.1001990206. [DOI] [PubMed] [Google Scholar]
- Soriano P. Generalized lacZ expression with the ROSA26 Cre reporter strain. Nat Genet. 1999;21:70–1. doi: 10.1038/5007. [DOI] [PubMed] [Google Scholar]
- St-Jacques B, Hammerschmidt M, McMahon AP. Indian hedgehog signaling regulates proliferation and differentiation of chondrocytes and is essential for bone formation. Genes Dev. 1999;13:2072–86. doi: 10.1101/gad.13.16.2072. [DOI] [PMC free article] [PubMed] [Google Scholar]
- van den Heuvel M, Ingham PW. smoothened encodes a receptor-like serpentine protein required for hedgehog signalling. Nature. 1996;382:547–51. doi: 10.1038/382547a0. [DOI] [PubMed] [Google Scholar]
- Vortkamp A, Lee K, Lanske B, Segre GV, Kronenberg HM, Tabin CJ. Regulation of rate of cartilage differentiation by Indian hedgehog and PTH-related protein. Science. 1996;273:613–22. doi: 10.1126/science.273.5275.613. [DOI] [PubMed] [Google Scholar]
- Whiting J, Marshall H, Cook M, Krumlauf R, Rigby PW, Stott D, Allemann RK. Multiple spatially specific enhancers are required to reconstruct the pattern of Hox-2.6 gene expression. Genes Dev. 1991;5:2048–59. doi: 10.1101/gad.5.11.2048. [DOI] [PubMed] [Google Scholar]
- Zhang XM, Ramalho-Santos M, McMahon AP. Smoothened mutants reveal redundant roles for Shh and Ihh signaling including regulation of L/R asymmetry by the mouse node. Cell. 2001;105:781–92. [PubMed] [Google Scholar]
- Zhu Y, Oganesian A, Keene DR, Sandell LJ. Type IIA procollagen containing the cysteine-rich amino propeptide is deposited in the extracellular matrix of prechondrogenic tissue and binds to TGF-beta1 and BMP-2. J Cell Biol. 1999;144:1069–80. doi: 10.1083/jcb.144.5.1069. [DOI] [PMC free article] [PubMed] [Google Scholar]
Associated Data
This section collects any data citations, data availability statements, or supplementary materials included in this article.
Supplementary Materials
Figure S1 Lac Z staining on a longitudinal section of the forearm from an E17.5 Col2-Cre ™; R26R embryo. The embryo was harvested after the pregnant female was injected with 25 μg/g TM (25 μg TM per gram of body weight) at E13.5 (C). Boxed region in A is shown in B at a higher magnification. Red arrow: activity in chondrocytes; purple arrows: activity in primary spongiosa; green arrowhead: perichondrium. u: ulna; r: radius; h: humerus.
Figure S2 Induction of Cre activity by a second Col2-Cre™ transgenic line. Lac Z staining was performed on a longitudinal section of the humerus from an E17.5 Col2-Cre™; R26R embryo after injection of 25 μg/g TM at E16.5. Red arrow: activity in chondrocytes; purple arrows: activity in primary spongiosa; green arrowhead: perichondrium.