Abstract
Oxidation of the endocannabinoid anandamide by cytochrome P450 (P450) enzymes has the potential to affect signaling pathways within the endocannabinoid system and pharmacological responses to novel drug candidates targeting this system. We previously reported that the human cytochromes P450 2D6, 3A4, and 4F2 are high-affinity, high-turnover anandamide oxygenases in vitro, forming the novel metabolites hydroxyeicosatetraenoic acid ethanolamides and epoxyeicosatrienoic acid ethanolamides. The objective of this study was to investigate the possible biological significance of these metabolic pathways. We report that the 5,6-epoxide of anandamide, 5,6-epoxyeicosatrienoic acid ethanolamide (5,6-EET-EA), is a potent and selective cannabinoid receptor 2 (CB2) agonist. The Ki values for the binding of 5,6-EET-EA to membranes from Chinese hamster ovary (CHO) cells expressing either recombinant human CB1 or CB2 receptor were 11.4 μM and 8.9 nM, respectively. In addition, 5,6-EET-EA inhibited the forskolin-stimulated accumulation of cAMP in CHO cells stably expressing the CB2 receptor (IC50 = 9.8 ± 1.3 nM). Within the central nervous system, the CB2 receptor is expressed on activated microglia and is a potential therapeutic target for neuroinflammation. BV-2 microglial cells stimulated with low doses of interferon-γ exhibited an increased capacity for converting anandamide to 5,6-EET-EA, which correlated with increased protein expression of microglial P450 4F and 3A isoforms. Finally, we demonstrate that 5,6-EET-EA is more stable than anandamide in mouse brain homogenates and is primarily metabolized by epoxide hydrolase. Combined, our results suggest that epoxidation of anandamide by P450s to form 5,6-EET-EA represents an endocannabinoid bioactivation pathway in the context of immune cell function.
The endocannabinoids anandamide and 2-arachidonoyl glycerol, the enzymes involved in their synthesis and degradation, and the cannabinoid CB1 and CB2 receptors are collectively known as the endocannabinoid system. The components of this system are novel pharmacological targets in the treatment of many disorders, including neurodegeneration, chronic pain, inflammation, cancer, and others (Di Marzo, 2008). The CB2 receptor, the main immune cell receptor, which in the brain seems to be primarily expressed on activated microglia, is considered to be a possible therapeutic target for the treatment of central nervous system (CNS) inflammation, including the type of inflammation implicated in the etiology of neurodegenerative disease (Cabral and Marciano-Cabral, 2005; Block et al., 2007; Cabral et al., 2008). CB2-selective agonists have the potential to alleviate inflammation by reducing the secretion of several proinflammatory cytokines while being devoid of the psychotropic activity exhibited by CB1 receptor agonists (Maresz et al., 2005; Sheng et al., 2005; Eljaschewitsch et al., 2006; Shoemaker et al., 2007). A thorough understanding of the metabolic pathways that regulate the endocannabinoid tone in vivo is crucial to the development of novel therapeutic agents that can target the various components of the endocannabinoid system.
We have previously reported that anandamide, a structural relative of arachidonic acid, is oxygenated in vitro by the human cytochrome P450 (P450) enzymes 2D6, 3A4, and 4F2 to yield several metabolites, including 20-hydroxyeicosatetraenoic acid ethanolamide (20-HETE-EA) and the 5,6-, 8,9-, 11,12-, and 14,15-epoxyeicosatrienoic acid ethanolamides (EET-EAs) in human kidney, liver, and brain tissue (Snider et al., 2007, 2008). The purpose of this study was to address the potential pharmacological and physiological significance of these P450-mediated oxidative pathways of anandamide metabolism.
Materials and Methods
Materials. Anandamide, 2-(3-adamantan-1-yl-ureido)-dodecanoic acid (AUDA), 5,6-EET-EA, AM1241, and WIN-55212-2 were purchased from Cayman Chemical (Ann Arbor, MI). Radiolabeled CP-55940 was purchased from PerkinElmer Life and Analytical Sciences (Waltham, MA). The full-length cDNA clones encoding human CB1 and CB2 receptors were purchased from the Missouri S&T cDNA Resource Center (Rolla, MO). Lipofectamine 2000 transfection reagent and Geneticin were purchased from Invitrogen (Carlsbad, CA). Forskolin, 3-isobutyl-1-methylxanthine (IBMX), and ketoconazole were purchased from Sigma-Aldrich (St. Louis, MO). Radioactivity-based cAMP assay kits were purchased from GE Healthcare (Chalfont St. Giles, Buckinghamshire, UK). Recombinant mouse interferon γ (IFNγ) was purchased from R&D Systems (Minneapolis, MN). Monoclonal antibodies against mouse P450 4F13 and rat P450 3A1 and secondary anti-mouse and anti-rabbit horseradish peroxidase-conjugated antibodies were purchased from Abcam (Cambridge, MA). Polyclonal antibody against β-actin (β-actin) was purchased from Santa Cruz Biotechnology (Santa Cruz, CA). All other chemicals were of highest quality and were available from commercial sources.
Cell Culture and Transfection. Chinese hamster ovary (CHO-K1) cells were maintained in 5% CO2 at 37°C in Dulbecco's modified Eagle's medium Nutrient Mixture F-12 supplemented with l-glutamine, 2.438 g/l sodium bicarbonate, 10% fetal bovine serum, penicillin (100 U/ml), and streptomycin (100 μg/ml). Murine microglial BV-2 cells were a gift from Dr. Dennis Selkoe (Harvard Medical School, Boston, MA) and were maintained in Dulbecco's modified Eagle's medium supplemented with l-glutamine, 4.5 g/l d-glucose, 25 mM HEPES, 10% fetal bovine serum, penicillin (100 U/ml), and streptomycin (100 μg/ml). CHO cells were stably transfected with the pcDNA3.1 vector encoding N-terminal 3× hemagglutinin-tagged human wild-type CB1 or CB2 receptor using Lipofectamine 2000 reagent following the manufacturer's protocol for using a 24-well plate format. Stable transformants were selected in growth medium containing Geneticin (0.4 mg/ml). Colonies were picked approximately 2 weeks after transfection and were allowed to expand; then they were tested for expression of CB1 or CB2 protein by Western blot using anti-hemagglutinin antibody. Cell lines containing moderate to high levels of receptor were propagated in Geneticin-containing medium and used for membrane preparations and for cAMP measurements.
Membrane Preparation and Saturation Binding Experiments. Membranes from CHO cells stably expressing either the CB1 (CHO-CB1) or the CB2 (CHO-CB2) receptor were prepared by homogenization in TME buffer (50 mM Tris, 3 mM MgCl2, and 1 mM EDTA, pH 7.4) followed by centrifugation at 1100g for 10 min. The supernatant was collected and centrifuged at 45,000g for 30 min. The pellet was resuspended in TME buffer containing protease inhibitors and the protein concentration measured by the BCA method. Membrane preparations were frozen at -80°C until used for experiments. For saturation binding experiments, the 200-μl reaction mixtures contained TMEB buffer (TME buffer with 0.5% bovine serum albumin), various concentrations of radiolabeled synthetic cannabinoid agonist, CP-55940 (0.02-10 nM), and 5 or 20 μg of membrane protein from CHO-CB1 or CHO-CB2 cells, respectively, in the presence or absence of the synthetic cannabinoid agonist WIN5212-2 (10 μM). The binding reactions were carried out in silanated amber vials in a 30°C shaking water bath for 1 h. Bound radioactivity was separated from unbound ligand on 96-well microplates with hydrophilic GF/C filter mesh well bottoms (Whatman, Florham Park, NJ), which were washed once with 200 μl of TMEB buffer before the application of sample mixtures and washed three to four times with 200 μl of TMEB buffer after sample application. Upon vacuum drying of the filter plate, 50 μl of Microscint 0 reagent was added to each well, and the radioactivity was counted on a TopCount instrument (PerkinElmer Life and Analytical Sciences).
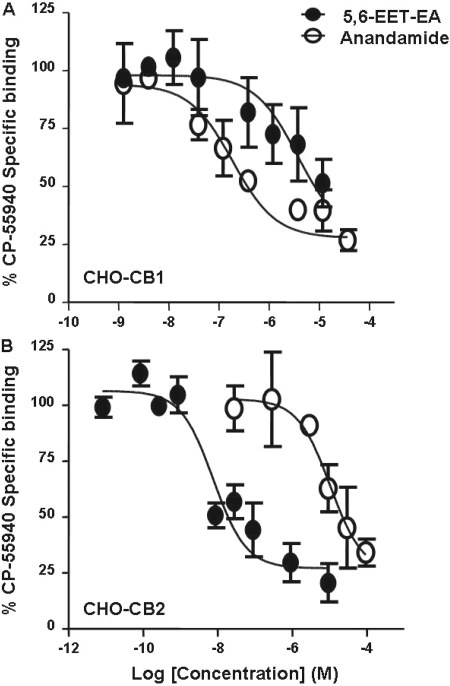
Competition Binding Assays. Competition binding assays were carried out similarly to saturation binding experiments, except the reaction mixtures contained TMEB buffer with 50 μM phenylmethylsulfonyl fluoride, various concentrations of competitor (anandamide or 5,6-EET-EA) as described in the legend to Fig. 1, radiolabeled CP-55940 at its Kd concentration (which was determined to be 5 nM for CHO-CB1 and 1.4 nM for CHO-CB2 membranes), and membrane protein (5 μg from CHO-CB1 and 20 μg from CHO-CB2 cells). Radiolabeled CP-55940 binding in the presence of 10 μM concentration of the synthetic cannabinoid WIN-55212-2 and the absence of any competitor was considered to be nonspecific.
Fig. 1.
Binding of anandamide and 5,6-EET-EA to human CB1 and CB2 receptors. Membrane protein from CHO cells stably expressing either the human CB1 (A) or the human CB2 receptor (B) were incubated with radiolabeled CP-55940 at its Kd value (5.1 nM for CB1 and 1.4 nM for CB2) in the presence of vehicle (ethanol) or various concentrations of anandamide or 5,6-EET-EA (0.3 nM to 100 μM), and the reactions were allowed to reach equilibrium. The binding of CP-55940 in the presence of a saturating concentration (10 μM) of the cannabinoid agonist WIN-55212-2 was considered to be due to nonspecific binding. The specific binding in the presence of the various concentrations of competitor was expressed as a percentage of the specific binding in the presence of vehicle.
cAMP Inhibition Assays. CHO-K1 or CHO-CB2 cells were plated onto 24-well plates in regular growth medium, which was replaced with serum-free medium on the day of the experiment for 1 h before the addition of drugs. At this point, the cells were at 80 to 90% confluence. Cells were treated with either medium alone (control) or medium containing 10 μM forskolin and 100 μM IBMX and varying doses (10 pM-1 nM) of the synthetic, CB2-selective agonist AM1241 (dissolved in DMSO) or 5,6-EET-EA (dissolved in ethanol). The final vehicle concentration was less than 0.04%. Upon the addition of the treatments, the cells were placed back in the 37°C incubator for a total of 10 min, after which the medium was aspirated and replaced with a 3% solution of perchloric acid (1 ml/well). After allowing time for solubilization (1 h at 4°C), the samples were neutralized with a 2.5 M solution of potassium bicarbonate. cAMP levels were measured using a kit from GE Healthcare according to the manufacturer's instructions.
Whole-Cell Metabolism Assays. BV-2 microglial cells were plated onto 100-mm dishes in regular growth medium, which was replaced with serum-free medium when the cells reached 60 to 70% confluence. Two hours later, either medium alone or medium containing IFNγ (10 ng/ml final concentration) was added, and the cells were incubated for 24 h. After the 24-h cell activation, the medium was aspirated and replaced with serum-free medium containing 10 or 20 μM anandamide (as specified in the figure legends), and the cells were placed back in the incubator for 45 min to allow for metabolism to occur. The P450 3A inhibitor ketoconazole (0.5 μM) was added together with anandamide in some experiments. The anandamide-containing medium, into which the cells were scraped, was collected, and the cells were subjected to two to three freeze-thaw cycles alternating between dry ice and a 37°C water bath to ensure cell lysis. The samples were spiked with 100 pmol of deuterated anandamide (internal standard) and extracted with 4 volumes of ethyl acetate, which was subsequently dried down. The samples were then resuspended in 50 μl of methanol and subjected to electrospray ionization liquid chromatography mass spectrometry (ESI-LC/MS) analysis as described previously (Snider et al., 2007). Standard curves for 5,6-EET-EA and 20-HETE-EA were generated by injecting various known amounts of the authentic standards. Linear regression analysis was performed after the peak area was expressed as a function of the amount injected.
Immunoblot Experiments. BV-2 microglial cells were plated onto 60-mm dishes and activated with IFNγ or lipopolysaccharide (LPS) for 24 h as described above. The medium was aspirated, and the cells were lysed by incubating in radioimmunoprecipitation assay buffer (50 mM Tris-HCl, pH 8, 150 mM NaCl, 1% Nonidet P-40, 0.5% sodium deoxycholate, and 0.1% SDS) containing protease inhibitors at 4°C with constant agitation. The lysates were centrifuged at 12,000 rpm for 15 min. The supernatants were removed, and the protein concentration was measured using the BCA method. The protein mixture from the cell lysates (60 μg of protein per well) was separated on a 4 to 20% SDS-polyacrylamide gel electrophoresis and subsequently transferred onto a polyvinylidene difluoride membrane. The membranes were probed with antibodies against P450 4F13, P450 3A1, or β-actin followed by horseradish peroxidase-conjugated secondary antibodies, and the signals were detected using the enhanced chemiluminescence system.
Degradation of Anandamide and 5,6-EET-EA in Mouse Brain Homogenates. Brains from BALB/c mice were collected, quick-frozen on dry ice, and stored at -80°C until use. The brain tissue was homogenized in potassium phosphate buffer, pH 7.4, using a Polytron homogenizer. Protein concentrations were measured using the BCA method. Anandamide or 5,6-EET-EA (5 μM) was incubated in the presence of the mouse brain homogenate (0.5 mg protein/reaction) in phosphate buffer at 37°C for 0 to 180 min. The soluble epoxide hydrolase inhibitor AUDA was included in some incubations, as specified in the figure legends. At the designated time points and after the addition of internal standard, reaction mixtures were extracted with 3 volumes of ethyl acetate, dried down, and resuspended in 100 μl of methanol followed by ESI-LC/MS analysis. Control experiments contained the same components with the exception that the brain homogenate was first heat-inactivated by boiling for 10 min.
Data Analysis. Western blot band densities were quantitated using Photoshop CS2 (Adobe Systems, San Jose, CA). Nonlinear regression and statistical analyses of the data were performed using Prism version 5.01 for Windows (GraphPad Software Inc., San Diego, CA).
Results
5,6-EET-EA Selectively Binds the Human CB2 Receptor with High Affinity. To understand the potential physiological and pharmacological relevance of the P450-mediated oxidation of anandamide, we compared the binding affinities of anandamide and its epoxygenated metabolite 5,6-EET-EA for the human CB1 and CB2 receptors. The ligand binding assay used the ability of the two molecules to compete with radiolabeled CP-55940, a synthetic nonselective cannabinoid, for binding to the receptors. The sources for the CB1 and CB2 proteins were membrane preparations from CHO cells stably expressing the receptors (CHO-CB1 and CHO-CB2). The presence of the CB1 or CB2 receptors in the membrane preparations was confirmed by Western blot and saturation binding experiments (data not shown) as described under Materials and Methods. From the saturation binding experiments, the receptor densities (Bmax) were found to be 4900 ± 222 and 961 ± 54 fmol/mg for CHO-CB1 and CHO-CB2 membrane preparations, respectively. The Kd values for CP-55940 binding to the receptors were 5.1 ± 1.1 and 1.4 ± 0.1 nM for CB1 and CB2, respectively.
As shown in Fig. 1A, the anandamide metabolite 5,6-EET-EA bound more weakly to the CB1 receptor relative to anandamide, as evidenced by the Ki values obtained from the competition curves, which were 155 nM and 3.2 μM for anandamide and 5,6-EET-EA, respectively. In contrast, the metabolite displayed a significantly higher affinity for the CB2 receptor relative to anandamide, as can be seen from the competition curves in Fig. 1B. In this case, the Ki values obtained were 8.9 nM and 11.4 μM for 5,6-EET-EA and anandamide, respectively.
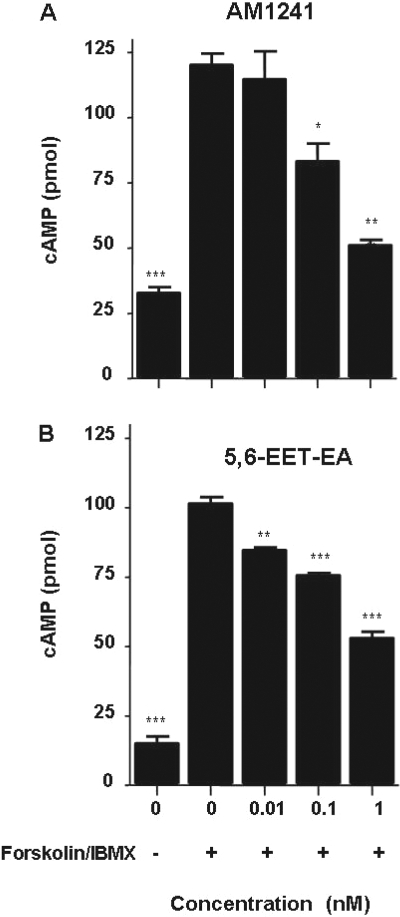
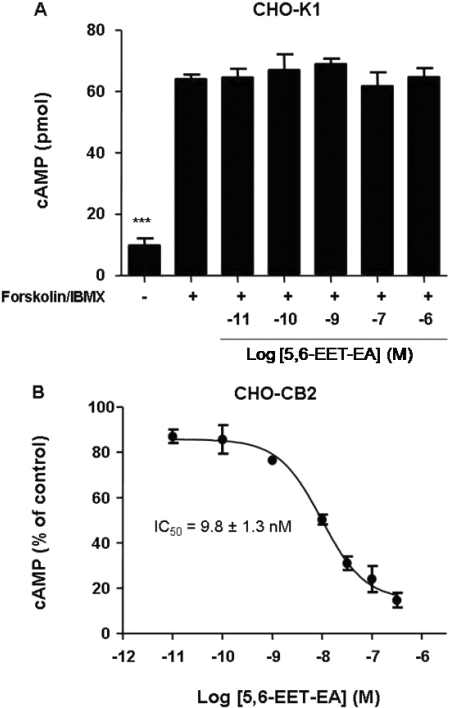
5,6-EET-EA Is an Agonist at the Human CB2 Receptor. To determine whether binding of 5,6-EET-EA to CB2 leads to functional activation of the receptor, we again used the CHO-CB2 cells and monitored intracellular cAMP levels. The CB2 receptor is G-protein-coupled, and its activation by agonists leads to inhibition of the accumulation of cAMP within cells via its associated G-proteins Gαi/o (Howlett, 2005). As a positive control, we used the synthetic CB2-selective agonist AM1241. As shown in Fig. 2A, short-term (10-min) treatment of the CHO-CB2 cells with the adenylyl cyclase activator forskolin and the phosphodiesterase inhibitor IBMX led to a significant increase in intracellular cAMP levels. Cotreatment of the forskolin/IBMX-stimulated cells with low doses of AM1241 caused a dose-dependent decrease in the cAMP levels. Likewise, cotreatment of the CHO-CB2 cells with the same low doses of 5,6-EET-EA also decreased the intracellular cAMP levels (Fig. 2B). The inhibition of cAMP was due solely to CB2 receptor activation, because cotreatment of forskolin/IBMX-stimulated untransfected CHO-K1 cells with varying doses of 5,6-EET-EA had no effect upon cAMP levels (Fig. 3A), which was similar to results that were obtained using the CHO-CB1 cells (data not shown). The IC50 value for the 5,6-EET-EA-mediated inhibition of cAMP in the CHO-CB2 cells was estimated to be 9.8 ± 1.3 nM (Fig. 3B), which is comparable with the Ki value of 8.9 nM for the binding of 5,6-EET-EA to the CB2 receptor.
Fig. 2.
Inhibition of cAMP accumulation in CHO-CB2 cells by AM1241 and 5,6-EET-EA. cAMP levels were measured in CHO-CB2 cells that were either untreated or treated with 10 μM forskolin and 100 μM IBMX in the presence or absence of AM1241 (A) or 5,6-EET-EA (B) for 10 min. Control cells (0, -) received medium alone. The results are the mean ± S.E. of triplicate cultures. *, p < 0.05; **, p < 0.01; ***, p < 0.001, compared with vehicle (0,+) group.
Fig. 3.
Effect of 5,6-EET-EA on intracellular cAMP levels in CHO-K1 and CHO-CB2 cells. cAMP levels were measured in untreated or CHO-K1 (A) or CHO-CB2 (B) cells treated with 10 μM forskolin and 100 μM IBMX in the presence or absence of various doses of 5,6-EET-EA for 10 min. Control cells (-) received medium alone. The results are the mean ± S.E. of triplicate cultures. ***, p < 0.001 compared with vehicle (+) group.
IFNγ-Stimulated BV-2 Microglial Cells Have Increased Capacity for Metabolizing Anandamide to 5,6-EET-EA. The CB2 receptor is primarily expressed on immune cells, including microglia, which are the resident macrophage-like cells in the brain. Microglia become activated in almost all brain pathologies and have been implicated in CNS inflammation related to neurodegeneration (Gao and Hong, 2008). Upon stimulation with IFNγ, a pleiotropic cytokine released by dendritic, natural killer, and T cells, microglia acquire antigen presentation capacity (“primed” phenotype), and while in this state, expression of the microglial CB2 receptor has been found to be significantly up-regulated (Carlisle et al., 2002; Maresz et al., 2005). It is possible that in addition to CB2 receptor up-regulation, primed microglia also synthesize signaling mediators that can act upon CB2.
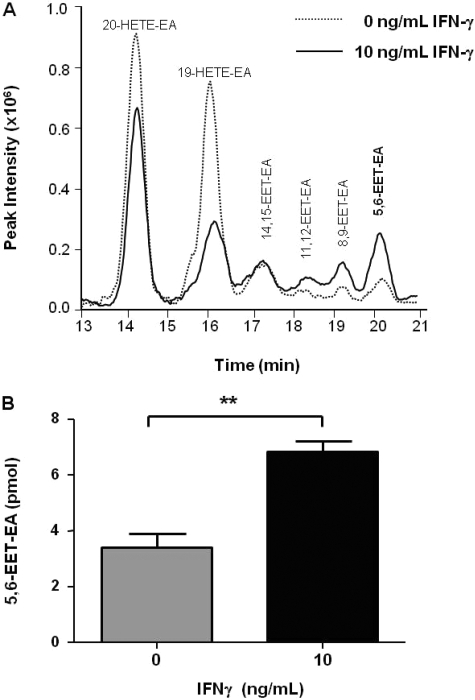
To determine whether microglia produce more of the CB2 agonist 5,6-EET-EA after exposure to IFNγ, we conducted in vitro whole-cell metabolism experiments. For these studies, we used the BV-2 murine microglial cells, which have been extensively studied because they possess many characteristics of primary microglia (Bocchini et al., 1992). Either unstimulated or BV-2 cells stimulated with 10 ng/ml IFNγ for 24 h were exposed to 20 μM anandamide for 45 min, after which the production of anandamide metabolites by the cells was determined as described under Materials and Methods. A representative chromatogram for anandamide metabolism from this experiment is shown in Fig. 4A. Characteristic peaks for the P450-derived anandamide metabolites having mass to charge (m/z) ratios of 364, which we have described previously (Snider et al., 2007), were observed in samples from unstimulated and IFNγ-stimulated cells. No such peaks were seen when the anandamide-containing medium was incubated in the absence of cells (data not shown). Changes in the levels of formation of each metabolite were observed between the two treatments with the two hydroxylated products decreasing (20-HETE-EA and 19-HETE-EA) and the four epoxygenated products primarily increasing in intensity (11,12-, 8,9-, and 5,6-EET-EA). Of particular importance is the observation that the increase in formation of the CB2 agonist 5,6-EET-EA by the stimulated cells was highly reproducible and statistically significant, as shown in Fig. 4B, suggesting that the expression of certain P450 isoforms that metabolize anandamide may be up-regulated in the IFNγ-stimulated microglia.
Fig. 4.
Metabolism of anandamide by microglial cells in culture. Unstimulated or BV-2 microglial cells stimulated with IFNγ (10 ng/ml) for 24 h were incubated in serum-free medium containing anandamide (20 μM) for 45 min. Metabolites were extracted and analyzed by ESI-LC/MS as described under Materials and Methods. A, selected ion chromatogram showing monooxygenated anandamide metabolites with mass to charge (m/z) ratios of 364. B, quantitation of 5,6-EET-EA based on a standard curve generated using an authentic standard. The results are the mean ± S.E. from triplicate cultures. **, p < 0.01.
Expression of Anandamide-Metabolizing P450 Isoforms in Microglia Is Increased upon Exposure to IFNγ. We have previously reported on the participation of human P450s 2D6, 3A4, and 4F2 in the metabolism of anandamide (Snider et al., 2007, 2008). Therefore, we wanted to determine whether P450s belonging to these same subfamilies were up-regulated in the mouse microglial cells upon IFNγ treatment. BV-2 microglial cells were stimulated as described under Materials and Methods. Because bacterial LPS has previously been shown to induce several mouse P450 4F isoforms (Cui et al., 2001), we also included LPS treatment in the analysis of P450 4F expression as a positive control.
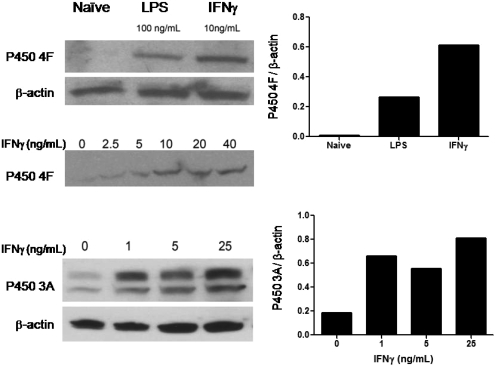
Although the commercial antibody used in the experiments was designed to recognize the mouse P450 4F13 protein, this antibody is likely to cross-react with other mouse 4F isoforms, such as 4F16 and 4F17, because of their high sequence similarities. Because of this reason, the microglial protein detected by this antibody is referred to as P450 4F. As shown in Fig. 5A, the presence of P450 4F was almost undetectable in the unstimulated microglia. However, a band migrating at approximately 50 kDa was detected in the LPS- and, more strongly, the IFNγ-stimulated cells. Quantitation of the bands revealed that, relative to the unstimulated (naive) group, there was approximately a 40- and a 90-fold increase in the expression of P450 4F in the LPS- and IFNγ-treated cells, respectively. Furthermore, the level of P450 4F expression was dependent on the IFNγ dose used to activate the cells (Fig. 5A).
Fig. 5.
Induction of anandamide-metabolizing cytochrome P450 enzymes in activated microglial cells. Mouse microglial BV-2 cells were stimulated for 24 h with the treatments indicated. Whole-cell lysates (60 μg protein/lane) from the BV-2 cells were separated on a 4 to 20% SDS-polyacrylamide gel electrophoresis and transferred onto polyvinylidene difluoride membranes. The membranes were probed with antibodies against either P450 4F (A), P450 3A (B), or β-actin (A and B) followed by horseradish peroxidase-conjugated secondary antibodies. The signals were detected using the enhanced chemiluminescence system, and band densities were quantitated as described under Materials and Methods. Shown are data obtained from individual experiments with a single replicate per treatment and are representative of at least four independently performed experiments.
The expression of mouse P450 3A protein in the BV-2 cells was detected with a commercial antibody raised against full-length rat liver P450 3A1, which cross-reacts with mouse 3A proteins. Consistent with previous reports by others (Matheny et al., 2004), we also detected a double band of 3A protein around 50 kDa using the antibody against P450 3A1, which is most likely due to the presence of multiple 3A isoforms in mouse cells. Similar to P450 4F, mouse microglial P450 3A isoforms were induced in a dose-dependent manner by IFNγ treatment (Fig. 5B). Quantitation of the immunoblots revealed a 3- to 4-fold increase in P450 3A protein in the cells stimulated with the low doses of IFNγ relative to the unstimulated cells. As a loading control, immunoblots for β-actin were performed, which demonstrated that the observed differences in the expression levels of P450s 3A and 4F were not due simply to differences in the amounts of protein loaded onto the gel. The expression of mouse P450 2D protein seemed to be very low and we were unable to detect any significant changes among the different treatment groups (data not shown).
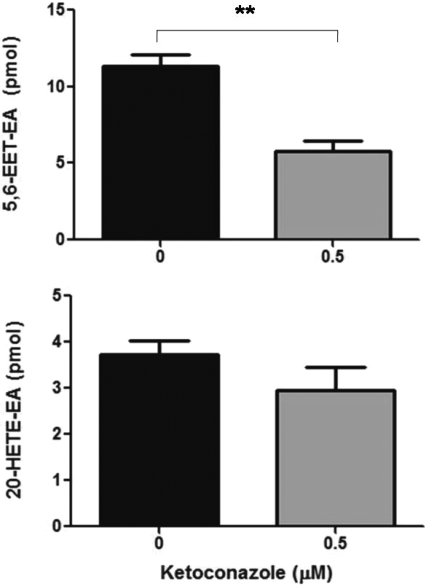
Because P450 3A was previously implicated in anandamide metabolism by mouse liver and brain microsomes (Bornheim et al., 1995), and because we have shown that human P450 3A4 is the primary anandamide epoxygenase (Snider et al., 2007), we wanted to determine whether P450 3A is also involved in the formation of 5,6-EET-EA by the mouse microglial cells. As shown in Fig. 6A, coincubation of the IFNγ-activated BV-2 cells with anandamide and 0.5 μM concentration of the antifungal drug ketoconazole, a potent P450 3A inhibitor, resulted in approximately a 2-fold decrease in 5,6-EET-EA formation. The 0.5 μM concentration was chosen because it corresponds approximately to the Ki value of ketoconazole for P450 3A (Brown et al., 2007) and because at that concentration, ketoconazole is less likely to significantly affect the activity of other P450s. As shown in Fig. 6B, there was a slight but statistically insignificant decrease in 20-HETE-EA formation in the presence of ketoconazole treatment. This demonstrates the selectivity of ketoconazole for the inhibition of a P450 anandamide epoxygenase (presumably P450 3A) over another P450 isoform that is involved in anandamide hydroxylation.
Fig. 6.
The effect of ketoconazole upon 5,6-EET-EA and 20-HETE-EA formation by IFNγ-stimulated BV-2 microglia. BV-2 cells stimulated with IFNγ (10 ng/ml) for 24 h were incubated in serum-free medium containing anandamide (10 μM) and either DMSO vehicle (0.01%) or 0.5 μM ketoconazole for 45 min. Metabolites were extracted and analyzed by ESI-LC/MS as described under Materials and Methods. Quantitation of 5,6-EET-EA and 20-HETE-EA was performed based on standard curves generated by using authentic standards. The results are the mean ± S.E. from triplicate cultures. **, p < 0.01.
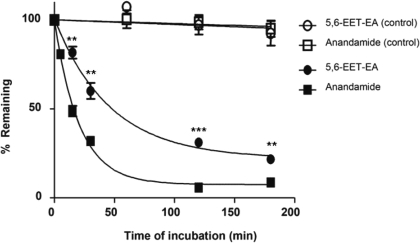
5,6-EET-EA Has Increased Stability in Mouse Brain Homogenates Relative to Anandamide. Anandamide is known to be extensively degraded by the enzyme fatty acid amide hydrolase (FAAH), which is abundantly expressed in the brain (Giang and Cravatt, 1997). To compare the relative stabilities of anandamide and its CB2 agonist metabolite 5,6-EET-EA, we incubated each molecule in mouse brain homogenates for 0 to 180 min and monitored the amount remaining as described under Materials and Methods. As a control, we used heat-inactivated protein in the incubations. As can be seen in Fig. 7, neither molecule was significantly degraded in the control samples. This was in contrast to samples that contained active mouse brain proteins in which both anandamide and 5,6-EET-EA disappeared over time. It is noteworthy that however, the decrease in the level of 5,6-EET-EA was significantly slower than that of anandamide at each time point. The estimated half-lives were 32.2 and 14.3 min for 5,6-EET-EA and anandamide, respectively. Because the plateau of the decay curve for anandamide was approximately 7% compared with 22% for 5,6-EET-EA, the stability difference may be even greater than what is simply estimated by the respective half-lives.
Fig. 7.
Degradation of anandamide and 5,6-EET-EA by mouse brain proteins. Anandamide or 5,6-EET-EA (5 μM) were incubated in the presence of mouse brain homogenate (0.5 mg protein/reaction) in phosphate buffer, pH 7.4, at 37°C for 0 to 180 min. At the designated time points and after the addition of internal standard, the reaction mixtures were extracted with 3 volumes of ethyl acetate and analyzed by ESI-LC/MS as described under Materials and Methods. The amounts of 5,6-EET-EA or anandamide remaining at each time point were plotted as a percentage of the starting amount (at time 0). Control samples contained 0.5 mg of heat-inactivated mouse brain homogenate. **, p < 0.01; ***, p < 0.001 compared with the anandamide group at the same time point.
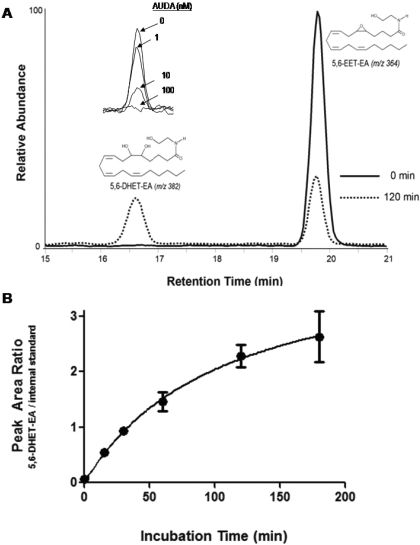
We previously reported that the human liver microsomal P450-derived epoxides of anandamide are further metabolized by epoxide hydrolase to their corresponding dihydroxy derivatives, which have m/z ratios of 382, corresponding to the mass of the EET-EA metabolite plus a water molecule (Snider et al., 2007). Because epoxide hydrolase is also expressed in brain (Shin et al., 2005; Sura et al., 2008), we monitored the formation of 5,6-dihydroxyeicosatrienoic acid ethanolamide (5,6-DHET-EA) in the mouse brain incubations, to which we added 5,6-EET-EA. We found that the amount of 5,6-DHET-EA increased over time as the amount of 5,6-EET-EA decreased. This can be seen in Fig. 8A, which shows the peaks for the two ions from representative incubations at times 0 and 120 min. In addition, as shown in the inset to Fig. 8A, the formation of 5,6-DHET-EA was dose-dependently inhibited by the soluble epoxide hydrolase inhibitor AUDA, which was used at concentrations between 1 and 100 nM. The time-dependent formation of the 5,6-DHET-EA peak normalized to internal standard is shown in Fig. 8B. Under the conditions used in our experiment, we did not observe significant formation of 5,6-EET, which would be a product of 5,6-EET-EA formed via hydrolysis by FAAH, suggesting that in the brain, 5,6-EET-EA is degraded almost exclusively by epoxide hydrolase and not by FAAH.
Fig. 8.
Mouse brain epoxide hydrolase converts 5,6-EET-EA to 5,6-DHET-EA. 5,6-EET-EA (5 μM) was incubated in the presence of mouse brain homogenate (0.5 mg protein/reaction) in phosphate buffer, pH 7.4, at 37°C for 0 to 180 min. Reaction mixtures were extracted with 3 volumes of ethyl acetate and analyzed by ESI-LC/MS as described under Materials and Methods. A, selected ion chromatograms of 5,6-EET-EA and its epoxide hydrolase-derived metabolite 5,6-DHET-EA at times 0 and 120 min. A, inset, 5,6-DHET-EA formation in the presence of various concentrations (1-100 nM) of the soluble epoxide hydrolase inhibitor AUDA. B, time course for the formation of 5,6-DHET-EA from 5,6-EET-EA.
Discussion
Since the initial discovery of the receptors for the main psychoactive constituent in marijuana, Δ9-tetrahydrocannabinol, and the subsequent identification of anandamide and 2-arachidonoylglycerol as the endogenous ligands to these receptors (Devane et al., 1988, 1992; Kaminski et al., 1992; Mechoulam et al., 1995), much work has been done to understand the role of the endocannabinoid signaling system because it seems to be involved in controlling physiological homeostasis, and it is dysregulated in numerous pathological conditions (Di Marzo, 2008). Progress in the development of novel therapeutics designed to manipulate the various components of this system is largely dependent on a comprehensive understanding of the various metabolic pathways that exert control over the action of endocannabinoids.
The evidence thus far suggests that anandamide is produced on demand and acts locally, most probably due to its lipophilic character. Its duration of action is relatively short because it is rapidly metabolized by FAAH to arachidonic acid and ethanolamine. A protective role for anandamide in several pathologies, including pain, inflammation, and anxiety, has been clearly demonstrated, and inhibitors of FAAH are being developed for the treatment of these disorders (Cravatt and Lichtman, 2003). Increases in the endogenous levels of anandamide via inhibition of the primary enzyme responsible for its metabolic inactivation would prolong its action but would also increase the likelihood for anandamide to undergo oxidation by a number of fatty acid oxygenases, including cyclooxygenase-2, lipoxygenase, and the cytochrome P450 enzymes. Understanding the biological significance of the oxidative pathways would lead to a better understanding of the actions of these novel drug candidates. Indeed, recent work with the cyclooxygenase-2 and lipoxygenase enzymes has already started to shed light on this topic (Craib et al., 2001; Woodward et al., 2008).
Here we report on the ability of the P450-derived, 5,6-epoxide of anandamide (5,6-EET-EA) to bind and to functionally activate the recombinant human CB2 receptor expressed in CHO cells. In our studies the 5,6-EET-EA exhibited greater than a 300-fold selectivity for binding to CB2 over CB1, and its affinity for CB2 was more than 1000-fold greater than that of the parent molecule, anandamide. We also demonstrate that murine microglial BV-2 cells metabolize anandamide and that they produce significantly more 5,6-EET-EA after stimulation with the cytokine IFNγ. This increase in 5,6-EET-EA formation corresponded with an increase in the protein levels of P450s 3A and 4F in the IFNγ-stimulated microglia. In addition, incubations of anandamide and 5,6-EET-EA with mouse brain homogenates revealed that the 5,6-EET-EA has a significantly increased biological stability compared with anandamide and that it is primarily metabolized by epoxide hydrolase to form 5,6-DHET-EA. The combination of our previous findings showing that several P450s are high-affinity, high-turnover anandamide oxygenases (Snider et al., 2007, 2008) combined with the current data showing that the P450-derived anandamide metabolite 5,6-EET-EA activates the CB2 receptor at sub- and low nanomolar concentrations and has higher biological stability than anandamide leads us to conclude that oxidation of anandamide by P450s is not only likely to occur under physiological conditions but that it also may have important functional consequences.
The data demonstrating that the anandamide-metabolizing P450s are induced in IFNγ-stimulated microglial cells points to the possible involvement of the P450 monooxygenases in mediating neuroimmune interactions. Because the expression of P450 4F increased in the IFNγ-stimulated cells (Fig. 5A), whereas the formation of the HETE-EA metabolites of anandamide decreased under these conditions (Fig. 4A), we could speculate that the murine 4F enzymes, unlike the human 4F2, are not anandamide hydroxylases. However, this hypothesis needs to be further investigated. On the other hand, a 3- to 4-fold induction of P450 3A expression concomitant with a 2-fold increase in 5,6-EET-EA formation by the activated microglia, and inhibition of 5,6-EET-EA formation by ketoconazole, strongly suggest a role for P450 3A in the formation of this metabolite. This conclusion is further supported by the previously published data on the involvement of P450 3A in anandamide metabolism in the mouse brain and liver (Bornheim et al., 1995). Lack of detection of P450 2D expression in the microglia is consistent with the primarily neuronal localization of this protein within the CNS (Siegle et al., 2001; Funae et al., 2003).
The data supporting a role for epoxide hydrolase in the metabolism of 5,6-EET-EA may lead to a better understanding of the physiological mechanisms of action of epoxide hydrolase inhibitors. Soluble epoxide hydrolase metabolizes several fatty acid epoxides, which are known to have vasodilatory properties (Imig, 2005). Therefore, pharmacological inhibition of this enzyme is a promising avenue for the treatment of hypertension (Chiamvimonvat et al., 2007). Because inhibition of either FAAH or epoxide hydrolase could lead to the endogenous production of increased levels of 5,6-EET-EA, the findings presented here may aid in understanding the pharmacological activity and the mechanism of action of some of these novel drug molecules.
In conclusion, the data presented here provide evidence for a functional connection between the endocannabinoid system and the cytochrome P450 monooxygenase family of enzymes in the context of immune cell function. Our results demonstrate that the P450-mediated epoxidation of anandamide to form 5,6-EET-EA represents a bioactivation pathway for endocannabinoid signaling, which may affect microglial activity during inflammatory states.
Acknowledgments
We thank Adam Kuszak and Dr. Roger Sunahara for assistance with the ligand binding assays and Erica Levitt and Dr. John Traynor for providing the CHO cells and for assistance with the cAMP measurements. We also thank Dr. Dennis Selkoe (Harvard Medical School) for providing the BV-2 cells.
This work was supported in part by the National Institutes of Health National Cancer Institute [Grant CA16954]; the National Institutes of Health National Institute of General Medical Sciences [Grant T32-GM007767]; a predoctoral fellowship support from Merck and Co., Inc.; and a Howard Hughes Medical Institute through an Undergraduate Science Education Program to Kalamazoo College [Award 52005128].
ABBREVIATIONS: CNS, central nervous system; AM1241, (2-iodo-5-nitrophenyl)-[1-(1-methylpiperidin-2-ylmethyl)-1H-indol-3-yl]-methanone; AUDA, 2-(3-adamantan-1-yl-ureido)-dodecanoic acid; CB, cannabinoid receptor; CHO, Chinese hamster ovary; CP-55940, 5-(1,1-dimethylheptyl)-2-[(1R,2R,5R)-5-hydroxy-2-(3-hydroxy-propyl)-cyclohexyl]-phenol; DHET, dihydroxyeicosatrienoic acid; EA, ethanolamide; EET, epoxyeicosatrienoic acid; ESI-LC/MS, electrospray ionization-liquid chromatography/mass spectrometry; FAAH, fatty acid amide hydrolase; HETE, hydroxyeicosatetraenoic acid; IBMX, 3-isobutyl-1-methylxanthine; IFNγ, interferon γ; LPS, lipopolysaccharide; P450, cytochrome P450; WIN-55212-2, (R)-(+)-[2,3-dihydro-5-methyl-3-(4-morpholinylmethyl)pyrrolo[1,2,3-de]-1,4-benzoxazin-6-yl]-1-napthalenylmethanone; TME, Tris/MgCl2/EDTA; TMEB, Tris/MgCl2/EDTA/bovine serum albumin; 5,6-EET-EA, 5,6-epoxyeicosatrienoic acid ethanolamide; 5,6-DHET-EA, 5,6-dihydroxyeicosatrienoic acid ethanolamide.
References
- Block ML, Zecca L, and Hong JS (2007) Microglia-mediated neurotoxicity: uncovering the molecular mechanisms. Nat Rev Neurosci 8 57-69. [DOI] [PubMed] [Google Scholar]
- Bocchini V, Mazzolla R, Barluzzi R, Blasi E, Sick P, and Kettenmann H (1992) An immortalized cell line expresses properties of activated microglial cells. J Neurosci Res 31 616-621. [DOI] [PubMed] [Google Scholar]
- Bornheim LM, Kim KY, Chen B, and Correia MA (1995) Microsomal cytochrome P450-mediated liver and brain anandamide metabolism. Biochem Pharmacol 50 677-686. [DOI] [PubMed] [Google Scholar]
- Brown HS, Chadwick A, and Houston JB (2007) Use of isolated hepatocyte preparations for cytochrome P450 inhibition studies: comparison with microsomes for Ki determination [published erratum appears in: Drug Metab Dispos 36:203, 2008]. Drug Metab Dispos 35 2119-2126. [DOI] [PubMed] [Google Scholar]
- Cabral GA and Marciano-Cabral F (2005) Cannabinoid receptors in microglia of the central nervous system: immune functional relevance. J Leukoc Biol 78 1192-1197. [DOI] [PubMed] [Google Scholar]
- Cabral GA, Raborn ES, Griffin L, Dennis J, and Marciano-Cabral F (2008) CB2 receptors in the brain: role in central immune function. Br J Pharmacol 153 240-251. [DOI] [PMC free article] [PubMed] [Google Scholar]
- Carlisle SJ, Marciano-Cabral F, Staab A, Ludwick C, and Cabral GA (2002) Differential expression of the CB2 cannabinoid receptor by rodent macrophages and macrophage-like cells in relation to cell activation. Int Immunopharmacol 2 69-82. [DOI] [PubMed] [Google Scholar]
- Chiamvimonvat N, Ho CM, Tsai HJ, and Hammock BD (2007) The soluble epoxide hydrolase as a pharmaceutical target for hypertension. J Cardiovasc Pharmacol 50 225-237. [DOI] [PubMed] [Google Scholar]
- Craib SJ, Ellington HC, Pertwee RG, and Ross RA (2001) A possible role of lipoxygenase in the activation of vanilloid receptors by anandamide in the guinea-pig bronchus. Br J Pharmacol 134 30-37. [DOI] [PMC free article] [PubMed] [Google Scholar]
- Cravatt BF and Lichtman AH (2003) Fatty acid amide hydrolase: an emerging therapeutic target in the endocannabinoid system. Curr Opin Chem Biol 7 469-475. [DOI] [PubMed] [Google Scholar]
- Cui X, Kawashima H, Barclay TB, Peters JM, Gonzalez FJ, Morgan ET, and Strobel HW (2001) Molecular cloning and regulation of expression of two novel mouse CYP4F genes: expression in peroxisome proliferator-activated receptor α-deficient mice upon lipopolysaccharide and clofibrate challenges. J Pharmacol Exp Ther 296 542-550. [PubMed] [Google Scholar]
- Devane WA, Dysarz FA 3rd, Johnson MR, Melvin LS, and Howlett AC (1988) Determination and characterization of a cannabinoid receptor in rat brain. Mol Pharmacol 34 605-613. [PubMed] [Google Scholar]
- Devane WA, Hanus L, Breuer A, Pertwee RG, Stevenson LA, Griffin G, Gibson D, Mandelbaum A, Etinger A, and Mechoulam R (1992) Isolation and structure of a brain constituent that binds to the cannabinoid receptor. Science 258 1946-1949. [DOI] [PubMed] [Google Scholar]
- Di Marzo V (2008) Targeting the endocannabinoid system: to enhance or reduce? Nat Rev Drug Discov 7 438-455. [DOI] [PubMed] [Google Scholar]
- Eljaschewitsch E, Witting A, Mawrin C, Lee T, Schmidt PM, Wolf S, Hoertnagl H, Raine CS, Schneider-Stock R, Nitsch R, et al. (2006) The endocannabinoid anandamide protects neurons during CNS inflammation by induction of MKP-1 in microglial cells. Neuron 49 67-79. [DOI] [PubMed] [Google Scholar]
- Funae Y, Kishimoto W, Cho T, Niwa T, and Hiroi T (2003) CYP2D in the brain. Drug Metab Pharmacokinet 18 337-349. [DOI] [PubMed] [Google Scholar]
- Gao HM and Hong JS (2008) Why neurodegenerative diseases are progressive: uncontrolled inflammation drives disease progression. Trends Immunol 29 357-365. [DOI] [PMC free article] [PubMed] [Google Scholar]
- Giang DK and Cravatt BF (1997) Molecular characterization of human and mouse fatty acid amide hydrolases. Proc Natl Acad Sci U S A 94 2238-2242. [DOI] [PMC free article] [PubMed] [Google Scholar]
- Howlett AC (2005) Cannabinoid receptor signaling. Handb Exp Pharmacol 168 53-79. [DOI] [PubMed] [Google Scholar]
- Imig JD (2005) Epoxide hydrolase and epoxygenase metabolites as therapeutic targets for renal diseases. Am J Physiol Renal Physiol 289 F496-F503. [DOI] [PubMed] [Google Scholar]
- Kaminski NE, Abood ME, Kessler FK, Martin BR, and Schatz AR (1992) Identification of a functionally relevant cannabinoid receptor on mouse spleen cells that is involved in cannabinoid-mediated immune modulation. Mol Pharmacol 42 736-742. [PMC free article] [PubMed] [Google Scholar]
- Maresz K, Carrier EJ, Ponomarev ED, Hillard CJ, and Dittel BN (2005) Modulation of the cannabinoid CB2 receptor in microglial cells in response to inflammatory stimuli. J Neurochem 95 437-445. [DOI] [PubMed] [Google Scholar]
- Matheny CJ, Ali RY, Yang X, and Pollack GM (2004) Effect of prototypical inducing agents on P-glycoprotein and CYP3A expression in mouse tissues. Drug Metab Dispos 32 1008-1014. [PubMed] [Google Scholar]
- Mechoulam R, Ben-Shabat S, Hanus L, Ligumsky M, Kaminski NE, Schatz AR, Gopher A, Almog S, Martin BR, and Compton DR (1995) Identification of an endogenous 2-monoglyceride, present in canine gut, that binds to cannabinoid receptors. Biochem Pharmacol 50 83-90. [DOI] [PubMed] [Google Scholar]
- Sheng WS, Hu S, Min X, Cabral GA, Lokensgard JR, and Peterson PK (2005) Synthetic cannabinoid WIN55,212-2 inhibits generation of inflammatory mediators by IL-1beta-stimulated human astrocytes. Glia 49 211-219. [DOI] [PubMed] [Google Scholar]
- Shin JH, Engidawork E, Delabar JM, and Lubec G (2005) Identification and characterisation of soluble epoxide hydrolase in mouse brain by a robust protein biochemical method. Amino Acids 28 63-69. [DOI] [PubMed] [Google Scholar]
- Shoemaker JL, Seely KA, Reed RL, Crow JP, and Prather PL (2007) The CB2 cannabinoid agonist AM-1241 prolongs survival in a transgenic mouse model of amyotrophic lateral sclerosis when initiated at symptom onset. J Neurochem 101 87-98. [DOI] [PMC free article] [PubMed] [Google Scholar]
- Siegle I, Fritz P, Eckhardt K, Zanger UM, and Eichelbaum M (2001) Cellular localization and regional distribution of CYP2D6 mRNA and protein expression in human brain. Pharmacogenetics 11 237-245. [DOI] [PubMed] [Google Scholar]
- Snider NT, Kornilov AM, Kent UM, and Hollenberg PF (2007) Anandamide metabolism by human liver and kidney microsomal cytochrome P450 enzymes to form hydroxyeicosatetraenoic and epoxyeicosatrienoic acid ethanolamides. J Pharmacol Exp Ther 321 590-597. [DOI] [PubMed] [Google Scholar]
- Snider NT, Sikora MJ, Sridar C, Feuerstein TJ, Rae JM, and Hollenberg PF (2008) The Endocannabinoid Anandamide is a Substrate for the Human Polymorphic Cytochrome P450 2D6. J Pharmacol Exp Ther 327 538-545. [DOI] [PMC free article] [PubMed] [Google Scholar]
- Sura P, Sura R, Enayetallah AE, and Grant DF (2008) Distribution and expression of soluble epoxide hydrolase in human brain. J Histochem Cytochem 56 551-559. [DOI] [PMC free article] [PubMed] [Google Scholar]
- Woodward DF, Liang Y, and Krauss AH (2008) Prostamides (prostaglandin-ethanolamides) and their pharmacology. Br J Pharmacol 153 410-419. [DOI] [PMC free article] [PubMed] [Google Scholar]


