

Summary
Patterning in the Drosophila embryo requires local activation and dynamics of proteins in the plasma membrane (PM). We used in vivo fluorescence imaging to characterize the organization and diffusional properties of the PM in the early embryonic syncytium. Before cellularization, the PM is polarized into discrete domains having epithelial-like characteristics. One domain resides above individual nuclei and has apical-like characteristics, while the other domain is lateral to nuclei and contains markers associated with basolateral membranes and junctions. Pulse-chase photoconversion experiments show that molecules can diffuse within each domain but do not exchange between PM regions above adjacent nuclei. Drug-induced F-actin depolymerization disrupted both the apicobasal-like polarity and the diffusion barriers within the syncytial PM. These events correlated with perturbations in the spatial pattern of dorsoventral Toll signaling. We propose that epithelial-like properties and an intact F-actin network compartmentalize the PM and shape morphogen gradients in the syncytial embryo.
Keywords: polarity, compartmentalization, Drosophila, plasma membrane
Introduction
The asymmetric distribution of membrane proteins in different cell surface domains is a feature common to all eukaryotic cells. A classic example is the plasma membrane (PM) of polarized epithelial cells, in which membrane proteins are segregated into functionally and structurally different basolateral and apical membrane domains. Establishment of epithelial PM polarity involves many factors, including cell-cell and cell-extracellular matrix interactions, conserved polarity complexes, polarized trafficking of membrane components, and receptor-induced activation of lipid kinases (Nelson, 2003). Despite this knowledge, many questions remain regarding how PM protein asymmetry is established and maintained in epithelia and other cellular systems.
The PM of the early Drosophila embryo poses a particularly challenging system for deciphering protein organization and asymmetry because of its immense size and complexity. Fly embryogenesis starts with 13 rapid nuclear divisions within a common cytoplasm. The first nine of these divisions take place deep within the interior of the embryo. Once nuclei migrate to the periphery of the embryo, they undergo four additional rounds of division (nuclear cycles 10-13) in the stage known as the syncytial blastoderm. The sharing of a common cytoplasm ceases when each nucleus becomes individually encased in PM at cellularization during interphase of nuclear cycle 14 (Foe and Alberts, 1983).
It has long been known that the PM of the fly embryo plays a crucial role in generating and maintaining both the dorsal-ventral and terminal patterning systems. The spatial cues for the dorsal-ventral axis originate in oogenesis and build up to the generation of a ligand gradient, which binds to the transmembrane receptor Toll. Toll is distributed uniformly along the PM of the embryo, although its activation occurs only ventrally (reviewed by Moussian and Roth, 2005). Activated Toll then transduces the signal into the embryo leading to the regulation of genes required for dorsal-ventral cell fate specification. Given that membrane receptors have the ability to laterally diffuse within the PM, understanding how the fly embryo restricts Toll activation zones across the PM and how other PM components are organized in the absence of cell boundaries is an important, unanswered question.
To address this question, we have used high-resolution, confocal fluorescence microscopy to characterize the organization and dynamics of the PM in living fly embryos. A variety of membrane markers and a combination of noninvasive photobleaching and photoconversion techniques were employed to analyze the distribution and dynamics of proteins across the PM over a time period that is critical for the establishment of the dorsal-ventral and terminal patterning systems. Our results suggest that the PM of the syncytial blastoderm exhibits an epithelial-like organization with diffusion confined to specific PM domains, well before the formation of cell boundaries at cellularization. This organization has important implications for how morphogen gradients are shaped in the developing fly embryo.
Results
Plasma membrane asymmetry arises before cell boundaries at cellularization
To study the organization of the PM and the spatiotemporal dynamics of membrane components in living Drosophila embryos, we generated transgenic animals expressing different PM proteins tagged with Cerulean or Venus fluorescent proteins. The proteins were selected because they have different modes of membrane attachment and potentially different PM distributions. They included: (1) Venus fused to the first 20 amino acids of growth-associated protein 43 (GAP43), which contain a dual palmitoylation signal that tightly anchors the protein to the inner leaflet of the PM (Zacharias et al., 2002), (2) Cerulean fused to the pleckstrin-homology domain of phospholipase C delta 1, PH(PLCδ1), which binds specifically to the phosphoinositide PI(4,5)P2 (Varnai and Balla, 1998), and (3) Venus fused to full-length Toll receptor, a type I transmembrane protein that is required for dorsal-ventral embryonic polarity (Anderson et al., 1985; Hashimoto et al., 1988) (Figure 1A).
Figure 1. Plasma membrane organization before and after nuclear migration.
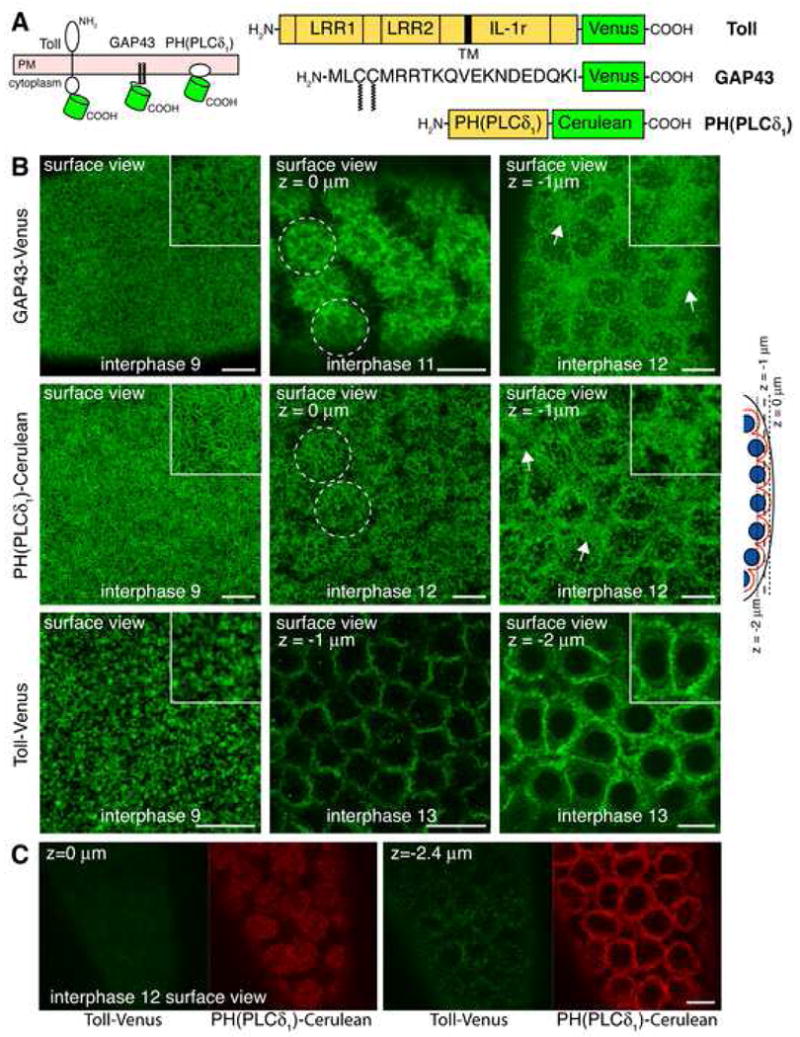
(A) Membrane topology of Cerulean/Venus-chimeras used in this study. The green barrel indicates the position of Cerulean/Venus. LRR, leucine-rich repeats; IL-1r, interleukin-1-receptor homology domain; TM, transmembrane domain; GAP43, growth-associated protein 43; PH(PLCδ1), pleckstrin-homology domain of phospholipase C delta 1.
(B) Representative confocal sections of embryos expressing GAP43 (top panel), PH(PLCδ1) (middle panel), and Toll (bottom panel). Confocal sections are shown through the tip of PM buds (z=0 μm) or closer to the base of membrane buds (z=-1 μm and z=-2 μm), as depicted in the schematic of the embryo cortex (nuclei in blue, PM in red, focal planes as dashed lines). Insets show magnified PM organization. Scale bar is 10 μm.
(C) Representative confocal sections through the surface of an embryo co-expressing Toll (green) and PH(PLCδ1) (red). Scale bar is 10 μm.
We began by characterizing the steady-state distribution of the fluorescent markers in the PM of living embryos at different stages prior to cellularization. This included before nuclei migrate to the periphery (Figure 1B, interphase 9) and after nuclei have arrived at the cortex of the syncytium (Figure 1B, interphase 11-13). Before nuclear migration both GAP43-Venus and PH(PLCδ1)-Cerulean (hereafter called GAP43 and PH(PLCδ1) respectively) highlighted the highly convoluted, microvilli-enriched PM of the embryo (Figure 1B, interphase 9, insets), whereas Toll-Venus (hereafter called Toll) appeared in clusters throughout the PM without revealing the convoluted nature of the PM at this stage (Figure 1B, interphase 9, inset). After nuclei migrated to the cortex, the PM formed buds over individual nuclei and was partially invaginated between adjacent nuclei, as observed previously (Karr and Alberts, 1986). Optical slices during this stage revealed both GAP43 and PH(PLCδ1) in the microvillous regions of the PM (Figure 1B, interphase 11 and 12, z=0μm), as well as in the elaborate PM infoldings and convolutions seen at the base of the membrane bud zones in regions between adjacent nuclei (Figure 1B, interphase 12, z=-1μm, arrows and insets). Toll, by contrast, was not localized in the membrane buds over nuclei, but was almost exclusively found in the PM regions between adjacent nuclei (Figure 1B, interphase 13, z=-1μm and z=-2μm, inset). In confocal sections through doubly expressing embryos, PH(PLCδ1) labeled microvillous regions, whereas Toll was absent and only appeared in deeper confocal planes in the PM regions between adjacent nuclei (Figure 1C). While the highly resolved PM morphology seen in these images accurately replicated previous scanning electron micrographs of the embryo PM at this stage (Turner and Mahowald, 1976), the differential localization of Toll, GAP43 and PH(PLCδ1) was unexpected. It revealed that lipid- and protein-based asymmetry is generated and maintained in the PM before the formation of cell boundaries at cellularization.
Localized lateral diffusion of proteins in the plasma membrane revealed by FRAP
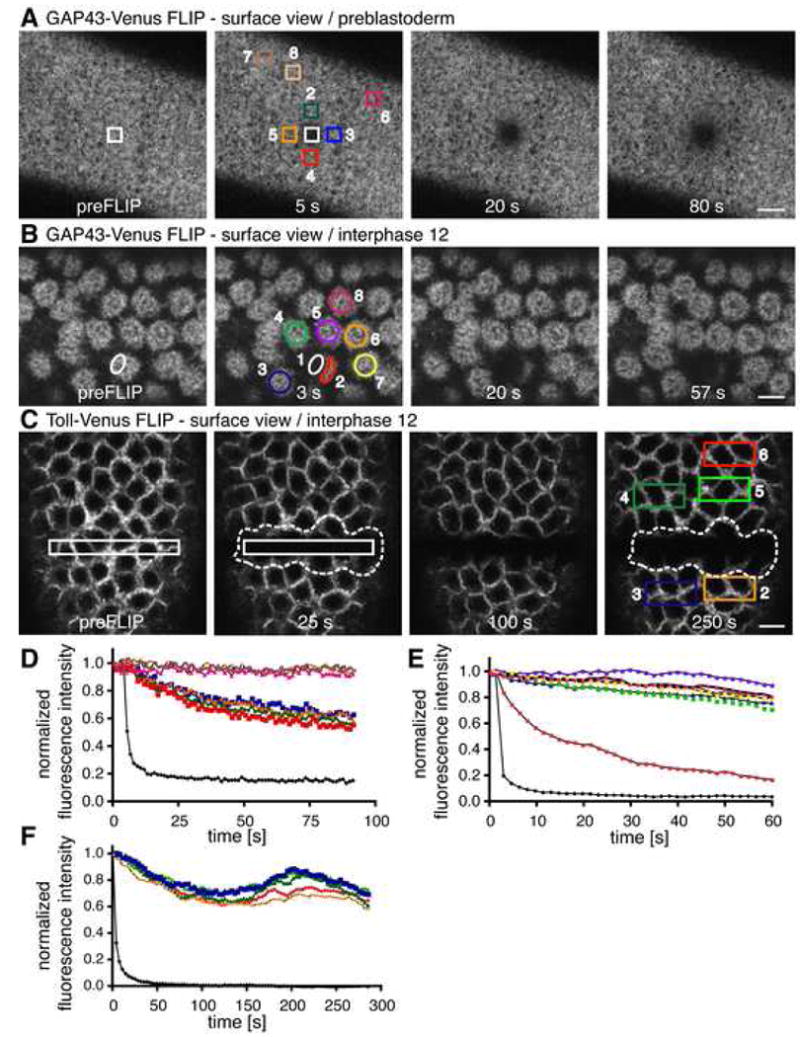
When a small area of PM expressing GAP43 was photobleached at either the preblastoderm stage when nuclei are still in the embryo interior (Figure 2A) or in the syncytial blastoderm stage (Figure 2B), fluorescent molecules outside the bleached box rapidly redistributed into the bleached area, resulting in fluorescence recovery. This indicated that GAP43 was highly mobile in the plane of the PM at both developmental stages. Significant recovery after bleaching was also observed for Toll at both the preblastoderm stage (Supplemental Figure 1A) and at interphase of nuclear cycle 13 (Figure 2C). That the recovery kinetics for Toll receptor were slower than those for GAP43 (compare Figure 2D and F) is presumably because the Toll receptor spans the bilayer of the PM whereas GAP43 is lipid anchored: previous photobleaching recovery experiments have shown that transmembrane proteins typically diffuse an order of magnitude slower than lipid-anchored proteins (Kenworthy et al., 2004).
Figure 2. Proteins are able to freely diffuse in the PM of the early embryo.

For each pair of panels, a small ROI (white outlined area) was photobleached and fluorescence recovery was monitored. Scale bar is 10 μm.
(A and D) FRAP of GAP43 before nuclear migration.
(B and E) FRAP of GAP43 in the syncytial blastoderm.
(C and F) FRAP of Toll in the syncytial blastoderm.
In the preblastoderm stage, fluorescence associated with distant areas (red, green) declined as fluorescence appeared in the bleached ROI (Figures 2A and 2D), suggesting that fluorescence recovered from distant zones (white box). By contrast, in interphase 13 embryos, fluorescence declined primarily from nonbleached PM surrounding the nuclei associated with the bleach ROI (Figures 2B and 2E, blue), and minimally from distant areas (Figures 2B and 2C, red and green outlined areas, and Figures 2E and 2F, red and green curves). This raised the possibility that the PM in the presence of nuclei exists as compartmentalized regions that do not exchange membrane components.
Compartmentalized character of protein diffusion across the PM revealed by FLIP
To investigate whether protein diffusion in the PM is restricted to specific domains in the syncytial blastoderm embryo, we employed a repetitive photobleaching protocol termed FLIP for Fluorescence Loss In Photobleaching (Lippincott-Schwartz and Patterson, 2003). In these experiments, a region of the PM in embryos expressing GAP43 was repeatedly photobleached and fluorescence from distant areas was examined. In FLIP experiments performed in embryos prior to nuclear migration, a 40% drop in GAP43 fluorescence was observed from all PM areas within a 15-μm radius of distance from the FLIP ROI center within 1.5 min of photobleaching (Figure 3A, and see quantification in Figure 3D). This indicated that there was extensive exchange of membrane components in the PM before nuclear migration. Hence, there were no barriers to lateral diffusion at this stage. On the other hand, when PM associated with one nucleus was repeatedly bleached after nuclear migration, an 80% drop in fluorescence from the nonbleached PM pool surrounding the nucleus contained in the bleached area occurred within 1 min of photobleaching (Figure 3B). Fluorescence in areas of PM surrounding other nuclei was minimally affected during this period, with a 5-20% drop in fluorescence measured in areas extending 25 μm away from the FLIP ROI center (Figure 3E for quantification). The observed drop in fluorescence in distant areas was not due to exchange of membrane pools within the bleach ROI but due to movements within the developing embryo that resulted in a vertical shift of the whole membrane region (see Supplemental Movie 1). This was evident in the quantification (Figure 3E) because regions adjacent to the bleach ROI (e.g. ROIs 6 and 7) exhibited a drop as large as regions 25 μm away (e.g., ROI 8) within the same time period and with similar intensity profiles (Figure 3E). Given that the photobleaching experiment encompassed the whole interphase, these results suggested that diffusion of GAP43 molecules during this interval was restricted to areas of PM surrounding individual interphase nuclei.
Figure 3. Diffusion of proteins in the PM is compartmentalized around individual interphase syncytial nuclei.
For each pair of panels, an ROI (white outlined box in first panel, black curve in second panel) was repeatedly photobleached, and fluorescence from distant areas was monitored.
(A and D) FLIP of GAP43 before nuclear migration. Areas 6-8 were used as control areas for acquisition photobleaching.
(B and E) FLIP of GAP43 in the syncytial blastoderm. See also Supplemental Movie 1 and Results text.
(C and F) FLIP of Toll in the syncytial blastoderm. See also Supplemental Movie 2 and Results text. Scale bar is 10 μm.
We next tested the extent of lateral diffusion of Toll in the PM after nuclear migration (Figure 3C). Similar to the GAP43 FLIP results, fluorescence from the nonbleached PM pool surrounding several nuclei contained in the bleached area dropped to background levels within 3-4 min of photobleaching (which was the duration of the examined interphase). Fluorescence in areas of PM surrounding other nuclei was minimally affected during this period, with a 25-40% drop measured in areas extending 20 μm away from the FLIP ROI center (Figure 3F for quantification). The observed drop in fluorescence in distant areas was again not due to exchange of membrane pools with the bleach ROI but due to movements within the embryo that resulted in a vertical shift of the whole PM surface (see Supplemental Movie 2). This was also evident in the quantification (Figure 3F) since regions directly adjacent to the bleach ROI (e.g. ROI 2) exhibited a drop as large as regions 25 μm away (e.g., ROI 6) within the same time period and with similar intensity profiles (Figure 3F, orange and red curves). The movement of Toll, therefore, was confined to areas of PM surrounding individual interphase nuclei in the syncytial blastoderm embryo. In the preblastoderm embryo, by contrast, Toll could diffuse to distant areas (Supplemental Figure 1B). Hence, upon nuclear migration to the cortex, the PM adjacent to a particular interphase nucleus behaved as a compartmentalized system that did not exchange integral membrane proteins (i.e., Toll) or peripheral membrane components (i.e., GAP43) with those in PM adjacent to a different nuclei.
Compartmentalized protein diffusion at the PM persists in mitosis
Nuclei undergo four divisions at the cortex of the syncytial blastoderm. The existing PM surface of the embryo therefore surrounds an increasing number of nuclei over time. Given that GAP43 and Toll both exhibited compartmentalized diffusion only within PM above a given nuclei during interphase cycles, we asked how these membrane proteins behaved throughout a whole syncytial cycle: was their diffusion still constrained to the PM area above an individual nuclear/mitotic unit?
To address this question, we generated transgenic animals expressing Toll and GAP43 fused to the photoactivatable fluorescent proteins PA-GFP05 and mEos, respectively. PA-GFP05 converts from a dark to a bright fluorescent state upon photoactivation (Patterson and Lippincott-Schwartz, 2002), whereas mEos undergoes photoconversion from a green to a red fluorescent form (Wiedenmann et al., 2004), allowing the optical labeling and tracking of membrane components over time (Lippincott-Schwartz and Patterson, 2008).
We started by optically pulse-chasing the transmembrane protein, Toll-PA-GFP05 during syncytial division 13, which is the longest of all syncytial cycles (Foe and Alberts, 1983). By briefly irradiating a region of interest with intense violet light Toll-PA-GFP05 molecules became irreversibly photoactivated within the ROI (Figure 4A, white outlined circle). We then performed confocal time-lapse imaging in three dimensions to chase the highlighted protein pool through cycle 13 (Figure 4A and Supplemental Movie 3). Analysis of the integrated fluorescence intensity over the course of the pulse-chase showed that >95% of the intensity contained in the photoactivated ROI during interphase 13 (Figure 4A, white outlined circle, interphase 13) was limited to the PM regions in interphase 14 (Figure 4A, broken-line outlined area, interphase 14) derived from the same nuclei (Figure 4A, numbered areas). An optical pulse-chase experiment performed during syncytial division 12 showed identical results (see Supplemental Figure 2).
Figure 4. Compartmentalized diffusion in the PM persists during mitosis.
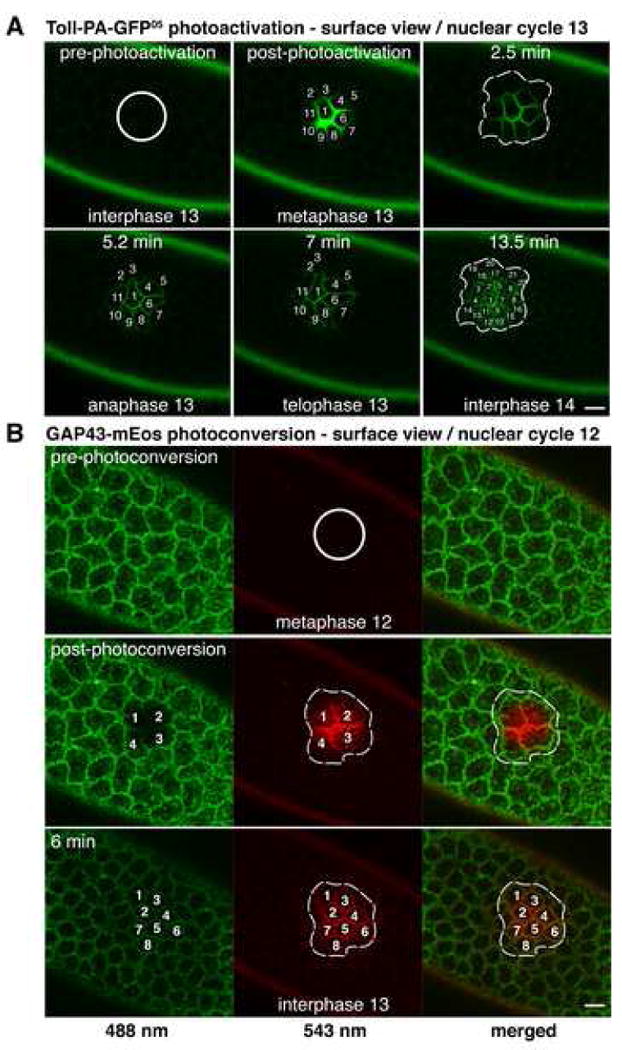
(A) Optical pulse-chase of Toll during syncytial division 13. Toll-PA-GFP05 molecules were photoactivated in a region of interest (white outlined circle) and confocal time-lapse imaging was used to chase them through nuclear cycle 13. The relevant area was then assayed at interphase 14 (broken-line outlined areas; see text, Supplemental Movie 3 and Experimental Procedures). See also Supplemental Figure 1 for a similar experiment during syncytial division 12. Cell cycle stages during mitosis were inferred from the timing of mitosis in living embryos.
(B) Optical pulse-chase of GAP43 during syncytial division 12. GAP43-mEos molecules were photoconverted in a region of interest (white outlined circle) and confocal time-lapse imaging was performed to chase them through cycle 12. The relevant area was then assayed at interphase 13 (broken-line outlined areas; see text and Experimental Procedures). Scale bar is 10 μm.
We next examined the extent of diffusion of the lipid-anchored protein, GAP43-mEos, performing a similar optical pulse-chase experiment during syncytial cycle 12. We photoconverted GAP43-mEos molecules within an ROI (Figure 4B, white outlined circle, red) and then chased the highlighted membrane pool through cycle 12 up to interphase 13 by confocal time-lapse imaging. Analysis of the integrated fluorescence intensity over the course of the pulse-chase showed that >90% of the intensity contained in the photoconverted ROI during interphase 12 (Figure 4B, white outlined circle) was limited to the PM regions in interphase 13 (Figure 4B, broken-line outlined area, interphase 13, merged) derived from the same nuclei (Figure 4B, numbered areas). These experiments showed that both a transmembrane and a lipid-anchored protein (which diffuses at least an order of magnitude faster than the transmembrane protein (Jacobson et al., 1987; Kenworthy et al., 2004) did not diffuse outside individual mitotic units throughout a whole syncytial cycle.
The PM exhibits an epithelial-like organization prior to the formation of cells in the embryo
To gain insight into the machinery underlying compartmentalized diffusion in the PM we compared the localization of PM proteins with proteins involved in the submembrane organization of the cortex. We began by examining sagittal views of embryos co-expressing Toll and PH(PLCδ1) (Figure 5A). Whereas PH(PLCδ1) was localized both in the PM between and over adjacent nuclei (Figure 5A, red and Figure 1C), Toll was found in PM regions between adjacent nuclei, at the base of the PM buds (Figure 5A, green, arrows and Figure 1C). The phosphoinositide, PI(4,5)P2, was recently shown to be a key determinant of apical PM biogenesis in epithelial cells (Martin-Belmonte et al., 2007), whereas Toll localizes on basolateral membranes in polarized epithelial cells in the fly (Lecuit et al., 2002). Thus, the localization of PI(4,5)P2 (inferred by the localization of PH(PLCδ1)) in the microvillous PM above nuclei and Toll in regions lateral to nuclei suggested a polarized distribution of these molecules reminiscent of apical-basal membrane polarity in epithelial cells.
Figure 5. Plasma membrane has a polarized, epithelial-like organization prior to the formation of cells at cellularization.
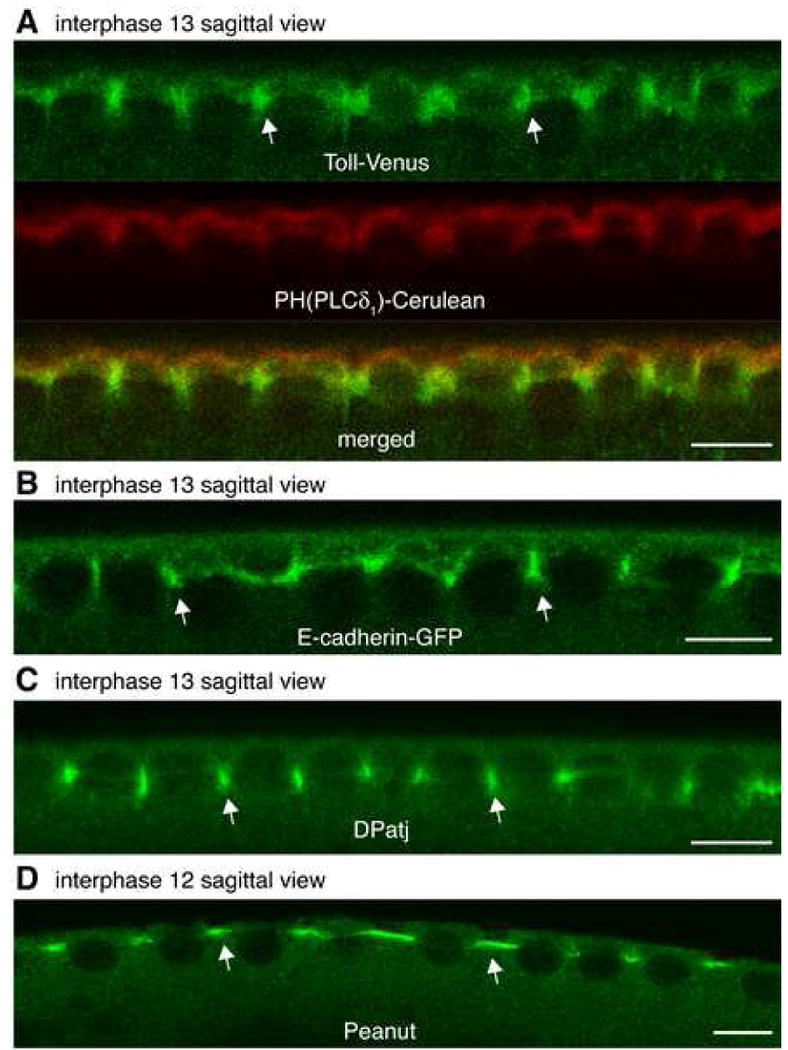
(A) Representative confocal section of a sagittal view in an embryo co-expressing Toll (green) and PH(PLCδ1) (red) during interphase. See also Figure 1C.
(B-D) Representative confocal section of a sagittal view in an embryo expressing E-cadherin-GFP (B, nuclear cycle 13), immunostained against DPatj (C, nuclear cycle 13) or immunostained against Peanut (D, nuclear cycle 12). Arrows indicate enrichment between adjacent nuclei. Scale bar is 10 μm.
We then examined the localization of the adhesion protein, E-cadherin, present in the syncytial blastoderm (McCartney et al., 2001), in embryos expressing a functional E-cadherin-GFP fusion (Oda and Tsukita, 2001). E-cadherin localized in PM between adjacent nuclei and not in the microvillous PM region over nuclei (Figure 5B, arrows). Its localization during interphase was thus similar to that of Toll. Next, we examined the localization of DPatj (Drosophila homolog of mammalian PATJ), a multi-PDZ domain protein involved in establishing and maintaining epithelial polarity (Bhat et al., 1999). DPatj was enriched in the PM between adjacent nuclei (Figure 5C, arrows). The asymmetric localization of both junctional proteins, E-cadherin and DPatj, pointed again to an epithelial-like organization of the PM already before cellularization.
Septins polymerize to form filamentous structures that act as diffusion barriers between PM domains (Spiliotis and Nelson, 2006). To explore this possibility, we examined the localization of the septin protein Peanut, a component of a three-septin complex in the early Drosophila embryo, which has been shown to form filaments in vitro (Fares et al., 1995; Field et al., 1996). Peanut was found at the base of PM buds between adjacent nuclei (Figure 5D, arrows). On further examining images from multiply stained embryos both Peanut and E-cadherin were found in the same optical sections. DPatj was localized in the basal-most region of the PM below Peanut and E-cadherin (Supplemental Figure 3A and 3B). GAP43 labeled the entire PM including the basal-most region that was positive for DPatj (Supplemental Figure 3C). The polarized distributions of E-cadherin, Peanut and DPatj thus raised the possibility that these proteins might act as spatial landmarks to differentiate the submembrane region lateral to nuclei and potentially organize a diffusion barrier.
Plasma membrane polarity is maintained during syncytial mitoses
To determine whether the epithelial-like polarity we observed during interphase is maintained or lost during mitosis, we investigated how PM morphology changes during this period. In surface views of GAP43 expressing embryos during interphase, GAP43 highlighted the microvillous PM regions over individual nuclei (Figure 6, interphase 12 and interphase 13, arrows). However, as the embryo progressed to anaphase and early telophase, there was a dramatic change in PM morphology. The PM regions over the dividing nuclei became completely flat (Figure 6, metaphase, arrows), and it was only at late telophase that the PM reorganized in microvilli over daughter nuclei (Figure 6, late telophase). The same morphological changes were observed in dividing PH(PLCδ1)-expressing embryos (data not shown). These findings were in accordance with previous scanning electron micrographs of the embryo PM, which showed the flattening of the PM over dividing nuclei (Turner and Mahowald, 1976).
Figure 6. Plasma membrane polarity is maintained during syncytial mitoses.
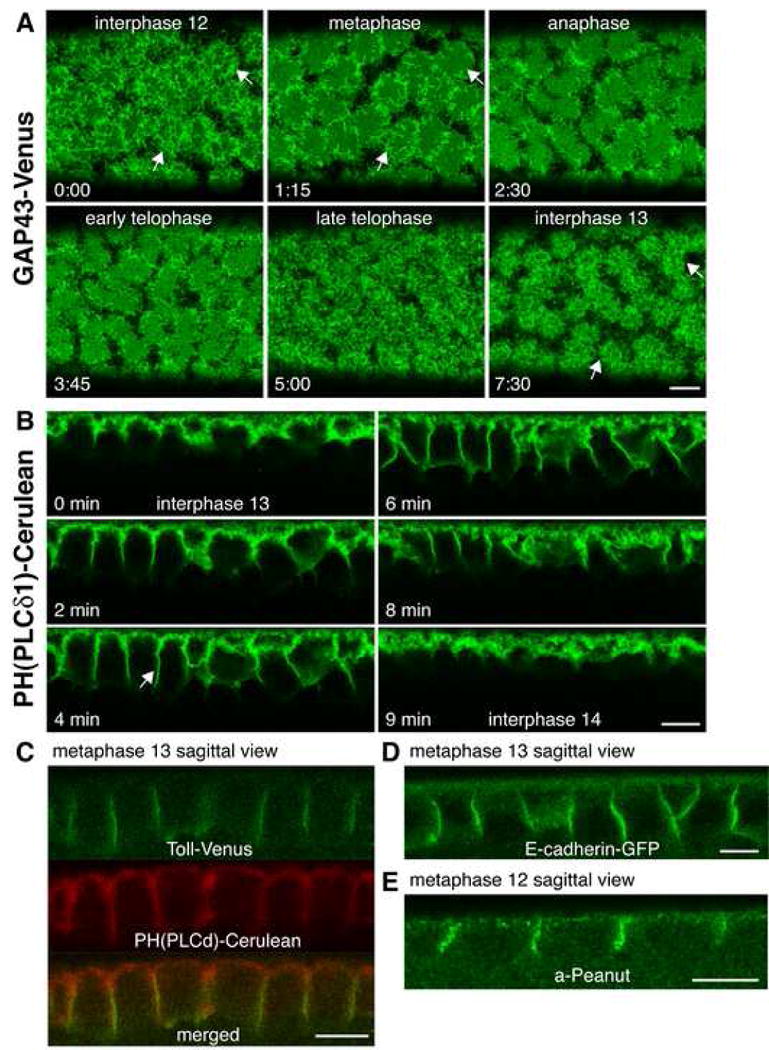
(A) Time-lapse imaging of a GAP43 expressing embryo during syncytial mitosis 12. In surface views during interphase. Arrows indicate PM overlying nuclei. Cell cycle stages during mitosis were inferred from the timing of mitosis in living embryos. Time, min:sec.
(B) Time-lapse imaging of a PH(PLCδ1) expressing embryo during syncytial mitosis 13. Arrows indicate transient invaginations separating mitotic spindles. See text and Supplemental Movie 4.
(C) Representative confocal section of a sagittal view in an embryo co-expressing Toll (green) and PH(PLCδ1) (red) during mitosis.
(D-E) Representative confocal section of a sagittal view in an embryo expressing E-cadherin-GFP (D) or immunostained against Peanut (E) during mitosis. Scale bar is 10 μm.
We next examined the behavior of the PM in sagittal views of dividing PH(PLCδ1) expressing embryos (Figure 6B). The PM is known to transiently invaginate between dividing nuclei during the syncytial divisions (forming so-called metaphase furrows), separating adjacent mitotic spindles (Karr and Alberts, 1986). Consistent with this, the PM was observed to transiently invaginate during syncytial mitoses, with invaginations 6.0±0.4 μm (N=13 furrows) and 8.0±0.6 μm (N=18 furrows) deep during mitosis 12 and 13, respectively, and an average rate of membrane invagination of 1.5-2 μm/min (Figure 6B, arrow, see also Supplemental Movie 4).
To examine whether membrane polarity is maintained during mitosis, we looked at the distribution of different PM proteins in dividing embryos (Figure 6C-6E). Toll appeared to localize only on metaphase furrows between adjacent nuclei and not in the PM over dividing nuclei, in accordance with previous reports on the localization of wild-type Toll in the early embryo (Gay and Keith, 1992; Hashimoto et al., 1991).
A similar polarized pattern was seen for E-cadherin and Peanut during this developmental stage: they were exclusively found on the entire length of metaphase furrows (Figure 6D and 6E). However, DPatj was only localized to the tip of the metaphase furrows in all sections examined. By contrast, PH(PLCδ1) and GAP43 were localized along the entire PM, with no specific enrichment between dividing nuclei (Figure 6C and Supplemental Figure 3C). Thus, the epithelial-like polarity of the PM in the syncytial blastoderm fly embryo was maintained during mitosis.
Latrunculin A-induced disruption of F-actin results in loss of Peanut and Dpatj from the PM
We next examined the distribution of DPatj and Peanut in embryos injected with latrunculin A (lat A), a drug that sequesters G-actin monomers and leads to rapid F-actin depolymerization (Coue et al., 1987). LatA induced rapid F-actin depolymerization within a few minutes of its injection (Figure 7A, F-actin, arrows). In embryos injected with latA, the association of Dpatj and Peanut with the PM was lost. The characteristic hexagonal-like pattern of PM (Figure 7A, wild type) was disrupted, with patches of PM containing very little or none of either DPatj or Peanut (Figure 7A, arrows). Neither of DPatj or Peanut were found in apical-like PM over adjacent nuclei in latA-injected embryos (Supplemental Figure 4A). Thus, an intact actin network is required for the stable association of both DPatj and Peanut with the PM, suggesting that F-actin is a key component in the maintenance of epithelial-like PM polarity in the early embryo.
Figure 7. The actin depolymerizing agent latA disrupts the localization of PM polarity markers and partially abolishes compartmentalized lateral diffusion in the PM.
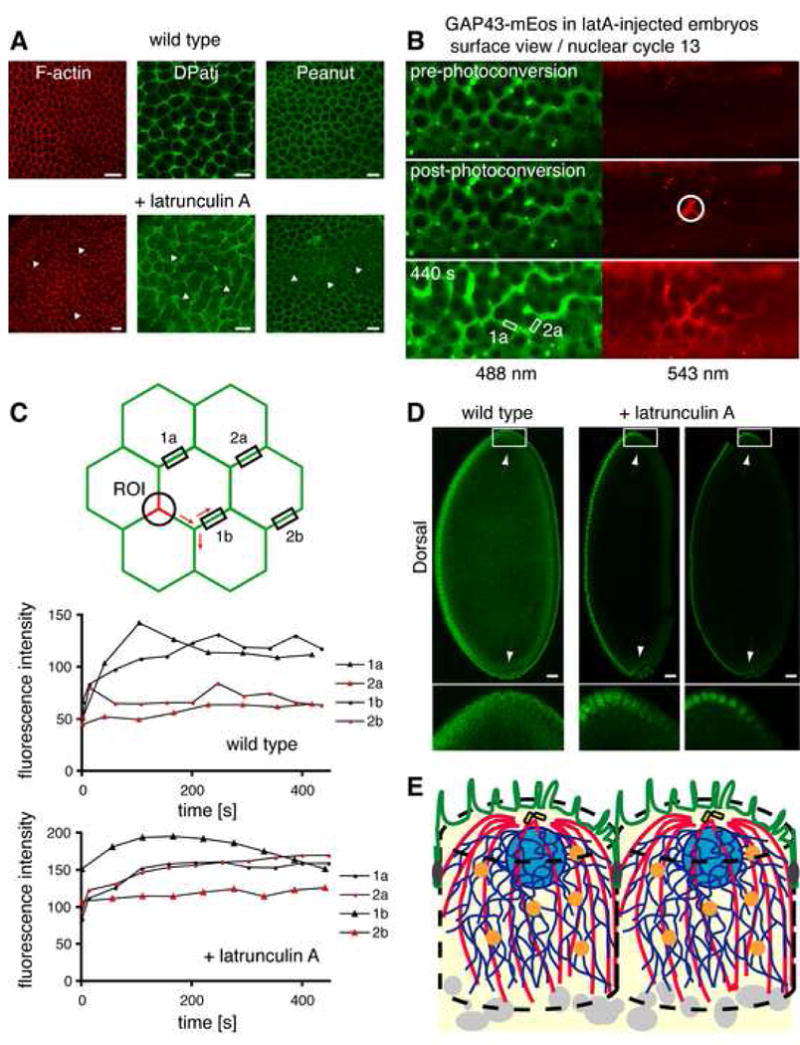
(A) Representative sections through embryos stained for F-actin, DPatj, or Peanut before or after latrunculin A treatment (see text). Arrows indicate disrupted regions. Scale bar is 10 μm.
(B) Example of a pulse-chase experiment in a latA-injected embryo expressing GAP43-mEosFP. GAP43 was photoconverted in the white outlined ROI and red (activated) fluorescence chased over time. Measurements were taken in both regions 1a and 2a at each time-point. Images in the pre- and post-photoconversion are single slices. Green fluorescence at 440 s is shown as a maximum intensity projection of the acquired z-stack, whereas red fluorescence is the sum of all slices (see text and Experimental Procedures).
(C) Embryos expressing GAP43-mEos were injected with latA to disrupt F-actin, and GAP43 red fluorescence was induced by photoconversion and the activated pool chased over time. Activated fluorescence intensity changes were measured in topologically distinct regions of the PM and compared to similar experiments in wild type embryos (see text and Experimental Procedures).
(D) Cellularizing embryos were immunostained for Dorsal before or after latrunculin A treatment (see text). Arrows point to the anterior- and posterior-most tips of the embryo. Anterior of embryos is to the top and ventral to the left. Magnifications of the anterior regions (white outlined boxes) are shown below respective images. Scale bar is 20μm.
(E) Model of PM organization in the syncytial blastoderm embryo, modified from Frescas et al (2006). Syncytial nuclei (light blue) or centrosomes (yellow) organize functionally compartmentalized secretory units at the embryo periphery. Proteins synthesized in the ER (dark blue) are delivered through Golgi (orange) to the PM (green). Once in the PM, proteins are able to freely diffuse only within regions surrounding individual nuclei (green). Dark gray PM regions lateral to nuclei organize a diffusion barrier in the PM, which depends on an intact F-actin network. The PM exhibits an epithelial-like organization with distinct apical-like (green) and basolateral-like (dark gray) regions already before cellularization. Centrosome-nucleated microtubules in red and yolk particles in light gray.
Latrunculin A-induced loss of F-actin disrupts PM integrity and abolishes compartmentalized diffusion of GAP43 in the PM
To investigate whether disruption of the actin network affects compartmentalized diffusion of proteins in the PM, we injected latA in living embryos and examined GAP43 diffusion in the PM in pulse-chase photoconversion experiments. An ROI was chosen in a surface view of an embryo expressing GAP43-mEos, and GAP43-mEos molecules within the ROI were photoconverted (Figure 7B and Figure 7C schematic, photoconverted GAP43 in red). Time-lapse images were immediately acquired in three dimensions to chase the photoconverted pool in order to examine its extent of diffusion away from the ROI. The green (non-activated) fluorescence of mEos allowed us at all times to follow subtle changes in membrane geometry/morphology and to measure intensity changes in red (activated) fluorescence with high precision, even at early time-points when the signal is low and the membrane outline indiscernible in the red channel.
We measured red (activated) fluorescence intensity changes at each time-point in two topologically distinct regions away from the ROI, regions 1 and 2. Region 1 (Figure 7C schematic, black outlined boxes 1a and 1b) enclosed PM that is part of the nuclei-associated PM unit contained in the photoconverted ROI (PM units are depicted as single hexagons in the Figure 7C schematic). Region 2 (Figure 7C schematic, black outlined boxes 2a and 2b) enclosed PM that does not belong to the nuclei-associated PM unit contained in the photoconverted ROI but is directly adjacent to it. Two examples of such measurements are shown in the accompanying graphs of Figure 7C for each wild type and latA-injected embryos. Red fluorescence in region 1 in wild type embryos started increasing immediately after photoconversion and reached a plateau that lasted up to 7-10 min after photoconversion (Figure 7C, wild type, regions 1a and 1b). Since each PM unit is surrounded by several (>four) PM units at any time-point, activated fluorescence can get diluted into the PM of three units each time it reaches a junction between units (Figure 7C schematic, red arrows). The fact that activated fluorescence increased but maintained a plateau for 7-10 min after photoconversion strongly suggests that this fluorescent pool is not diluted but is contained within the PM unit, consistent with the FLIP and photoconversion experiments described above showing compartmentalized diffusion in the PM. Intensity changes in region 2 were difficult to interpret because fluorescence in this region did not increase significantly above background (pre-photoconversion) levels.
LatA injection in GAP43-mEos expressing embryos resulted in changes in PM morphology and integrity within a few minutes of injection. PM buds over nuclei still formed, but the invaginations between adjacent nuclei were not robust, and many nuclei were enclosed within the same bud (Supplemental Figure 4B). Furthermore, metaphase furrows were largely disrupted, with PM furrows absent between adjacent dividing nuclei, in accordance with the effect of latA on metaphase furrows recently reported (Cao et al., 2008). Photoconversion experiments in latA-injected embryos showed a different profile than in wild-type embryos in 35% of the cases examined. There, activated fluorescence initially increased within 2-3 minutes but then steadily decreased during the course of the experiment (∼7-10 min) (Figure 7C, latrunculin A, region 1b). Furthermore, activated fluorescence in region 2 was observed to steadily increase (Figure 7C, latrunculin A, region 2a), notably in cases where PM integrity was strongly affected (Figure 7B). The steady drop in intensity in region 1 soon after photoconversion and the increase in region 2 argue for a loss of compartmentalized diffusion in the PM and indicate that GAP43 was able to explore PM regions outside the PM unit of the initial photoconversion. Thus, an intact F-actin network is needed to contain the lateral diffusion of GAP43 within a single PM unit. The fact that the latA effect was observed in only 35% of examined embryos is likely due to photoconversion being done in regions far away from the drug injection site, which would result in a weaker effect of latA.
LatA-induced F-actin disruption results in spreading of the Dorsal gradient to more anterior and posterior regions
The loss of compartmentalized diffusion of GAP43 in the PM by latA injection raised the possibility that an intact actin meshwork might also act to confine diffusion of Toll receptor within PM units. To test this possibility, we injected latA in wild type embryos during syncytial division 13, allowed the embryos to develop until cellularization and then fixed and stained for the transcription factor, Dorsal. Dorsal responds to activated Toll receptor in the PM and forms a characteristic nuclear concentration gradient, with high concentrations in ventral nuclei and an apparent absence from dorsal nuclei (Roth et al., 1989; Steward et al., 1988). A representative immunostaining for the Dorsal gradient is shown in Figure 7D, with arrows pointing to the anterior- and posterior-most tips of the embryo where nuclear concentration of Dorsal is very low. In 80% of the latA-injected embryos examined, the Dorsal nuclear concentration gradient was found to spread into the anterior and posterior regions, with Dorsal filling up several nuclei beyond the equator. Two representative examples are shown in Figure 7D with arrows pointing to the regions where Dorsal was found in nuclei past the equator. Together with our observations in Figure 7A-C, these results suggest that the disrupted actin network induced by latA injection facilitates the diffusion of activated Toll receptor across the PM, thereby spreading downstream signaling events (i.e., Dorsal activation) to more anterior and posterior positions in the embryo.
Discussion
Our study provides evidence that the plasma membrane of the fly syncytial blastoderm exhibits a polarized, epithelial-like organization prior to cellularization. Previously, it was thought that the PM of the blastoderm had no specialized organization prior to the formation of cell boundaries at cellularization. Our results show that despite the absence of cell boundaries, the PM of the syncytial blastoderm has apical- and basolateral-like domains surrounding individual cortical nuclei and that PM proteins do not exchange between PM regions surrounding adjacent nuclei. This organization is maintained throughout syncytial mitotic division cycles and is dependent on an intact F-actin network (Figure 7E).
Support for these conclusions came from live imaging and fluorescent highlighting experiments in living embryos. Using a variety of membrane markers, we could distinguish two distinct PM regions. One region was above individual nuclei and had apical-like characteristics, including the presence of microvilli and an enrichment in PI(4,5)P2, a key determinant of apical PM biogenesis (Martin-Belmonte et al., 2007), as well as in GAP43, a protein that localizes to raft-like membranes (Zacharias et al., 2002), which typically compose apical PM surfaces in epithelial cells (Simons and van Meer, 1988). The second PM region was lateral to nuclei, which were enriched in markers typically associated with basolateral membranes and junctions, including the cell-cell adhesion molecule E-cadherin, the multi-PDZ domain scaffolding protein DPatj (Bhat et al., 1999), and the basolateral protein Toll (Lecuit et al., 2002). FRAP experiments showed that the molecules could freely diffuse in the PM domains surrounding individual nuclei but did not diffuse outside them, suggesting the presence of a diffusion barrier between the domains during interphase. Moreover, optical pulse-chase experiments showed that these components did not diffuse outside PM domains surrounding mitotic units throughout the time period of syncytial divisions. Thus, during mitosis, the polarized organization and restricted diffusion pattern of proteins in the PM did not change. Finally, the requirement of an intact F-actin network was supported by drug-induced actin depolymerization, which disrupted PM association of DPatj and Peanut and abolished the restricted diffusion pattern in the PM.
Our finding that the PM of the syncytial blastoderm is organized as a pseudo-epithelium prior to cellularization has several important implications for understanding many aspects of embryo development. First, it directly impacts on how dorsal-ventral and terminal patterning are set up prior to cellularization. These are dependent on Toll and Torso membrane receptors. Toll is distributed uniformly along the syncytial PM, but is activated only ventrally (Anderson et al., 1985; Hashimoto et al., 1988).
Similarly, Torso is uniformly expressed along the surface membrane of early embryos, but its activation occurs only at the anterior and posterior poles (Casanova and Struhl, 1989). Given that membrane receptors have the capacity to diffuse across the PM, it has been unclear why the activation zones of these receptors do not spread widely across the PM. Our results revealing the compartmentalized character of the PM during interphase and syncytial nuclear divisions now provide a potential answer. Receptors diffuse locally within the PM surrounding a particular nucleus, but they do not diffuse to PM regions associated with other nuclei. Consequently, activation zones of receptors (set up by the localized spatial signal of ligands) do not spread, allowing robust downstream signaling events in particular regions of the embryo. This possibility is supported by the spreading of the Dorsal gradient to more anterior and posterior regions in embryos treated with latA (Figure 7D). LatA-induced actin depolymerization abolished the confined diffusion pattern in the PM (Figure 7C) suggesting that an intact actin network is likely to be important for containing activated Toll diffusion and thus maintaining a robust downstream Dorsal gradient.
The molecular basis for the compartmentalized diffusion in the PM of the syncytial embryo appears to be due to the presence of bona fide diffusion barriers in the PM regions directly between adjacent nuclei (Figure 7E, dark gray). Our finding that septins and components of junctions are specifically enriched in this PM region raises the possibility that these molecules together with other cytoskeletal components organize a barrier to diffusion in the plane of the PM in a way similar either to the organization of septin rings at the yeast bud neck or of adherens junctions in epithelial cells (Nelson, 2003). Moreover, the loss of PM association of DPatj and Peanut, as well as the abolishment of the restricted diffusion pattern in latA-treated embryos suggest that an intact F-actin network is required both to localize or/and maintain septins and junctional components to specialized PM regions and to contain diffusion of proteins in PM units around individual syncytial nuclei. An intact F-actin network was recently shown to be required for compartmentalizing furrow canals during cellularization (Sokac and Wieschaus, 2008b) further supporting that F-actin organizes lateral diffusion of proteins in the PM. Future studies will need to genetically dissect the molecular machineries involved in organizing such diffusion barriers.
A second implication of the observed PM dynamics during syncytial mitoses relates to the machinery driving PM invagination. We found that the PM was organized into highly convoluted microvillous membrane buds over interphase nuclei and these flattened out as soon as nuclei entered mitosis before reorganizing again into microvillous buds upon re-entry into the next interphase. Furthermore, the rate at which PM invaginated (∼1.5-2 μm/min) was twice as fast as during the fast phase of cellularization, which involves de novo membrane delivery (Lecuit and Wieschaus, 2000; Sisson et al., 2000). Although endocytosis was recently shown to accompany metaphase furrow ingression (Sokac and Wieschaus, 2008a), our observations support a mechanism for PM invagination in mitosis that involves contractile machinery which transiently redistributes PM from microvilli caps into transient furrows surrounding mitotic units rather than an internal membrane source.
A final implication of our findings relates to cellularization, which produces the primary epithelial cells of the embryo. Polarization of the invaginating PM during cellularization has been reported (Lecuit et al., 2002; Lecuit and Wieschaus, 2000; Thomas and Williams, 1999), and it is during cellularization that PM polarity is first thought to be achieved in early fly embryogenesis. Because our data demonstrate that the PM is already polarized prior to cellularization it is likely that the embryo uses this organization to initiate and organize the cellularization process. Consistent with this, we found that the junctional proteins E-cadherin and DPatj, the septin protein Peanut and Toll are all highly enriched in the PM at sites between adjacent nuclei during syncytial interphases, which reflects the PM organization between nuclei right at the onset of cellularization (first few minutes of interphase 14). Indeed, these are precisely the PM sites that become further differentiated within the first 5 min into cellularization, with the formation of an invaginating membrane front that contains Peanut and DPatj, basal adherens junctions directly adjacent to the invaginating front that contain E-cadherin (Muller and Wieschaus, 1996), and the extension of the lateral membranes that are positive for Toll (Lecuit et al., 2002). The epithelial polarization occurring during cellularization is thus already reflected in the organization of the syncytial blastoderm PM.
In summary, our findings that the syncytial blastoderm PM exhibits an epithelial-like polarization prior to cellularization, and that distinct PM domains do not significantly exchange membrane components point to an as yet unexplored mechanism for how the embryo maintains and generates morphogen gradients at this stage. By preventing activation zones of membrane receptors on the PM from spreading, robust downstream signaling events within the cytoplasm and nuclei of the embryo can be established. This mechanism would work in conjunction with nuclear-cytoplasmic shuttling of transcription factors (Coppey et al., 2007; DeLotto et al., 2007; Gregor et al., 2007), and a compartmentalized secretory pathway (Frescas et al., 2006), to generate the dorsal-ventral and terminal patterning systems of the blastoderm fly embryo.
Experimental Procedures
Plasmid Construction
Detailed information can be found in Supplemental Experimental Procedures.
Fly Transformation, Stocks and Genetics
Detailed information can be found in Supplemental Experimental Procedures.
Immunofluorescence of Embryos
Canton S embryos were collected and aged at 25°C. Embryos were dechorionated in bleach, fixed for 20 min in 4% paraformaldehyde:heptane and devitellinized in heptane:methanol, and the eggs were subsequently labeled with fluorescent probes following standard protocols (Rothwell and Sullivan, 2000). Mouse anti-Peanut 4C9H4 antibodies (1:3) and mouse anti-Dorsal 7A4 antibodies (1:10) were from the Developmental Studies Hybridoma Bank and rabbit anti-DLT (DPatj) antibodies (1:1000) were a gift from Dr. Hugo Bellen (Baylor College of Medicine, USA). For E-cadherin and GAP43 stainings, Alexa Fluor conjugated anti-GFP antibodies (1:500) from Invitrogen were used in formaldehyde fixed E-cadherin-GFP and GAP43-Venus expressing embryos, respectively. Secondary antibodies used were Alexa Fluor 488 conjugated goat anti-mouse (1:500) from Invitrogen (A-21121) and Alexa Fluor 546 conjugated goat anti rabbit (1:400) from Invitrogen (A-11035). Alexa Fluor 546 conjugated phalloidin was from Invitrogen (A22283) and a working stock of 6.6 μM was used at 1:50 for 20 min for F-actin staining in formaldehyde fixed, hand-devitellinized embryos. Embryos were washed in PBS and mounted on slides with Fluoromount G (Southern Biotechnology Associates, Inc., Birmingham, AL) in preparation for microscopy.
Fixation and staining of latA-injected embryos
Detailed information can be found in Supplemental Experimental Procedures.
Live imaging of embryos
Live embryos were prepared for fluorescence microscopy as described in (Mavrakis et al., 2008). Confocal images were acquired on a Zeiss 510 Meta or Zeiss ConfoCor-2 laser scanning confocal microscope (Carl Zeiss, Thornwood, NY). GFP was imaged with the 488 nm line of an argon ion laser and emission was collected with a 505 longpass emission filter. Cerulean was imaged with the 458 nm line of an argon ion laser and emission was collected with a 475 longpass emission filter. Venus was imaged with the 514 nm line of an argon ion laser and emission was collected with a 530-600 bandpass emission filter. Cerulean/Venus dual imaging was performed in multi-tracking mode using 458 nm excitation and a 475-525 bandpass emission filter for Cerulean and 514 nm excitation and a 530 longpass emission filter for Venus. Images were captured with a Zeiss C-Apochromat 40×/1.20 W Corr UV-VIS-IR water lens, analyzed with ImageJ freeware (NIH, Bethesda, MD) and Zeiss Image Examiner software and prepared by Adobe Photoshop 7.0.
Photobleaching experiments
Venus photobleaching experiments were performed on a Zeiss 510 Meta or Zeiss ConfoCor-2 laser scanning confocal microscope (Carl Zeiss, Thornwood, NY) by photobleaching a region of interest (ROI) and monitoring fluorescence recovery or loss over time, as described in (Mavrakis et al., 2008). Images were acquired at optical zoom 2.5-3.0 with a 25-mW 514-nm argon laser at a tube current of 6.1 A. 0.5% transmission was used for image acquisition (4 μW of 514-nm laser power at the back aperture of the lens) and 10 iterations at 100% transmission were used for photobleaching at a single plane (depth of photobleaching was 7 μm in fixed embryos at identical settings, data not shown). Five prebleach images were acquired in both FRAP and FLIP protocols. For GAP43-Venus images were typically acquired every 600 ms and for Toll-Venus every 2 s. Acquisition was performed at a single plane: a wide open pinhole (11.8-μm thick optical slice) was used for Toll-Venus acquisition, whereas a narrow pinhole (2 Airy units, 1.8-μm thick optical slice) was used for GAP43-Venus so that the large diffuse pool of nonpalmitoylated GAP43 does not interfere with measurements in the PM. Raw fluorescence intensity measurements were background subtracted, corrected for the bleached fraction (for FRAP), laser fluctuations and photobleaching during acquisition, and finally normalized to arbitrary fluorescence units (prebleach time points normalized to one) as described in (Rabut and Ellenberg, 2005). Fluorescence recovery or loss curves were plotted using Microsoft Excel X.
Photoconversion experiments
Photoconversion experiments were performed on a Zeiss 510 Meta or Zeiss LSM510 laser scanning confocal microscope (Carl Zeiss, Thornwood, NY) and a Fluar 40×/1.3 NA oil lens as described in (Mavrakis et al., 2008). Photoactivation of PA-GFP05 was achieved at a single plane (depth of photoactivation was 7 μm based on acquired z-stacks immediately after) using 30 iterations of 0.6 mW of a 405 nm diode laser at the back aperture of the lens at optical zoom 2.5 and 1.60 μs/pixel. Photoconversion of mEos was achieved at a single plane (depth of photoconversion was 7 μm like for PA-GFP05) using 18 iterations of 0.25 mW of a 405 nm diode laser at the back aperture of the lens at optical zoom 2.5 and 0.96 μs/pixel. Imaging of the green (activated) fluorescence of PA-GFP05 was performed with the 488 nm line of an argon ion laser and emission was collected with a 505 longpass emission filter and 3 Airy units (2.4-μm thick optical slice) pinhole size. mEos imaging was performed in multi-tracking mode. The green (non-activated) fluorescence of mEos was imaged with the 488 nm line of an argon ion laser and emission was collected over the range of 505-530 nm. The red (activated) fluorescence of mEos was imaged with the 543 nm line of a HeNe laser and emission was collected with a 560 longpass emission filter. Pinhole size was 2.7 Airy units for each channel (≈2.5-μm thick optical slices).
For quantification of photoconversion experiments for Figure 4, each 4D time-lapse sequence was imported into MetaMorph (Molecular Devices) and z-stacks were projected at each time-point by summing the slices. A region A was drawn right after photoconversion that encompassed all PM domains that were contained in the photoconversion region of interest (see dashed line areas in Figure 4). A region of the exact same shape and size was drawn at the end of the experiment at the next interphase (region B). The average fluorescent intensity was measured in regions A and B using ImageJ freeware (NIH, Bethesda, MD) to calculate the % highlighted fluorescence (in region A) that was contained in region B at the next interphase.
For quantification of photoconversion experiments for Figure 7B, each 4D time-lapse sequence was imported into ImageJ 1.40g freeware (NIH, Bethesda, MD) and green and red channels were split. Green and red image sequences were opened separately using the “Open Series as Image5D” feature of the Image5D plug-in. Z-stacks were then projected at each time-point using the “Z-project” feature of Image5D. To follow changes in membrane geometry/morphology, maximum intensity projections were used for the green channel. To quantitate intensity changes in the red channel, slices were summed at each time-point (the slice closest to the vitelline membrane was omitted when autofluorescence was severely masking the signal). For intensity measurements, ROIs (e.g., 1a and 2a in Figure 7C) were drawn in the maximum intensity projected slices in the green channel where the precise shape and size of PM could be deduced. A same size and shape box was then drawn at the exact same coordinates in the corresponding summed slices in the red channel, where average intensity changes were measured at each time-point for each ROI. Intensity changes over time were plotted using Microsoft Excel.
Supplementary Material
Supplemental Figure 1. (A) FRAP of Toll before nuclear migration (preblastoderm stage). Corresponds to Figure 2C. (B) Photoactivation of Toll before nuclear migration. Fluorescence induced during photoactivation started to drop immediately and steadily in an exponential manner with a 30% decrease within 1.5 min (the time of the experiment before contractions of the early embryo made further quantification impossible), consistent with a dilution of fluorescence due to lateral diffusion of Toll in distant areas outside the photoactivated region. Corresponds to Figure 3C. Scale bar is 10 μm.
Supplemental Figure 2. Optical pulse-chase of Toll during syncytial division 12. Scale bar is 10 μm. Corresponds to Figure 4A.
Supplemental Figure 3. Relative distribution of E-cadherin, Peanut, GAP43 and DPatj from immunostainings in embryos during interphase and mitosis. Optical sections are shown in surface views of embryos stained for E-cadherin / DPatj and Peanut / DPatj; note that DPatj is always present in a section lower than both Peanut and E-cadherin. Corresponds to Figure 5 and Figure 6C-6E.
Supplemental Figure 4. (A) Peanut and DPatj association with the PM is disrupted in latA-injected embryos. Arrows point to PM between adjacent nuclei where Peanut and DPatj are still present in latA-injected embryos. Arrowheads point to PM between adjacent nuclei where Peanut and DPatj are largely absent. Neither of Peanut or DPatj was found in PM over adjacent nuclei. Corresponds to Figure 5C-D. (B) Surface view of a GAP43-mEos expressing embryo treated with latA. Optical sections are shown at different depths to illustrate the loss of PM integrity. Arrows point to membranes that are lost in deeper sections whereas the arrowhead points to a membrane still intact under these conditions. Corresponds to Figure 7B-C.
Supplemental Movie 1. FLIP of GAP43-Venus at a surface view of an embryo during syncytial interphase. Image intervals are 591 msec, frames are shown at 6 frames/s. Corresponds to Figure 3B.
Supplemental Movie 2. FLIP of Toll-Venus at a surface view of an embryo during syncytial interphase. Image intervals are 3.47 sec, frames are shown at 7 frames/s. Corresponds to Figure 3C.
Supplemental Movie 3. Photoactivation of Toll-PA-GFP05 at a surface view of an embryo during syncytial interphase 13. Image intervals are 18.66 sec, frames are shown at 6 frames/s. Corresponds to Figure 4A.
Supplemental Movie 4. Time-lapse of syncytial mitosis 13 at a sagittal view in an embryo expressing PH(PLCδ1)-Cerulean. Image intervals are 30 sec, frames are shown at 5 frames/s. Corresponds to Figure 6B.
Acknowledgments
We thank the members of the Lippincott-Schwartz and Mary Lilly labs for their support throughout this work, as well as Dr. Yannick Azou, Dr. Bernhard Hampoelz and Dr. Loïc Le Goff for their valuable comments and helpful discussions. We are especially grateful to Mary Lilly for providing us with the facility for Drosophila work. This work was supported by the Intramural Research Program of the NIH, National Institute of Child Health and Human Development.
Footnotes
Publisher's Disclaimer: This is a PDF file of an unedited manuscript that has been accepted for publication. As a service to our customers we are providing this early version of the manuscript. The manuscript will undergo copyediting, typesetting, and review of the resulting proof before it is published in its final citable form. Please note that during the production process errors may be discovered which could affect the content, and all legal disclaimers that apply to the journal pertain.
References
- Anderson KV, Bokla L, Nusslein-Volhard C. Establishment of dorsal-ventral polarity in the Drosophila embryo: the induction of polarity by the Toll gene product. Cell. 1985;42:791–798. doi: 10.1016/0092-8674(85)90275-2. [DOI] [PubMed] [Google Scholar]
- Bhat MA, Izaddoost S, Lu Y, Cho KO, Choi KW, Bellen HJ. Discs Lost, a novel multi-PDZ domain protein, establishes and maintains epithelial polarity. Cell. 1999;96:833–845. doi: 10.1016/s0092-8674(00)80593-0. [DOI] [PubMed] [Google Scholar]
- Cao J, Albertson R, Riggs B, Field CM, Sullivan W. Nuf, a Rab11 effector, maintains cytokinetic furrow integrity by promoting local actin polymerization. J Cell Biol. 2008;182:301–313. doi: 10.1083/jcb.200712036. [DOI] [PMC free article] [PubMed] [Google Scholar]
- Casanova J, Struhl G. Localized surface activity of torso, a receptor tyrosine kinase, specifies terminal body pattern in Drosophila. Genes & development. 1989;3:2025–2038. doi: 10.1101/gad.3.12b.2025. [DOI] [PubMed] [Google Scholar]
- Coppey M, Berezhkovskii AM, Kim Y, Boettiger AN, Shvartsman SY. Modeling the bicoid gradient: diffusion and reversible nuclear trapping of a stable protein. Developmental biology. 2007;312:623–630. doi: 10.1016/j.ydbio.2007.09.058. [DOI] [PMC free article] [PubMed] [Google Scholar]
- Coue M, Brenner SL, Spector I, Korn ED. Inhibition of actin polymerization by latrunculin A. FEBS letters. 1987;213:316–318. doi: 10.1016/0014-5793(87)81513-2. [DOI] [PubMed] [Google Scholar]
- DeLotto R, DeLotto Y, Steward R, Lippincott-Schwartz J. Nucleocytoplasmic shuttling mediates the dynamic maintenance of nuclear Dorsal levels during Drosophila embryogenesis. Development (Cambridge, England) 2007;134:4233–4241. doi: 10.1242/dev.010934. [DOI] [PubMed] [Google Scholar]
- Fares H, Peifer M, Pringle JR. Localization and possible functions of Drosophila septins. Mol Biol Cell. 1995;6:1843–1859. doi: 10.1091/mbc.6.12.1843. [DOI] [PMC free article] [PubMed] [Google Scholar]
- Field CM, al-Awar O, Rosenblatt J, Wong ML, Alberts B, Mitchison TJ. A purified Drosophila septin complex forms filaments and exhibits GTPase activity. J Cell Biol. 1996;133:605–616. doi: 10.1083/jcb.133.3.605. [DOI] [PMC free article] [PubMed] [Google Scholar]
- Foe VE, Alberts BM. Studies of nuclear and cytoplasmic behaviour during the five mitotic cycles that precede gastrulation in Drosophila embryogenesis. J Cell Sci. 1983;61:31–70. doi: 10.1242/jcs.61.1.31. [DOI] [PubMed] [Google Scholar]
- Furriols M, Casanova J. In and out of Torso RTK signalling. The EMBO journal. 2003;22:1947–1952. doi: 10.1093/emboj/cdg224. [DOI] [PMC free article] [PubMed] [Google Scholar]
- Gay NJ, Keith FJ. Regulation of translation and proteolysis during the development of embryonic dorso-ventral polarity in Drosophila. Homology of easter proteinase with Limulus proclotting enzyme and translational activation of Toll receptor synthesis. Biochimica et biophysica acta. 1992;1132:290–296. doi: 10.1016/0167-4781(92)90163-t. [DOI] [PubMed] [Google Scholar]
- Gregor T, Wieschaus EF, McGregor AP, Bialek W, Tank DW. Stability and nuclear dynamics of the bicoid morphogen gradient. Cell. 2007;130:141–152. doi: 10.1016/j.cell.2007.05.026. [DOI] [PMC free article] [PubMed] [Google Scholar]
- Hashimoto C, Gerttula S, Anderson KV. Plasma membrane localization of the Toll protein in the syncytial Drosophila embryo: importance of transmembrane signaling for dorsal-ventral pattern formation. Development (Cambridge, England) 1991;111:1021–1028. doi: 10.1242/dev.111.4.1021. [DOI] [PubMed] [Google Scholar]
- Hashimoto C, Hudson KL, Anderson KV. The Toll gene of Drosophila, required for dorsal-ventral embryonic polarity, appears to encode a transmembrane protein. Cell. 1988;52:269–279. doi: 10.1016/0092-8674(88)90516-8. [DOI] [PubMed] [Google Scholar]
- Jacobson K, Ishihara A, Inman R. Lateral diffusion of proteins in membranes. Annual review of physiology. 1987;49:163–175. doi: 10.1146/annurev.ph.49.030187.001115. [DOI] [PubMed] [Google Scholar]
- Karr TL, Alberts BM. Organization of the cytoskeleton in early Drosophila embryos. J Cell Biol. 1986;102:1494–1509. doi: 10.1083/jcb.102.4.1494. [DOI] [PMC free article] [PubMed] [Google Scholar]
- Kenworthy AK, Nichols BJ, Remmert CL, Hendrix GM, Kumar M, Zimmerberg J, Lippincott-Schwartz J. Dynamics of putative raft-associated proteins at the cell surface. J Cell Biol. 2004;165:735–746. doi: 10.1083/jcb.200312170. [DOI] [PMC free article] [PubMed] [Google Scholar]
- Lecuit T, Samanta R, Wieschaus E. slam encodes a developmental regulator of polarized membrane growth during cleavage of the Drosophila embryo. Dev Cell. 2002;2:425–436. doi: 10.1016/s1534-5807(02)00141-7. [DOI] [PubMed] [Google Scholar]
- Lecuit T, Wieschaus E. Polarized insertion of new membrane from a cytoplasmic reservoir during cleavage of the Drosophila embryo. J Cell Biol. 2000;150:849–860. doi: 10.1083/jcb.150.4.849. [DOI] [PMC free article] [PubMed] [Google Scholar]
- Lippincott-Schwartz J, Patterson GH. Development and use of fluorescent protein markers in living cells. Science. 2003;300:87–91. doi: 10.1126/science.1082520. [DOI] [PubMed] [Google Scholar]
- Lippincott-Schwartz J, Patterson GH. Fluorescent proteins for photoactivation experiments. Methods in cell biology. 2008;85:45–61. doi: 10.1016/S0091-679X(08)85003-0. [DOI] [PubMed] [Google Scholar]
- Martin-Belmonte F, Gassama A, Datta A, Yu W, Rescher U, Gerke V, Mostov K. PTEN-mediated apical segregation of phosphoinositides controls epithelial morphogenesis through Cdc42. Cell. 2007;128:383–397. doi: 10.1016/j.cell.2006.11.051. [DOI] [PMC free article] [PubMed] [Google Scholar]
- Mavrakis M, Rikhy R, Lilly M, Lippincott-Schwartz J. Fluorescence imaging techniques for studying Drosophila embryo development. Current protocols in cell biology / editorial board. 2008b:18. doi: 10.1002/0471143030.cb0418s39. Juan S Bonifacino [et al Chapter 4, Unit 4. [DOI] [PubMed] [Google Scholar]
- McCartney BM, McEwen DG, Grevengoed E, Maddox P, Bejsovec A, Peifer M. Drosophila APC2 and Armadillo participate in tethering mitotic spindles to cortical actin. Nature cell biology. 2001;3:933–938. doi: 10.1038/ncb1001-933. [DOI] [PubMed] [Google Scholar]
- Moussian B, Roth S. Dorsoventral axis formation in the Drosophila embryo--shaping and transducing a morphogen gradient. Curr Biol. 2005;15:R887–899. doi: 10.1016/j.cub.2005.10.026. [DOI] [PubMed] [Google Scholar]
- Muller HA, Wieschaus E. armadillo, bazooka, and stardust are critical for early stages in formation of the zonula adherens and maintenance of the polarized blastoderm epithelium in Drosophila. J Cell Biol. 1996;134:149–163. doi: 10.1083/jcb.134.1.149. [DOI] [PMC free article] [PubMed] [Google Scholar]
- Nagai T, Ibata K, Park ES, Kubota M, Mikoshiba K, Miyawaki A. A variant of yellow fluorescent protein with fast and efficient maturation for cell-biological applications. Nat Biotechnol. 2002;20:87–90. doi: 10.1038/nbt0102-87. [DOI] [PubMed] [Google Scholar]
- Nelson WJ. Adaptation of core mechanisms to generate cell polarity. Nature. 2003;422:766–774. doi: 10.1038/nature01602. [DOI] [PMC free article] [PubMed] [Google Scholar]
- Oda H, Tsukita S. Real-time imaging of cell-cell adherens junctions reveals that Drosophila mesoderm invagination begins with two phases of apical constriction of cells. J Cell Sci. 2001;114:493–501. doi: 10.1242/jcs.114.3.493. [DOI] [PubMed] [Google Scholar]
- Patterson GH, Lippincott-Schwartz J. A photoactivatable GFP for selective photolabeling of proteins and cells. Science. 2002;297:1873–1877. doi: 10.1126/science.1074952. [DOI] [PubMed] [Google Scholar]
- Rabut G, Ellenberg J. Photobleaching Techniques to Study Mobility and Molecular Dynamics of Proteins in Live Cells: FRAP, iFRAP, and FLIP. In: Goldman RD, Spector DL, editors. Live Cell Imaging: A Laboratory Manual. Cold Spring Harbor Laboratory Press; 2005. pp. 101–126. [DOI] [PubMed] [Google Scholar]
- Roth S, Stein D, Nusslein-Volhard C. A gradient of nuclear localization of the dorsal protein determines dorsoventral pattern in the Drosophila embryo. Cell. 1989;59:1189–1202. doi: 10.1016/0092-8674(89)90774-5. [DOI] [PubMed] [Google Scholar]
- Rothwell WF, Sullivan W. Fluorescent Analysis of Drosophila Embryos. In: Sullivan W, Ashburner M, Hawley RS, editors. Drosophila Protocols. Cold Spring Harbor, New York: Cold Spring Harbor Laboratory Press; 2000. pp. 141–157. [Google Scholar]
- Schneider DS, Hudson KL, Lin TY, Anderson KV. Dominant and recessive mutations define functional domains of Toll, a transmembrane protein required for dorsal-ventral polarity in the Drosophila embryo. Genes & development. 1991;5:797–807. doi: 10.1101/gad.5.5.797. [DOI] [PubMed] [Google Scholar]
- Simons K, van Meer G. Lipid sorting in epithelial cells. Biochemistry. 1988;27:6197–6202. doi: 10.1021/bi00417a001. [DOI] [PubMed] [Google Scholar]
- Sisson JC, Field C, Ventura R, Royou A, Sullivan W. Lava lamp, a novel peripheral golgi protein, is required for Drosophila melanogaster cellularization. J Cell Biol. 2000;151:905–918. doi: 10.1083/jcb.151.4.905. [DOI] [PMC free article] [PubMed] [Google Scholar]
- Sokac AM, Wieschaus E. Local actin-dependent endocytosis is zygotically controlled to initiate Drosophila cellularization. Dev Cell. 2008a;14:775–786. doi: 10.1016/j.devcel.2008.02.014. [DOI] [PMC free article] [PubMed] [Google Scholar]
- Sokac AM, Wieschaus E. Zygotically controlled F-actin establishes cortical compartments to stabilize furrows during Drosophila cellularization. J Cell Sci. 2008b;121:1815–1824. doi: 10.1242/jcs.025171. [DOI] [PMC free article] [PubMed] [Google Scholar]
- Spiliotis ET, Nelson WJ. Here come the septins: novel polymers that coordinate intracellular functions and organization. J Cell Sci. 2006;119:4–10. doi: 10.1242/jcs.02746. [DOI] [PMC free article] [PubMed] [Google Scholar]
- Stern DL, Sucena E. Preparation of Larval and Adult Cuticles for Light Microscopy. In: Sullivan W, Ashburner M, Hawley RS, editors. Drosophila Protocols. Cold Spring Harbor, New York: Cold Spring Harbor Laboratory Press; 2000. pp. 606–609. [Google Scholar]
- Steward R, Zusman SB, Huang LH, Schedl P. The dorsal protein is distributed in a gradient in early Drosophila embryos. Cell. 1988;55:487–495. doi: 10.1016/0092-8674(88)90035-9. [DOI] [PubMed] [Google Scholar]
- Thomas GH, Williams JA. Dynamic rearrangement of the spectrin membrane skeleton during the generation of epithelial polarity in Drosophila. J Cell Sci. 1999;112(Pt 17):2843–2852. doi: 10.1242/jcs.112.17.2843. [DOI] [PubMed] [Google Scholar]
- Turner FR, Mahowald AP. Scanning electron microscopy of Drosophila embryogenesis. 1. The structure of the egg envelopes and the formation of the cellular blastoderm. Developmental biology. 1976;50:95–108. doi: 10.1016/0012-1606(76)90070-1. [DOI] [PubMed] [Google Scholar]
- Van Doren M, Williamson AL, Lehmann R. Regulation of zygotic gene expression in Drosophila primordial germ cells. Curr Biol. 1998;8:243–246. doi: 10.1016/s0960-9822(98)70091-0. [DOI] [PubMed] [Google Scholar]
- Varnai P, Balla T. Visualization of phosphoinositides that bind pleckstrin homology domains: calcium- and agonist-induced dynamic changes and relationship to myo-[3H]inositol-labeled phosphoinositide pools. J Cell Biol. 1998;143:501–510. doi: 10.1083/jcb.143.2.501. [DOI] [PMC free article] [PubMed] [Google Scholar]
- Wiedenmann J, Ivanchenko S, Oswald F, Schmitt F, Rocker C, Salih A, Spindler KD, Nienhaus GU. EosFP, a fluorescent marker protein with UV-inducible green-to-red fluorescence conversion. Proc Natl Acad Sci U S A. 2004;101:15905–15910. doi: 10.1073/pnas.0403668101. [DOI] [PMC free article] [PubMed] [Google Scholar]
- Zacharias DA, Violin JD, Newton AC, Tsien RY. Partitioning of lipid-modified monomeric GFPs into membrane microdomains of live cells. Science. 2002;296:913–916. doi: 10.1126/science.1068539. [DOI] [PubMed] [Google Scholar]
Associated Data
This section collects any data citations, data availability statements, or supplementary materials included in this article.
Supplementary Materials
Supplemental Figure 1. (A) FRAP of Toll before nuclear migration (preblastoderm stage). Corresponds to Figure 2C. (B) Photoactivation of Toll before nuclear migration. Fluorescence induced during photoactivation started to drop immediately and steadily in an exponential manner with a 30% decrease within 1.5 min (the time of the experiment before contractions of the early embryo made further quantification impossible), consistent with a dilution of fluorescence due to lateral diffusion of Toll in distant areas outside the photoactivated region. Corresponds to Figure 3C. Scale bar is 10 μm.
Supplemental Figure 2. Optical pulse-chase of Toll during syncytial division 12. Scale bar is 10 μm. Corresponds to Figure 4A.
Supplemental Figure 3. Relative distribution of E-cadherin, Peanut, GAP43 and DPatj from immunostainings in embryos during interphase and mitosis. Optical sections are shown in surface views of embryos stained for E-cadherin / DPatj and Peanut / DPatj; note that DPatj is always present in a section lower than both Peanut and E-cadherin. Corresponds to Figure 5 and Figure 6C-6E.
Supplemental Figure 4. (A) Peanut and DPatj association with the PM is disrupted in latA-injected embryos. Arrows point to PM between adjacent nuclei where Peanut and DPatj are still present in latA-injected embryos. Arrowheads point to PM between adjacent nuclei where Peanut and DPatj are largely absent. Neither of Peanut or DPatj was found in PM over adjacent nuclei. Corresponds to Figure 5C-D. (B) Surface view of a GAP43-mEos expressing embryo treated with latA. Optical sections are shown at different depths to illustrate the loss of PM integrity. Arrows point to membranes that are lost in deeper sections whereas the arrowhead points to a membrane still intact under these conditions. Corresponds to Figure 7B-C.
Supplemental Movie 1. FLIP of GAP43-Venus at a surface view of an embryo during syncytial interphase. Image intervals are 591 msec, frames are shown at 6 frames/s. Corresponds to Figure 3B.
Supplemental Movie 2. FLIP of Toll-Venus at a surface view of an embryo during syncytial interphase. Image intervals are 3.47 sec, frames are shown at 7 frames/s. Corresponds to Figure 3C.
Supplemental Movie 3. Photoactivation of Toll-PA-GFP05 at a surface view of an embryo during syncytial interphase 13. Image intervals are 18.66 sec, frames are shown at 6 frames/s. Corresponds to Figure 4A.
Supplemental Movie 4. Time-lapse of syncytial mitosis 13 at a sagittal view in an embryo expressing PH(PLCδ1)-Cerulean. Image intervals are 30 sec, frames are shown at 5 frames/s. Corresponds to Figure 6B.