Abstract
Folding of the Tetrahymena self-splicing RNA into its active conformation involves a set of discrete intermediate states. The Mg2+-dependent equilibrium transition from the intermediates to the native structure is more cooperative than the formation of the intermediates from the unfolded states. We show that the degree of cooperativity is linked to the free energy of each transition and that the rate of the slow transition from the intermediates to the native state decreases exponentially with increasing Mg2+ concentration. Monovalent salts, which stabilize the folded RNA nonspecifically, induce states that fold in less than 30 s after Mg2+ is added to the RNA. A simple model is proposed that predicts the folding kinetics from the Mg2+-dependent change in the relative stabilities of the intermediate and native states.
The diverse biological functions performed by RNA molecules in the cell require that they form complex three-dimensional structures (1). A well studied example is the self-splicing intron, or ribozyme, from Tetrahymena thermophila rDNA (2). Binding of Mg2+ is required to stabilize the folded tertiary structure of the ribozyme and for catalytic activity (3).
Despite recent progress in understanding RNA folding mechanisms (1, 4), the Mg2+-dependent self-assembly of large structures remains a challenging problem. The thermodynamics and kinetics of folding transitions that are coupled to ion binding have been studied in detail for tRNA and other small RNAs (5–9). These studies showed that condensation of the RNA chain is stabilized to a large extent by nonspecific electrostatic screening provided by delocalized, hydrated cations. However, a small number of ions bound in discrete high-affinity sites stabilize specific tertiary conformations (5, 7, 10, 11). This stabilization is accomplished by direct interactions with ligands provided by the folded RNA (12, 13). As a result, binding of Mg2+ not only stabilizes the native conformation but also directs the pathway of self-assembly (10, 14).
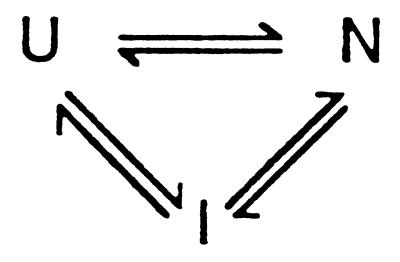
The complex structure of large RNAs suggests that the folding process is likely to involve multiple equilibrium states. Thermal unfolding of the Tetrahymena ribozyme involves at least two transitions (15), and equilibrium and kinetic folding experiments in the presence of MgCl2 revealed intermediates in which only the independently stable P4–P6 domain was folded (16–21). We have shown that urea-induced denaturation of the pre-RNA containing the Tetrahymena ribozyme involves at least three states (22), as outlined in Scheme SI.
Scheme I.
.
The kinetic partitioning mechanism that we previously proposed (23) postulates that a fraction of the initially unfolded population reaches the native state on the time scale of seconds. This prediction is supported by recent experiments that probed the structure of the ribozyme on second time scales (21). However, the majority of the population reaches the native state N via an intermediate I. Similarly, the equilibrium folding of RNase P RNA, another large catalytic RNA, is best described by a three-state transition, as detected by UV absorbance and CD spectroscopy (24).
Here, we present a simplified framework for considering cooperative transitions in large RNAs and their effect on the Mg2+-dependent folding kinetics. By using the Tetrahymena self-splicing RNA as an example, we show that the cooperativity of the Mg2+-dependent I ⇔ N transition is determined by the relative stabilities of the I and N states at saturating Mg2+ concentrations. The intermediate contains at least some nonnative interactions that must dissociate during the transition to the native structure (22, 25). As a result, the increased stability of I at higher Mg2+ concentrations leads to a decrease in the rate of folding.
MATERIALS AND METHODS
Preparation of RNA and Native Gel Electrophoresis.
Uniformly 32P-labeled Tetrahymena precursor RNA (657 nt) was transcribed from plasmid pSW012 as described (26). Pre-RNA was annealed by heating at 95°C for 1 min in splicing buffer without MgCl2 (50 mM Na Hepes/100 mM ammonium sulfate/1 mM EDTA, pH 7.5) followed by rapid cooling (≤30 s) (27) in the presence of 0–10 mM MgCl2 (25). The same procedure was used to anneal samples in the presence of other salts. Glycerol (10% vol/vol) and xylene cyanol (0.1%) were added to samples immediately before loading on a native 6% polyacrylamide gel in 34 mM Tris/66 mM Hepes/0.1 mM EDTA/10 mM MgCl2 (pH 7.5) at 10°C (28). Folding experiments at 30°C were carried out by incubating pre-RNA samples for 2 hr in splicing buffer containing 0–10 mM MgCl2 plus 10% glycerol and xylene cyanol. The fractions of N and I were determined by quantifying bands 1 and 4 relative to the total pre-RNA in each lane by using a PhosphorImager. The data were fit to ƒN = ƒα or ƒI = 1 − ƒα, with ƒα = (ƒ − ƒmin)/(ƒmax − ƒmin) = (C/Cmα)n/[1 + (C/Cmα)n]; where C is Mg2+ concentration, Cmα is the midpoint of the transition, and n is the Hill constant.
Determination of Folding Rates.
Pre-RNA was incubated in splicing buffer containing 0–10 mM MgCl2 at 30°C plus 10% (vol/vol) glycerol, as above. Aliquots were removed at specified times up to 120 min and loaded directly into the well of a native 6% polyacrylamide gel as described (22). Unfolding rates were measured by annealing the pre-RNA at 95°C in 6 mM MgCl2 and then diluting into splicing buffer at 30°C so that the final MgCl2 concentration was 2–4.25 mM. The results described here and elsewhere (29) suggest that folding is arrested when the RNA enters the gel matrix. Folding during the time required for the RNA to enter the gel (15–30 s) was minimized by the low temperatures of the tank buffer (4°C) and gel (<10°C).
The rate equations for the mechanism in Scheme SI have been described, and result in two kinetic phases (30). In the limit in which the two phases are well separated, the observed time constants approximate those of the individual pathways. The U-to-N pathway is faster than the smallest accessible times in our experiments, and is ignored in our analysis. The fraction of native or intermediate RNA (ƒN or ƒI) was quantified as above. The fraction of N (ƒN) was fit to ƒN(t) = AN (1 − exp (−kNt)), where AN is the amplitude of the folding transition. Below 4.5 mM MgCl2, the fraction of I was fit to ƒI(t) = ƒI(0) ± AI (1 − exp(−kIt)), where AI is the amplitude of the slow transition and ƒI(0) is the fraction of I at time zero. The upper sign holds below Cm, and the lower above Cm. Above 4.5 mM MgCl2, ƒI was fit to ƒI(t) = ƒI(0) + Afast (1 − exp(−kfastt)) + AI (1 − exp(−kIt)), where Afast is the residual amplitude of the fast transition and kfast ≈ 2–10 min−1. Unfolding reactions were fit to a first-order rate equation.
RESULTS
Magnesium-Dependent Equilibrium Transitions of the Pre-RNA.
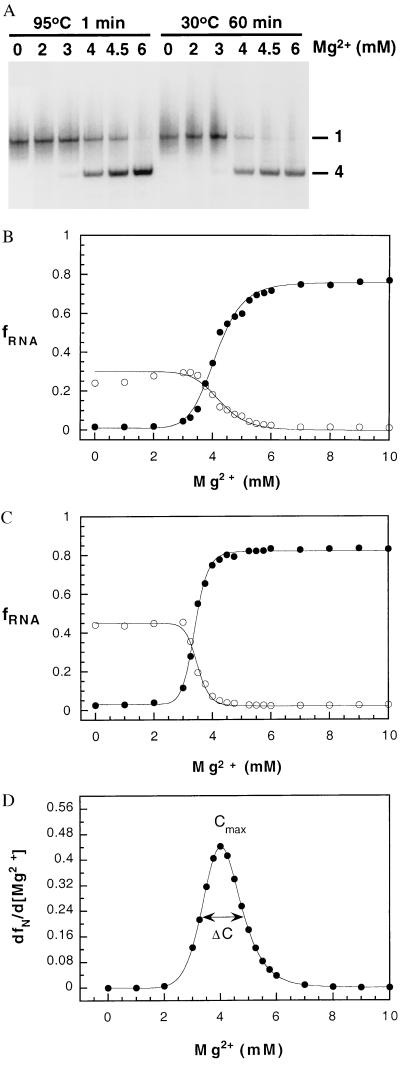
To describe the role of cations in inducing conformational transitions in RNA, it is necessary to measure the degree of cooperativity in the two equilibrium transitions, namely, U ⇔ I and I ⇔ N. We monitored the fraction of fully folded and partially folded pre-RNA as a function of Mg2+ concentration by using nondenaturing PAGE (29). Unrenatured or denatured RNA migrated as a broad smear, suggesting that the initial population is conformationally heterogeneous (24). Much of the RNA secondary structure is expected to be stable under these conditions (15). On incubation in Mg2+-containing buffer or renaturation by heating to 95°C for 1 min and cooling in the presence of MgCl2 (27), the pre-RNA was converted to a mixture of an inactive intermediate (Fig. 1A, band 1) and the active or native form (Fig. 1A, band 4).
Figure 1.
Magnesium-dependent folding of the Tetrahymena pre-RNA. (A) 32P-labeled pre-RNA was annealed at 95°C or incubated at 30°C in buffer containing the concentration of MgCl2 indicated above each lane, before loading on a native 6% polyacrylamide gel at 10°C (see Materials and Methods). Band 1, folding intermediate (I); band 4, RNA that is competent to self-splice (N) (29). Diffuse radioactivity above and below band 1 is defined as unfolded RNA (U). (B) Mg2+ dependence of I and N after annealing at 95°C. ●, fraction of native pre-RNA (ƒN); ○, fraction of intermediate (ƒI). The fraction of unfolded RNA (ƒU) is obtained from ƒU + ƒI + ƒN = 1. For clarity, ƒU is not plotted. ƒN and ƒI were fit to the Hill equation independently as described in Materials and Methods. Values were Cmα = 4.1 ± 0.03 and 4.2 ± 0.05 mM, for N and I respectively, and n = 9.0 ± 0.8. C, Fraction of I and N after 2 hr at 30°C in splicing buffer plus MgCl2 and 10% glycerol. Symbols and curves are as in B. CmN = 3.4 ± 0.01; CmI = 3.5 ± 0.02 mM; nN = 15 ± 0.7 and nI = 17 ± 1. (D) Derivative of ƒN with respect to Mg2+ concentration. Values of Cmax and (dfx/dC)max were obtained analytically from the curve in B. ΔC is the width of the curve at ½ (dƒα/dC)max.
Our earlier work suggested that band 1 of the native gel should be viewed as a collection of conformationally related intermediates (25). Because the number of intermediate states is hard to estimate, we will treat the collection of species in band 1 as a class of nearly equivalent states and denote them as equilibrium intermediate I. Similarly, the ensemble of denatured structures will be considered to be the unfolded state. With these simplifications, the Mg2+-dependent equilibrium folding of the Tetrahymena pre-RNA can be described by a three-state model (Scheme SI), consistent with previous work (17, 18, 22).
To determine the Mg2+ dependence of folding, the pre-RNA was renatured at 95°C in various concentrations of MgCl2 (Fig. 1B). At MgCl2 concentrations <2.5 mM, the RNA was distributed between the U and I states. The fraction of I increased only slightly over this range, and a significant amount was formed even when no MgCl2 was added to the sample. As the concentration of MgCl2 was increased to 6 mM, the pre-RNA exhibited a cooperative transition to the native form, with a midpoint (Cm) of 4.1 mM MgCl2. In other experiments, pre-RNA was incubated in buffer containing MgCl2 for 2 hr at 30°C (Fig. 1C). The results were qualitatively similar as when the RNA was annealed at high temperatures, although the cooperativity was increased and the midpoint was lower (Cm = 3.4 mM) because of the presence of 10% glycerol in the samples during the incubation period (J.P., unpublished data). In all cases, very similar parameters were obtained from fits to ƒN or ƒI vs. Mg2+ concentration. The maximum extent of folding was ≈80%, presumably because of residual misfolded states.
Cooperativity and Stability Are Linked.
The Mg2+ dependence of the folding equilibrium (Fig. 1) was used to estimate the stabilities of I and N. The calculation of the free energies of formation of I and N is facilitated by introducing a quantitative measure that describes the extent to which the two equilibrium transitions (U ⇔ I and I ⇔ N) are cooperative. Consider the dimensionless quantity
 |
1 |
where ƒα is the population of either I or N, Cmax is the concentration of Mg2+ at which the derivative of ƒα with respect to C reaches a maximum,  is the value of the derivative at C = Cmax, and ΔC is the width of the curve at 1/2
 . The value of Cmax almost always coincides with the midpoint of the transition under consideration. For an infinitely sharp transition, Ωc tends to infinity, whereas for a noncooperative transition, Ωc approaches zero.
Because the pre-RNA undergoes a three-state transition, Eq. 1 should be evaluated for the formation of both I and N. If the midpoints for forming I and N are well separated, then the values of ΩcI and ΩcN for the transitions U ⇔ I and I ⇔ N may be calculated independently. The measure of cooperativity in Eq. 1 is dimensionless, and hence one can compare the differences in the cooperativity of formation of I and N on an equal basis. As can be seen in Fig. 1, I ⇔ N is cooperative with respect to Mg2+, and we obtained a value of ΩcN = 4.5 if the pre-RNA was annealed at 95°C or ΩcN = 7.6 when incubated at 30°C.
By contrast, U ⇔ I appeared insensitive to changes in Mg2+ concentration. In part, this is because of the fact that some of the RNA reaches the intermediate state during the 15–30 s required for the samples to enter the gel matrix (see below). Because the electrophoresis buffer contained 10 mM MgCl2, this prevented us from accurately determining the amount of I formed as a result of MgCl2 added to the sample. The results of similar experiments with native gels containing 3 mM MgCl2 and the mildly cooperative thermal unfolding of the pre-RNA in 2 mM MgCl2 (J.P., unpublished data) suggest that U ⇔ I is somewhat dependent on Mg2+ concentration, but much less cooperative than I ⇔ N.
An estimate of the maximum value of the free energy of forming I and N can be obtained from the values of ΩcI and ΩcN, as follows. By treating the folding process of the pre-RNA as two separate two-state transitions, one can express the fraction of RNA in the I or N states as
 |
2 |
where C is the Mg2+ concentration, ΔGβα is the free energy associated with the transition β ⇔ α, and mMg2+ gives a measure of the binding of the divalent cation. The linear variation of free energy with C is expected to hold around Cm, the midpoint of the transition. It is clear from Eq. 2 that the transition β ⇔ α occurs over a broad range of Mg2+ concentration if mMg2+ is large. Thus, for a highly cooperative transition, we expect mMg2+ to be relatively small. For two-state transitions one can show by substituting Eq. 2 into Eq. 1 that
 |
3 |
with α = I or N.
Our measure of cooperativity is qualitatively related to the Hill model. If the Hill constant n is large, then the transition is cooperative, leading to a large value of Ωcα. This implies that the ith Mg2+ ion binds more readily than the (i − 1)th ion. This feature is captured in Eq. 3 by the linkage between the degree of cooperativity and the free energy gap between the α and β states. The advantage of by using Eqs. 1 and 3 is that we only need to know the properties of the equilibrium curve around the midpoint of the transition, which can be obtained fairly accurately for I ⇔ N. More importantly, a direct estimate of ΔGβα is obtained without making the assumption that the binding constants of all of the Mg2+ ions are identical, which is only valid for an infinitely cooperative transition.
From the values of ΩcN above, we find that ΔGUN is −4.8 (95°C annealing) or −6.2 kcal/mol (1 kcal = 4.18 J) (30°C). This establishes that the extent of cooperativity is determined by the relative stability of the initial and final states. The apparently weak dependence of U ⇔ I on Mg2+ suggests that ΔGUI is small.
Specificity of Cation Interactions.
The decreased cooperativity of U ⇔ I with respect to Mg2+ suggested that formation of the intermediate is less dependent on coordination of Mg2+ at discrete sites than the native state. If this hypothesis is true, structures resembling I should also result when folding is initiated by monovalent ions. Nonspecific association of monovalent and other divalent ions with the RNA is expected to promote condensation of the RNA, although much greater concentrations of monovalent ions are required to achieve a similar degree of charge stabilization in aqueous solution (31). For example, ≈1 M NaCl is required to stabilize the secondary structure of the Tetrahymena ribozyme to the same extent as 5 mM MgCl2 (32).
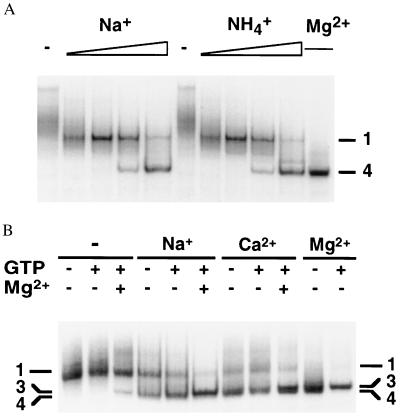
Folding of the pre-RNA in the presence of Na+ or NH4+ was monitored by gel electrophoresis as before (Fig. 2A). When no MgCl2 was added to the sample, 100–250 mM NaCl was sufficient to induce a band corresponding to the intermediate seen in Fig. 1A. Similar results were obtained with (NH4)2SO4, indicating that this effect is due primarily to increased ionic strength rather than to specific interactions with Na+ ions (Fig. 2A). Most of the pre-RNA migrated as the fully folded form (band 4) when annealed in 1 M NaCl and no Mg2+. The folded pre-RNA was active, because it was shifted to a band with a slightly lower mobility when incubated with GTP (data not shown). This GTP-dependent electrophoretic species contains a complex of spliced products and is indicative of self-splicing activity (29). We confirmed that self-splicing requires Mg2+ or Mn2+ under the conditions of these experiments (data not shown). Therefore, the formation of active pre-RNA in these experiments must be because of the presence of Mg2+ ions in the electrophoresis buffer.
Figure 2.
Monovalent ions induce rapid folding of the pre-RNA. (A) RNA was annealed at 95°C in 50 mM Na-Hepes, pH 7.5/1 mM EDTA plus one of the following: no addition (−); 0.1, 0.25, 0.5, or 1 M NaCl; 0.1–1 M (NH4)2SO4; or 6 mM MgCl2, before electrophoresis on a native 6% polyacrylamide gel. The gel and running buffer contained 10 mM MgCl2. (B) Pre-RNA was annealed as above with no salt (−), 1 M NaCl, 6 mM CaCl2, or 6 mM MgCl2. Samples were incubated for 30 s at 30°C with (+) or without (−) 0.1 mM GTP and 6 mM MgCl2 immediately before loading. The MgCl2 in the gel and running buffer was replaced by 10 mM CaCl2.
To further assess the specific requirements for Mg2+ during folding, similar experiments were carried out on native gels equilibrated in 10 mM CaCl2. Ca2+ stabilizes the tertiary structure of the ribozyme but is not sufficient for catalysis (18, 33). As illustrated in Fig. 2B, pre-RNA that was annealed in either 1 M NaCl or 6 mM CaCl2 attained an electrophoretic mobility similar to that of the native state, although band 4 was slightly broadened. In gels containing CaCl2, however, active pre-RNA was only formed if the samples were incubated with 6 mM MgCl2 for 30 s at 30°C before loading. Thus, a fraction of the ion-binding sites must be specifically occupied by Mg2+ in the active state, consistent with previous work (33). The minimum number of Mg2+ ions bound in the I ⇔ N transition in 100 mM (NH4)2SO4 was estimated to be nine, from an analysis of the fraction of native pre-RNA using the Hill equation (Fig. 1B). This value is nearly the same as that obtained when the formation of active ribozyme was monitored by photocrosslinking (17, 34).
The results above show that nonspecific cation interactions stabilize the I and N states. Annealing in high concentrations of Na+ or NH4+ or low concentrations of Ca2+ induce conformational states that are able to rapidly reach the active state, either during the time required for the RNA to enter the gel matrix (15–30 s) (Fig. 2A) or after a 30-s incubation in 6 mM MgCl2 at 30°C (Fig. 2B). In early experiments, slower folding of tRNA at low ionic strength was attributed to the prevalence of extended, noncloverleaf secondary structures (6). By analogy, nonspecific ionic interactions may alter the average structure of the unfolded pre-RNA population. The lower gel mobility of I suggests that it is less compact than N, and this is consistent with the fact that greater concentrations of monovalent salts are required to induce formation of N than are required for the formation of I.
Mg2+ Dependence of the Folding Kinetics.
As the relative stabilities of I and N depend on Mg2+, the folding kinetics of the pre-RNA are also expected to vary with Mg2+ concentration. Because the time scale of the direct conversion of U to N is shorter than the time required for samples to enter the native gel (15–30 s), the present experiments only reveal the I ⇔ N transitions, which occur on the minute time scale. Nonetheless, because ≈90% of the RNA population folds via pathways that involve I, many aspects of the folding kinetics can be deduced from the experiments described here. In particular, the rugged energy landscapes arising from topological frustration are manifested in the complex slow kinetics (23).
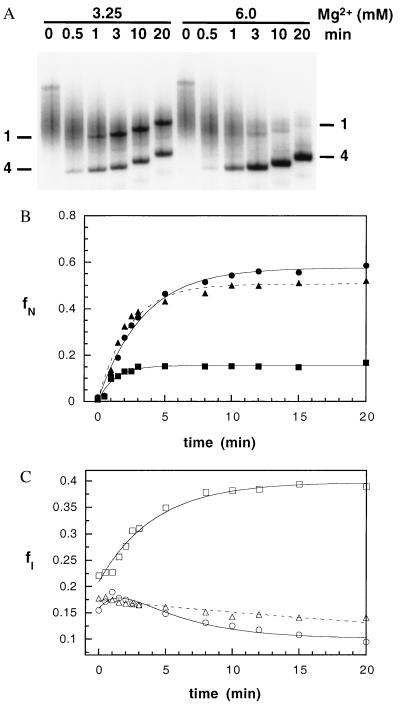
The populations of I and N were monitored as a function of time (Fig. 3A) as described (22) and in Materials and Methods. Folding reactions were initiated by adding MgCl2 to unrenatured pre-RNA in 0.1 M (NH4)2SO4 at 30°C. Nearly identical results were obtained with pre-RNA that was denatured at 95°C in 7.5 M urea before the start of the folding reaction (data not shown). A significant fraction of I was formed within the initial time of the experiment [ƒI (30 s) ≈ 0.2], suggesting that U ⇔ I is rapid for some of the population. This result is consistent with the apparent lack of dependence of ƒI on Mg2+ concentration in the equilibrium titrations in Fig. 1B.
Figure 3.
Folding kinetics of the pre-RNA. (A) Folding reactions at 30°C were analyzed after 0–20 min in 3.25 or 6.0 mM MgCl2 by native gel electrophoresis as described (22). The gel was run continuously during the experiment, so that samples loaded at 20 min have migrated a shorter distance. (B) Formation of native pre-RNA at 30°C. ■, 3.25 mM; ▴, 4.0 mM; ●, 6.0 mM MgCl2. The data were fit to a first-order rate equation as described in Materials and Methods. For clarity, only the first 20 min of the reaction are shown. An additional slow kinetic phase can be resolved when ƒN(t) is monitored over 120 min (22). (C) Formation of intermediates (I). Symbols are as in B. The data were fit to equations with one or two exponential terms (see Materials and Methods).
Assuming that rapid formation of I results from nonspecific ion binding, a theoretical estimate of the time scale for U ⇔ I can be made. The nonspecific compaction of chains is predicted to occur on the time scale τNC ≈ τ0N2.2, where N is the number of nucleotides (35). The prefactor, τ0, which is a function of the viscosity and the persistence length of RNA, is on the order of 1 ns. For the pre-RNA, N = 657, and this yields τNC ≈ 2 ms, which is considerably smaller than the deadtime of our assay. Pan and Sosnick have argued, by using spectroscopic probes, that the equilibrium intermediate in P RNA forms in less than ≈1 ms (24).
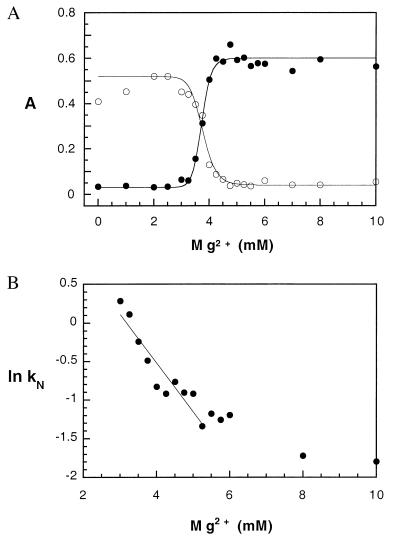
A complete analysis of the folding kinetics according to triangle mechanism in Scheme SI should include both the fast pathway that is associated with the direct U ⇔ N transition and the slow pathway involving I. Because the majority of molecules fold via intermediate states, and because I is initially formed rapidly compared with the time required to convert I to N, the appearance of N can be treated as arising from a two-state unimolecular process. With these assumptions, the time dependence of ƒN(t) and ƒI(t) were fit to single exponential equations (Fig. 3 B and C). As shown in Fig. 4A, the yield of native pre-RNA (AN) increased cooperatively with Mg2+ concentration with a midpoint of 3.7 mM, in agreement with the equilibrium titration experiments (Fig. 1C). The yield of the intermediate, however, decreased with increasing Mg2+ (Fig. 4A). At concentrations of Mg2+ below the midpoint of I ⇔ N, the amount of I continued to increase with time after the first 30 s. Above the midpoint, the fraction of I decreased with time. This change in the direction of the folding process reflects the change in the relative stabilities of I and N.
Figure 4.
Mg2+ dependence of the folding kinetics. Reactions were carried out in 0 to 10 mM MgCl2 at 30°C as in Fig. 3. (A) Amplitude of the folding transitions with increasing MgCl2 concentration. ●, native RNA (AN); ○, intermediate (AI). Curves represent the fit to a cooperative binding equation as in Fig. 1B, where ƒN, max = 0.60; ƒN,0 = 0.03; KN = 3.7; nN = 22; and ƒI, max = 0.52; ƒI,0 = 0.04; KI = 3.8; nI = 16. (B) Mg2+ dependence of observed rate constants (kN) for I ⇔ N. The curve represents the best linear fit to ln(kN) vs. Mg2+ concentration, where the slope = −0.83 = −mMg2+/RT.
Rates of unfolding were also measured as a function of Mg2+ concentration by diluting renatured pre-RNA into buffer at 30°C containing 2–4.5 mM MgCl2. Little unfolding was observed at Mg2+ concentrations above 3.5 mM (data not shown). Below 3.5 mM, however, the rate and extent of unfolding increased rapidly with decreasing Mg2+ (ku = 0.45 min−1 at 3.25 mM MgCl2; 0.7 min−1 in 3.5 mM MgCl2; ≥6 min−1 in 2.0 mM MgCl2).
Mg2+-Dependent Stabilities of I and N Determine the Folding Kinetics.
An analysis of the rate constant for the folding reaction, kN, with respect to Mg2+ concentration showed that the rate of folding decreased monotonically with increasing Mg2+ and became nearly constant when the concentration of the cation was increased beyond 8 mM (Fig. 4B). This unexpected result can be rationalized by relating the barrier between I and the most probable transition state with the difference in the free energies of I and N. The simplest model for the variation in ΔGIN is
 |
4 |
where C is the concentration of Mg2+, Csat is the saturation value, and ΔGmax is the value of ΔGIN at saturating Mg2+. For the pre-RNA considered here, ΔGmax ≈ −4.8 kcal/mol. The value of the coefficient mMg2+ = dΔGIN/dC gives an indication of the number of uncoordinated Mg2+ sites and is easily computed from the condition ΔGIN = 0 at Cm. For the pre-RNA, Cm = 4.1 mM, so that mMg2+ ≈ 1 kcal⋅mol−1⋅mM−1.
Alternatively, an estimate of mMg2+ can be made from the dependence of the rate constant k1 on Mg2+ concentration. It follows from the free energy profile describing the unfolding of N to I that the minimum barrier between I and N is ΔG‡ ≥ |ΔGmax| + mMg2+ C, so that
 |
5 |
As a result, k1 should decrease exponentially with increasing concentration of the divalent cation. A semilogarithmic fit to the experimentally determined values of k1 from 3 to 4.5 mM MgCl2 yielded mMg2+ ≈ 0.5 kcal⋅mol−1⋅mM−1 at 30°C (Fig. 4B), which is consistent (within a factor of 2) with the estimate from the thermodynamic measurements. Thus, the general outlines of the Mg2+-dependent folding kinetics follow from the thermodynamics of this three-state model.
It is interesting to compare the distinct roles played by Mg2+ in the conversion of I to N. We and others have demonstrated that urea accelerates the folding rates of large RNA (22, 24, 36). This result may be understood by supposing that the denaturant does not interact significantly with N but destabilizes the I states (22, 37), leading to the observed increase in rate. In contrast, Mg2+ affects both the I and the N states, and the decrease in the folding rate is caused by the effects of the divalent cation on the relative stabilities of N and I. Thus, urea and Mg2+ interact very differently with the I states and the native state. These arguments suggest that urea should be most effective under conditions when the concentration of Mg2+ is chosen so that N state is more stable than I. In other words, the rate enhancement by urea is greater when [Mg2+] > Cm than when [Mg2+] < Cm. This prediction is consistent with the experiments on the Tetrahymena ribozyme (38) and RNase P RNA (24), which showed that at a fixed concentration of Mg2+ (>Cm), the maximum rate of folding was found at the highest urea concentration.
CONCLUSION
The Mg2+-induced equilibrium transitions to the functional state of the Tetrahymena pre-RNA reveal the presence of a stable set of discrete intermediates. We have shown that the transition from I to N is considerably more cooperative than the formation of I from unfolded states, and the degree of cooperativity is found to directly depend on the free energy of the transition. Similar results were obtained by analyzing the data on folding of apomyoglobin after dilution of urea (39), in which it was found that I ⇔ N was considerably more cooperative than U ⇔ I (40).
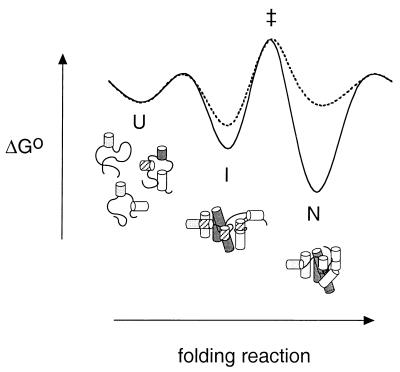
We find that the rate of conversion from I to N decreases monotonically with increasing Mg2+ concentration. By contrast, nonspecific ion interactions appear to increase the folding rate of the RNA, presumably by altering the average conformation of the U states. The first result is explained by a model that describes the changes in the underlying energy landscape in terms of the dependence of the relative stabilities of I and N on the concentration of the divalent cation (Fig. 5). The dependence of the folding rate on Mg2+ can be semiquantitatively predicted from the parameter mMg2+, which describes the response of I and N to Mg2+ concentration. Consistent with this model, we find that the unfolding rate, which corresponds directly to the stability of N, varies slightly more strongly with Mg2+ concentration than the rate of folding (mMg2+ ≈ 1.2). Thus, the relative stabilities of each conformational state not only determine the degree of cooperativity of folding, but also dictate the complex kinetics of the assembly of the native RNA structure.
Figure 5.
Three-state model for folding of the Tetrahymena pre-RNA. An ensemble of unfolded structures (U) undergo a weakly cooperative and presumably rapid transition to a collection of intermediate states (I) that contain native and nonnative secondary structures (hatched cylinders) (25). I may also be stabilized by tertiary interactions in the P4-P6 domain (dark grey) (36). The transition from I to the native structure (N) is highly cooperative with respect to Mg2+. At Mg2+ concentrations above the midpoint (C > Cm), N is more stable than I (solid line). When C < Cm, N is less stable than I (dashed line). As I is also stabilized somewhat by interactions with Mg2+, the folding rate decreases monotonically with increasing Mg2+. Because this thermodynamic model describes the folding kinetics semi-quantitatively, we expect that the position of the most probable transition state (‡) will vary little with Mg2+ concentration.
Acknowledgments
This work was supported by grants from the National Science Foundation (CHE-96-29845 to D.T.), the National Institutes of Health (GM46686 to S. W.), and a Camille Dreyfus Teacher-Scholar award (to S.W.).
References
- 1.Brion P, Westhof E. Annu Rev Biophys Biomol Struct. 1997;26:113–137. doi: 10.1146/annurev.biophys.26.1.113. [DOI] [PubMed] [Google Scholar]
- 2.Cech T R, Herschlag D. In: Nucleic Acids and Molecular Biology. Eckstein F, Lilley D M J, editors. Vol. 10. Berlin: Springer; 1996. pp. 1–17. [Google Scholar]
- 3.Pyle A M. Science. 1993;261:709–714. doi: 10.1126/science.7688142. [DOI] [PubMed] [Google Scholar]
- 4.Draper D E. Nat Struct Biol. 1996;3:397–400. doi: 10.1038/nsb0596-397. [DOI] [PubMed] [Google Scholar]
- 5.Stein A, Crothers D M. Biochemistry. 1976;15:157–160. doi: 10.1021/bi00646a024. [DOI] [PubMed] [Google Scholar]
- 6.Cole P E, Crothers D M. Biochemistry. 1972;11:4368–4374. doi: 10.1021/bi00773a025. [DOI] [PubMed] [Google Scholar]
- 7.Laing L G, Gluick T C, Draper D E. J Mol Biol. 1994;237:577–587. doi: 10.1006/jmbi.1994.1256. [DOI] [PubMed] [Google Scholar]
- 8.Lynch D C, Schimmel P R. Biochemistry. 1974;13:1841–1852. doi: 10.1021/bi00706a012. [DOI] [PubMed] [Google Scholar]
- 9.Privalov P L, Filimonov V V. J Mol Biol. 1978;122:447–464. doi: 10.1016/0022-2836(78)90421-7. [DOI] [PubMed] [Google Scholar]
- 10.Gluick T C, Gerstner R B, Draper D E. J Mol Biol. 1997;270:451–463. doi: 10.1006/jmbi.1997.1119. [DOI] [PubMed] [Google Scholar]
- 11.Bukhman Y V, Draper D E. J Mol Biol. 1997;273:1020–1031. doi: 10.1006/jmbi.1997.1383. [DOI] [PubMed] [Google Scholar]
- 12.Cate J H, Hanna R L, Doudna J A. Nat Struct Biol. 1997;4:553–558. doi: 10.1038/nsb0797-553. [DOI] [PubMed] [Google Scholar]
- 13.Correll C C, Freeborn B, Moore P B, Steitz T A. Cell. 1997;91:705–712. doi: 10.1016/s0092-8674(00)80457-2. [DOI] [PubMed] [Google Scholar]
- 14.Weidner H, Crothers D M. Nucleic Acids Res. 1977;4:3401–3414. doi: 10.1093/nar/4.10.3401. [DOI] [PMC free article] [PubMed] [Google Scholar]
- 15.Banerjee A R, Jaeger J A, Turner D H. Biochemistry. 1993;32:153–163. doi: 10.1021/bi00052a021. [DOI] [PubMed] [Google Scholar]
- 16.Banerjee A R, Turner D H. Biochemistry. 1995;34:6504–6512. doi: 10.1021/bi00019a031. [DOI] [PubMed] [Google Scholar]
- 17.Downs W D, Cech T R. RNA. 1996;2:718–732. [PMC free article] [PubMed] [Google Scholar]
- 18.Celander D W, Cech T R. Science. 1991;251:401–407. doi: 10.1126/science.1989074. [DOI] [PubMed] [Google Scholar]
- 19.Zarrinkar P P, Williamson J R. Science. 1994;265:918–924. doi: 10.1126/science.8052848. [DOI] [PubMed] [Google Scholar]
- 20.Zarrinkar P P, Williamson J R. Nat Struct Biol. 1996;3:432–438. doi: 10.1038/nsb0596-432. [DOI] [PubMed] [Google Scholar]
- 21.Sclavi B, Sullivan M, Chance M R, Brenowitz M, Woodson S A. Science. 1998;279:1940–1943. doi: 10.1126/science.279.5358.1940. [DOI] [PubMed] [Google Scholar]
- 22.Pan J, Thirumalai D, Woodson S A. J Mol Biol. 1997;273:7–13. doi: 10.1006/jmbi.1997.1311. [DOI] [PubMed] [Google Scholar]
- 23.Thirumalai D, Woodson S A. Acc Chem Res. 1996;29:433–439. [Google Scholar]
- 24.Pan T, Sosnick T R. Nat Struct Biol. 1997;4:931–938. doi: 10.1038/nsb1197-931. [DOI] [PubMed] [Google Scholar]
- 25.Pan J, Woodson S A. J Mol Biol. 1998;280:597–609. doi: 10.1006/jmbi.1998.1901. [DOI] [PubMed] [Google Scholar]
- 26.Emerick V L, Woodson S A. Biochemistry. 1993;32:14062–14067. doi: 10.1021/bi00213a040. [DOI] [PubMed] [Google Scholar]
- 27.Walstrum S A, Uhlenbeck O C. Biochemistry. 1990;29:10573–10576. doi: 10.1021/bi00498a022. [DOI] [PubMed] [Google Scholar]
- 28.Pyle A M, McSwiggen J A, Cech T R. Proc Natl Acad Sci USA. 1990;87:8187–8191. doi: 10.1073/pnas.87.21.8187. [DOI] [PMC free article] [PubMed] [Google Scholar]
- 29.Emerick V L, Woodson S A. Proc Natl Acad Sci USA. 1994;91:9675–9679. doi: 10.1073/pnas.91.21.9675. [DOI] [PMC free article] [PubMed] [Google Scholar]
- 30.Szabó Z G. In: Comprehensive Chemical Kinetics. Bamford C H, Tipper C F H, editors. Vol. 2. Amsterdam: Elsevier; 1969. pp. 1–80. [Google Scholar]
- 31.Record M T, Zhang W T, Anderson C F. Adv Protein Chem. 1998;51:281–353. doi: 10.1016/s0065-3233(08)60655-5. [DOI] [PubMed] [Google Scholar]
- 32.Jaeger J A, Zuker M, Turner D H. Biochemistry. 1990;29:10147–10158. doi: 10.1021/bi00496a002. [DOI] [PubMed] [Google Scholar]
- 33.Grosshans C A, Cech T R. Biochemistry. 1989;28:6888–6894. doi: 10.1021/bi00443a017. [DOI] [PubMed] [Google Scholar]
- 34.Wang Y H, Murphy F L, Cech T R, Griffith J D. J Mol Biol. 1994;236:64–71. doi: 10.1006/jmbi.1994.1118. [DOI] [PubMed] [Google Scholar]
- 35.Thirumalai D. J Phys I [French] 1995;5:1457–1467. [Google Scholar]
- 36.Treiber D K, Rook M S, Zarrinkar P P, Williamson J R. Science. 1998;279:1943–1946. doi: 10.1126/science.279.5358.1943. [DOI] [PubMed] [Google Scholar]
- 37.Camacho C J, Thirumalai D. Protein Sci. 1996;5:1826–1832. doi: 10.1002/pro.5560050908. [DOI] [PMC free article] [PubMed] [Google Scholar]
- 38.Rook M S, Treiber D K, Williamson J R. J Mol Biol. 1998;281:609–620. doi: 10.1006/jmbi.1998.1960. [DOI] [PubMed] [Google Scholar]
- 39.Barrick D, Baldwin R L. Biochemistry. 1993;32:3790–3796. doi: 10.1021/bi00065a035. [DOI] [PubMed] [Google Scholar]
- 40.Klimov D K, Thirumalai D. Fold Des. 1998;3:127–139. doi: 10.1016/s1359-0278(98)00018-2. [DOI] [PubMed] [Google Scholar]


