Abstract
Adenylate kinase (AK) is a key enzyme in the high-energy phosphoryl transfer reaction in living cells. Of its isoforms, AK4 has a similar sequence and subcellular localization to that of AK3 in the mitochondrial matrix. However, unlike AK3, AK4 lacks the guanosine triphosphate: adenosine monophosphate phosphotransferase activity. To elucidate the physiological role of AK4, we explored the protein localization of AK4 in various mouse tissues by immunohistochemical analysis. AK4 protein was detected in the kidney, liver, brain, heart, stomach, intestine, and gonads but not in the lung and spleen. Interestingly, cell-type specific expression was evident in the brain, gastrointestinal tract, and gonads. In the cerebellum, AK4 was detected in granular cells but not in Purkinje cell bodies. In the gastrointestinal tract, AK4 was highly expressed in epithelia. In the ovary, AK4 was detected in oocytes and corpora lutea. In the testis, AK4 was detected in spermatocytes but not in spermatogonia. Our findings demonstrate that AK4 localizes uniquely in a cell-type and tissue-specific manner in mouse tissues.
Keywords: adenylate kinase, AK4, mitochondria, protein expression, immunohistochemistry
I. Introduction
Adenylate kinase (AK) is a key enzyme involved in energy metabolism in the cytosol, mitochondria, and nucleus [12]. It catalyzes the reversible transfer of γ-phosphate from either adenosine triphosphate (ATP) or guanosine triphosphate (GTP) to the β-position of the phosphate acceptor of adenosine monophosphate (AMP), resulting in the production of two molecules of adenosine diphosphate (ADP), and plays a role in high-energy phosphoryl transfer from intracellular sites of ATP or GTP synthesis to the sites of their consumption. Thus, AK functions in maintaining the local homeostasis of adenine and guanine nucleotide pools.
In vertebrates, seven isozymes of AK have been reported. AK1, AK2 (ATP:AMP phosphotransferase, EC 2.7.4.3), and AK3 (GTP:AMP phosphotransferase, EC 2.7.4.10) were the first to be described [4, 6, 11, 22]. AK4, AK5, and AK6 have been recently identified [13, 17, 24, 27], and a potential AK isozyme, AK7, has been registered under the accession number NM152327. Each protein has a unique subcellular distribution [12]. AK1 and AK5 are found in the cytosol, while AK6 is present in the nucleus. AK2 is localized in both the cytosol and mitochondrial intermembrane space, and AK3 and AK4 are present in the mitochondrial matrix.
In a previous study, we characterized the intracellular localization and the enzymatic activity of human AK4 [13]. We found that AK4 has no enzymatic activity although it shows 56.6% similarity to AK3 in the amino acid sequences. We also found that AK4 is localized in the mitochondrial matrix and distributed in some specific tissues, whereas AK3 is ubiquitously present in the tissues. However, in vivo localization of AK4 at the cellular level of each tissue remains unclear. Recently, Liu et al. reported that enzymatically inactive AK4 is a stress responsive protein and likely to function through its interaction with ADP/ATP translocases in vitro [7]. These findings prompted us to investigate the physiological roles of AK4 in vivo by thoroughly examining the AK4 protein expression.
In this study, we performed immunohistochemical analysis to investigate the cell-type specific distributions of AK4 protein in normal mouse tissues, and compared the distribution with those of well-known mitochondrial markers, translocase of outer membrane 20 (Tom20), and mitochondrial chaperone HSP70 (GRP-75/mtHSP70). AK4 and these mitochondrial markers were detected in the same cell-type distribution in most tissues, except the cerebellum, forestomach, ovary, and testis. In the cerebellum, the AK4 reactivity was observed in line intermittently similar to localization of Bergman glia. In the forestomach, AK4 was detected in the stratified squamous epithelia. Furthermore, AK4 was detected in oocytes but not in spermatogonia. The present comprehensive histochemical analysis of AK4 protein suggests two possible functional roles of AK4 in vivo linked to stress response and energy metabolism.
II. Materials and Methods
Tissues and antibodies
Eight-week-old ICR mice were sacrificed by cervical dislocation under anesthesia. Each tissue sample was harvested and divided into three pieces. Two pieces of each tissue were kept at −80°C until sodium dodecyl sulfate polyacrylamide gel electrophoresis (SDS-PAGE). One piece of each tissue was fixed in Tellyesniczky’s fixative solution containing 70% ethanol, 5% formaldehyde, and 5% glacial acetic acid for 4 hr at room temperature for immunohistochemical analysis. The fixed samples were embedded in paraffin and cut into 4-µm thick sections. All sections were evaluated histologically, with no pathological findings. Polyclonal anti-human AK4 rabbit serum [13] and pre-immune rabbit serum were used for immunostaining. Polyclonal anti-Tom20 antibody (catalog no. sc-11415) and anti-GRP-75 antibody (catalog no. sc-1058) were purchased from Santa Cruz Biotechnology (Santa Cruz, CA, USA), Monoclonal anti-neurofilament H antibody (catalog no. 2836) and monoclonal anti-GFAP antibody (catalog no. G49220) were purchased from Cell Signaling Technology (Danvers, MA, USA). Monoclonal anti-GAP-43 antibody (catalog no. 33-5000) and monoclonal anti-S100b antibody (catalog no. S 2532) were purchased from Zymed (South San Francisco, CA, USA) and Sigma (St. Louis, MO, USA), respectively. Monoclonal anti-calbindin D28K antibody was kindly provided from Professor Kazunori Toida (Swant #300, Bellinzona, Switzerland and [21]). The mice were maintained and treated in accordance with the Guidelines for Animal Experiments of The University of Tokushima. Experimental protocols were approved by the Ethics Committee for Animal Experiments of the University of Tokushima.
SDS-PAGE and Western blot analysis
Mouse tissues (brain, heart, lung, liver, kidney, spleen, stomach, jejunum, ileum, colon, testis, ovary, and oviduct) were homogenized and the lysates were prepared. Western blot analysis was performed with purified polyclonal anti-human AK4 rabbit IgG (1:10,000) as described previously [18]. The specificity of anti-AK4 antibody was analyzed with bacterial lysates containing the human AK4 expression plasmid as described previously [13]. One milliliter of bacterial culture was collected, and the absorbance was measured at 600 nm with a Spectronic 20D spectrophotometer (Milton Roy; Ivyland, PA, USA), and the bacterial pellets were suspended in 100 µl of 1×SDS gel-loading buffer and heated at 95C for 3 min. The samples were centrifuged at 20,000×g for 1 min and the supernatants were used as bacterial lysates. Bacterial lysates equivalent to 0.15 OD600 units were loaded in each lane. SDS-PAGE and Western blot analysis were performed using an anti-His tag (1:1000) and anti-AK4 (1:100,000) antibodies.
Immunohistochemistry
Hematoxylin and eosin staining was performed according to the standard protocol. Periodic acid-Schiff (PAS) [14] staining was performed using a PAS staining kit (Merck, Darmstadt, Germany) according to the manufacturer’s instructions. Immunohistochemical analysis was performed as described previously [14]. The tissue sections were incubated with primary antibodies for 1 hr at 37°C with the following dilutions: polyclonal rabbit anti-human AK4 (1:100), anti-human Tom20 (1:500), and polyclonal goat anti-human GRP-75 (1:100). After washing twice with phosphate buffered saline (PBS) (−), the sections were incubated with the horseradish peroxidase (HRP)-conjugated secondary antibody (Histofine; Nichirei, Tokyo, Japan) for 30 min at room temperature. Diaminobenzidine tetrahydrochloride solution (Nichirei) was used as the substrate to detect the immune complex. The sections were counterstained with hematoxylin, washed in distilled water, passed through a series of rapid dips in ethanol and xylene, and then mounted using Entellan New (Merck). The samples were observed under a BX51-34FL-1-K-O light microscope (Olympus, Tokyo, Japan) and representative images were captured using a DP-70 set digital imaging system (Olympus). All experiments were repeated to confirm the consistency of staining in each sample.
Immunofluorescence
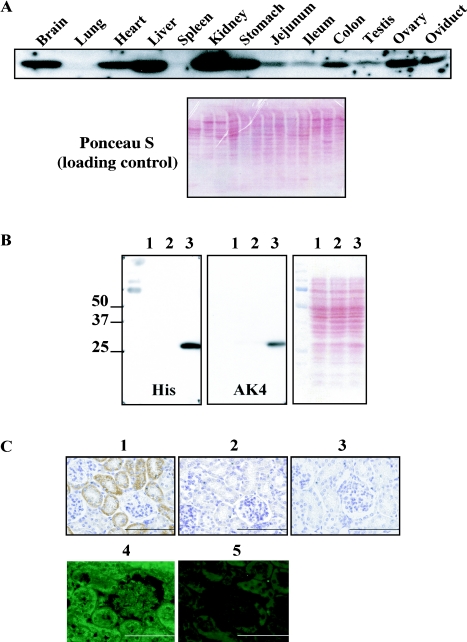
The primary antibodies were incubated overnight at 4°C with the following dilutions: polyclonal rabbit anti-human AK4 (1:500), monoclonal mouse anti-rat neurofilament H (1:500), monoclonal mouse anti-GAP-43 (1:500), monoclonal mouse anti-calbindin (1:1000), monoclonal mouse anti-GFAP (1:1000), and monoclonal mouse anti-S100b (1:1000). After washing twice with PBS (−), the sections were incubated with goat anti-rabbit IgG or anti-mouse IgG antibodies conjugated with Alexa Fluor-488 or 594, respectively, (Invitrogen, Carlsbad, CA, USA) for 30 min at room temperature. The sections were washed with PBS (−) twice, and then mounted using Vectashield with DAPI (Vector, Burlingame, CA, USA). The samples were observed under a BX51-34FL-1-K-O light microscope (Olympus, Tokyo, Japan) and representative images were captured using a DP-70 set digital imaging system (Olympus). All experiments were repeated to confirm the consistency of staining in each sample. To analyze the specificity of anti-AK4 antibody in Figure 1C, anti-AK4 antibody was incubated with the same bacterial lysates containing the human AK4 at 4°C overnight as shown at the section of SDS-PAGE and Western blot analysis in the Materials and Methods and use as the absorbed antibody.
Fig. 1.
Tissue distribution of mouse AK4. (A) (Upper panel) Western blot analysis was performed using purified anti-AK4 antibody. AK4 was detected at 29 K. (Lower panel) Ponceau S staining of the blotting membrane is shown as a loading control. (B) Specificity of anti-AK4 antibody was analyzed by Western blotting. Right panel shows the Ponceau S staining pattern of the lysates. Left and middle panels show that recombinant AK4 was specifically detected by both anti-His and anti-AK4 antibodies, respectively. Lane 1, non-transformed bacterial competent cells, JM109; lane 2, JM109 cells transformed with pSE380; lane 3, JM109 cells transformed with pSE380 containing His-tagged hAK4 cDNA. (C) Specificity of anti-AK4 antibody was examined by immunohistochemical analysis of the kidney. The specimens were stained with the following antibodies. 1, anti-AK4 antibody; 2, pre-immune serum; 3, none; 4, anti-AK4 antibody; and 5, absorbed antibody was applied as the primary antibody.
Criteria for classification of AK4 expression
In Table 1, the AK4 expression patterns of the tissues are classified into three groups according to the following criteria. In Group I, AK4 was detected in the same cell type as Tom20, and the same pattern of reactivity was observed. This group included the heart, liver, jejunum, ileum, corpora lutea, and oviduct. In Group II, AK4 was detected in the same cell type as Tom20, but the pattern and intensity of reactivity differed between AK4 and Tom20. For example, AK4 was detected strongly in the proximal tubules but weakly in distal tubules in the cortex of kidney. On the other hand, Tom20 was evenly detected in the proximal and distal tubules. This group included the brain (cerebrum), kidney, and glandular stomach. In Group III, AK4 and Tom20 were detected in a reciprocal fashion. For example, AK4 but not Tom20 was detected in the oocytes. This group included the brain (cerebellum), forestomach, spermatogonia, and oocytes.
Table 1.
Summary of AK4 protein expression
| Tissue | Specific Area | AK4 | Tom20 | Group |
|---|---|---|---|---|
| Brain | Cerebrum | Pyramidal cells and others | Neural cells | II |
| Cerebellum | Glial cells | Neural cells | III | |
| Heart | Cardiac myocytes | Cardiac myocytes | I | |
| Liver | Liver cells | Liver cells | I | |
| Kidney | Cortex | Proximal tubule>Distal tubule | Proximal tubule=Distal tubule | II |
| Medulla | Outer zone=Inner zone | Outer zone>Inner zone | ||
| Stomach | Forestomach | Stratified squamous epithelia | The basal layer of stratified squamous epithelia | III |
| Glandular stomach | Gastric pit (isthmus) Surface-lining mucus cells (not in parietal cells) | Gastric pit (isthmus) Fundic gland (Chief cells, Parietal cells, Mucous neck cells) | II | |
| Jejunum | Intestinal villi | Epithelial cells | Epithelial cells | I |
| Ileum | Intestinal villi | Epithelial cells | Epithelial cells | I |
| Colon | Mucosal layer | Epithelial cells | Epithelial cells | I |
| Testis | Spermatocytes | Spermatogonia, Spermatocytes | III | |
| Ovary | Oocytes, Follicular epithelial cells, Corpus luteum cells | Follicular epithelial cells, Corpus luteum cells | III | |
| Oviduct | Isthmus | Epithelia | Epithelia | I |
| Ampulla | Ciliated cells | Ciliated cells | I | |
III. Results
Tissue distribution of AK4 in mouse
Although AK4 belongs to the AK family, it does not possess any enzymatic activity and its precise biological functions still remain unclear. We previously reported that the expression patterns of AK4 are restricted to specific tissues at both the mRNA and protein levels by Northern and Western blot analyses, respectively [13, 20]. To further understand the role of AK4 in vivo, we investigated the cell-type specificity of AK4 expression by immunohistochemistry.
First, we analyzed mouse tissues comprehensively by Western blot analysis. As shown in Figure 1A, AK4 signal was detected with decreasing intensity in the following order: kidney > liver > stomach > brain > heart > ovary > oviduct > colon > jejunum > ileum > testis. On the other hand, AK4 was not detected in the lung and spleen. The specificity of AK4 antibody is shown in Figure 1B. Based on these results, we next performed immunohistochemical analyses using the same antibody for all the tissues that we examined in Figure 1A. The sensitivity and specificity of detecting AK4 in the tissues are shown in Figure 1C. The patterns of detection in individual tissues are described in the following text and summarized in Table 1.
Cellular distribution of AK4 in the brain
To detect cellular distribution of AK4, we made serial sections of each tissue and performed immunohistochemical analysis.
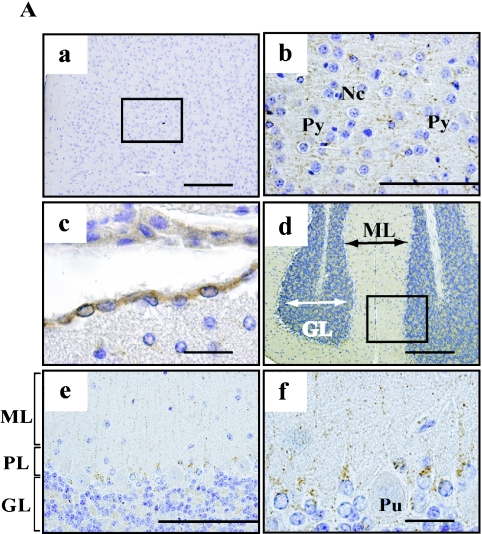
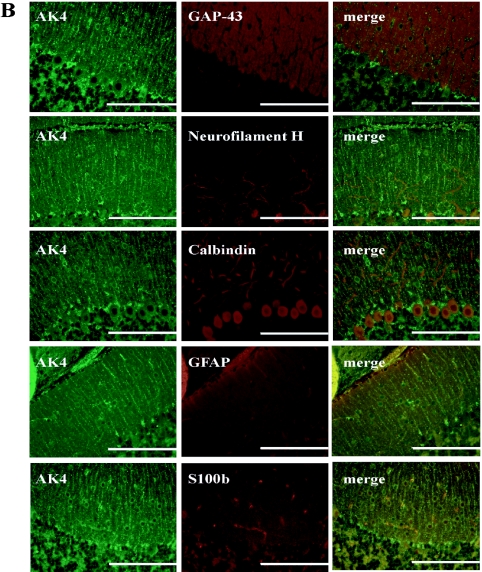
We detected AK4 protein throughout the cerebrum (Fig. 2A-a). AK4 positive cells were diffuse in among six layers of cerebral cortex. There was no observable difference in the distribution of AK4 positive cells between the somatosensory and motor areas (data not shown). As shown in Figure 2A-b, dotted patterns of AK4 reactivity were observed in cytoplasm of pyramidal and non-pyramidal cells of the cerebrum at higher magnification. Interestingly, the ependymal cells of the choroid plexus were strongly reacted with AK4 antibody (Fig. 2A-c). In the cerebellum, AK4 was clearly detected in the granular cells and the cells juxtaposed next to the Purkinje cells, but not in the Purkinje cell bodies themselves (Fig. 2A-d,e). In addition, AK4 antibody reacted as a dotted line in the molecular layer (Fig. 2A-f), but Tom 20 antibody reacted over the molecular layer (data not shown). To assess whether this pattern had any relationship with neurofilaments, we further performed double staining of AK4 and neural or glial markers (Fig. 2B). We chose three neuronal markers: GAP-43, neurofilament H, and calbindin; and two glial markers: GFAP and S100b. GAP-43 was detected over the molecular layer. Neurofilament H and calbindin were detected specifically in Purkinje cells and dendrites. Both neuronal marker proteins were clearly detected in the different type of cells from AK4-positive cells (Fig. 2B). On the other hand, GFAP- or S100b-positive cells were detected in the AK4-positive cells.
Fig. 2.
Cellular localization of AK4 in the brain. (A) Immunohistochemical analyses were performed using anti-AK4. a, b; Cerebral cortex, c; Choroid plexus, d, e, f; Cerebellum. Bar=200 µm (a, d), 100 µm (b, e), and 20 µm (c, f). Py, pyramidal cell; Nc, neuroglial cell; GL, granular layer; ML, molecular layer; PL, Purkinje layer; Pu, Purkinje cell. Open square indicates the area of higher magnification. (B) Double immunodetection with anti-AK4 and neural or glial marker antibodies. Bar=100 µm.
Cellular distribution of AK4 in the heart and liver
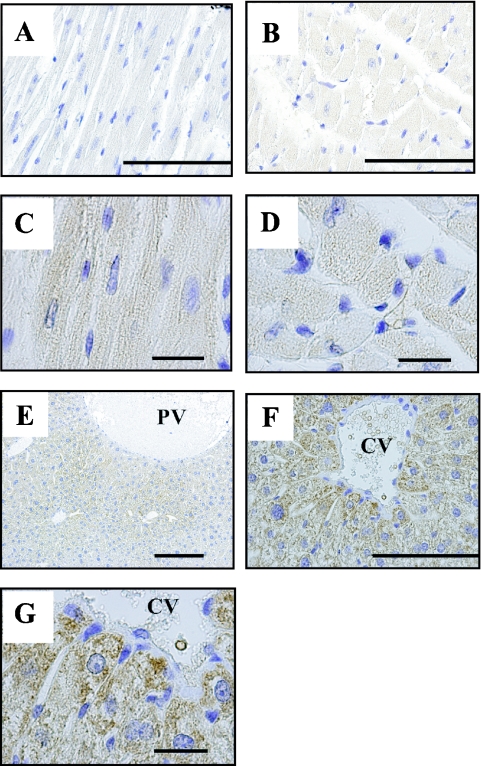
AK4 was detected in all cardiac myocytes and a dotted pattern of distribution was observed in cytoplasm on vertical and cross sections (Fig. 3A–D). The expression pattern of Tom20 was the same as that of AK4 (data not shown).
Fig. 3.
Cellular localization of AK4 in the heart and liver. Immunohistochemical analyses were performed using anti-AK4 antibody. (A, C) Longitudinal section of the cardiac muscles. (B, D) Cross-section of the cardiac muscles. (E) Low magnification of the liver. (F, G) High magnification of the liver. Bar=100 µm (A, B, F), 20 µm (C, D, G), 200 µm (C). PV, interlobular portal vein; CV, central vein. Open square indicates area of higher magnification.
AK4 was also observed diffusely in all hepatocytes, especially surrounding the central and interlobular portal veins of the hepatic lobules (Fig. 3E–G). Tom20 was also detected in all hepatocytes as the same pattern as AK4 (data not shown).
Cellular distribution of AK4 in the kidney
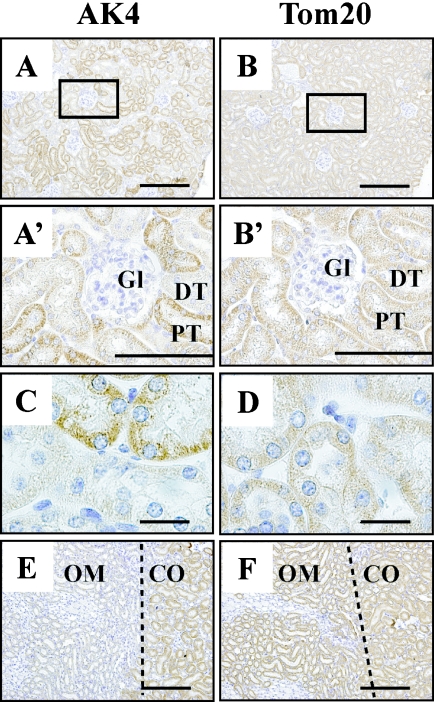
Western blot analysis demonstrated that the kidney contained the largest amounts of AK4 (Fig. 1). In the renal cortex, AK4 and Tom20 were detected mainly in the proximal and distal tubules, but not in the glomeruli (Fig. 4A, A’ and B, B’). Interestingly, the proximal tubules were reacted with AK4 antibody stronger than distal tubules, but both types of tubules were evenly reacted with Tom20 antibody (Fig. 4C and D). AK4 was detected in cytoplasm, at the basal side of tubular cells (Fig. 2C). A clear boundary of AK4 expression was observed between the cortex and medulla. AK4 reactivity was strong in the renal cortex, but markedly weaker in the outer and inner zones of the renal medulla (Fig. 4E). In contrast, Tom20 was detected uniformly from the cortex to the outer zone of the renal medulla (Fig. 4F), but its intensity was very weak in the inner zone (data not shown).
Fig. 4.
Cellular localization of AK4 in the kidney. (A, A’, B, B’, C, D) Renal cortex. (E, F) Outer layer of renal medulla. Immunohistochemical analyses were performed using anti-AK4 (A, A’, C, E) and anti-Tom20 antibodies (B, B’, D, F). Bar=200 µm (A, B, E, F), 100 µm (A’, B’), and 20 µm (C, D). Gl, glomerulus; DT, distal tubule; PT, proximal tubule; OM, outer zone of medulla; CO, cortex. Open square indicates area of higher magnification. Dotted line in C, D shows the boundary between the outer zone of the medulla and the cortex.
Cellular distribution of AK4 in the stomach
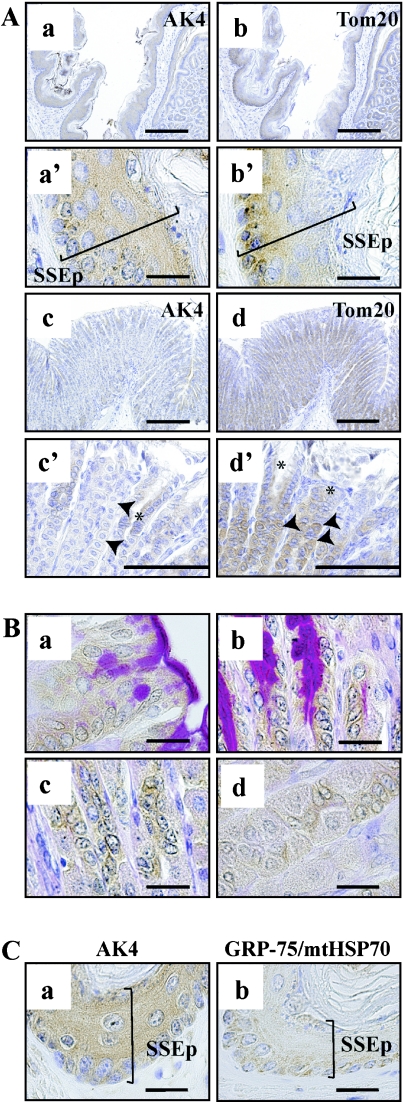
When we analyzed tissue distribution by Western blot analysis, whole stomach was used as a sample (Fig. 1A). Since the mouse stomach comprises a forestomach (Fig. 5A-a, b) and a glandular stomach (Fig. 5A-c, d), we examined AK4 expression separately. AK4 was strongly and uniformly expressed from the basal cell layer to the granular cell layer in the stratified squamous epithelia of forestomach (Fig. 5A-a, a’). In contrast, the intensity of Tom20 gradually decreased from the basal to the surface cell layer which contained keratohyalin granules (Fig. 5A-b, b’). In the glandular stomach, AK4 was detected in the isthmus of gastric pits (Fig. 5A-c, c’). AK4 was also detected in some dividing cells but not in parietal cells (Fig. 5A-c’, 5B-c, d). PAS staining showed the surface-lining mucus producing cells reacted with AK4 antibody (Fig. 5B-a, b). On the other hand, Tom20 was detected in the epithelial cells of gastric pits and in the chief, parietal, and mucous neck cells of the fundic glands (Fig. 5A-d, d’). Since the reactivity of AK4 and Tom 20 was different, we further examined with another mitochondrial marker, GRP-75/mtHSP70. GRP-75/mtHSP-70 showed the similar reactivity to that of Tom20 in the stratified squamous epithelia of forestomach (Fig. 5C-b).
Fig. 5.
Cellular localization of AK4 in the stomach. (A-a, b, a’, b’, B-a, b) Forestomach. (A-c, d, c’, d’) Glandular stomach. Immunohistochemical analyses were performed using anti-AK4 (A-a, a’, c, c’, B-a) and anti-Tom20 antibodies (A-b, b’, d, d’). (B) Double staining was performed using PAS and AK4 antibody to distinguish mucosal cells. (C) Immunohistochemical analyses were performed using anti-GRP-75/mtHSP70. Bar=200 µm (A-a, b, c, d), 100 µm (A-c’, d’), 20 µm (A-a’, b’, B-a, b, c, d, C-a, b). SSEp, stratified squamous epithelium. Asterisks indicate surface epithelial cells; arrowheads indicate parietal cells.
Cellular distribution of AK4 in intestine
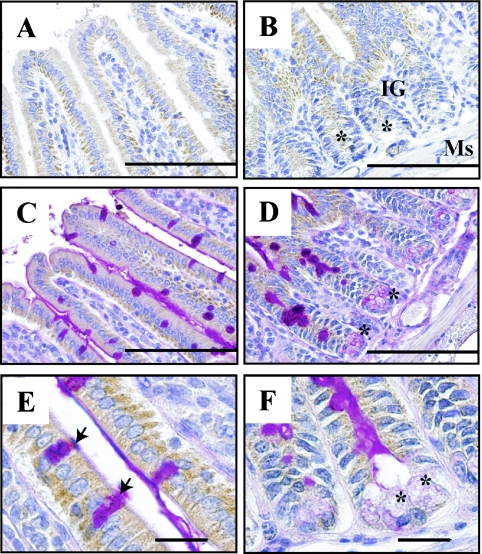
Similar expression patterns of AK4 and Tom20 were evident in the ileum (Fig. 6), jejunum, and colon (data not shown). AK4 was localized in the absorptive epithelial cells in the intestinal villi of ileum (Fig. 6A and B). AK4 was also detected at the basal side in PAS-positive goblet cells or Paneth cells (insets in Fig. 6C–F).
Fig. 6.
Cellular localization of AK4 in the small intestine (ileum). Immunohistochemical analyses were performed using anti-AK4 (A, B) and double -stained with PAS and AK4 antibody (C–F). Bar=100 µm (A–D), and 20 µm (E, F). IG, intestinal gland; Ms, muscularis mucosae. Asterisks indicate Paneth cells; arrows indicate goblet cells.
Cellular distribution of AK4 in the testis
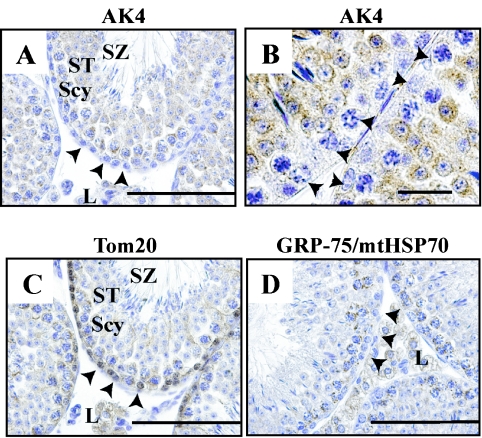
In the testis, AK4 was detected in the cytoplasm of Leydig cells, spermatocytes and spermatids, but not in spermatogonia (Fig. 7A, B). Spermatozoa reacted weakly with AK4 antibody. In contrast, Tom20 was detected in spermatogonia and weakly detected in spermatocytes and spermatids (Fig. 7C). In addition, another mitochondrial marker, GRP-75/mtHSP-70, was detected in spermatogonia (Fig. 7D).
Fig. 7.
Cellular localization of AK4 in the testis. Immunohistochemical analyses were performed using anti-AK4 (A, B), anti-Tom20 (C), and anti-GRP-75/mtHSP70 antibodies (D). Bar=100 µm (A, C, D), and 20 µm (B). Arrowheads indicate spermatogonia. Scy, spermatocytes; ST, spermatids; SZ, spermatozoa; L, Leydig cells.
Cellular distribution of AK4 in the ovary and oviduct
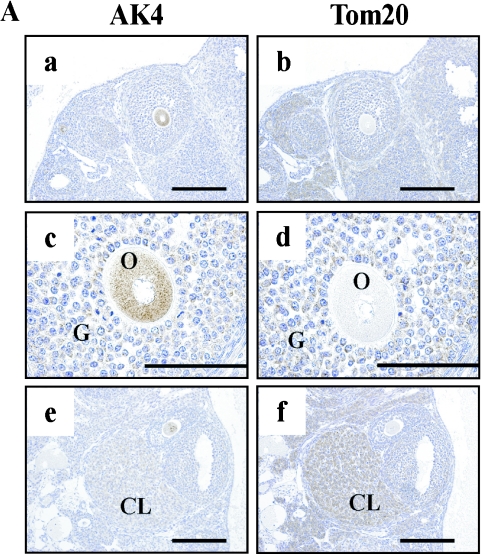
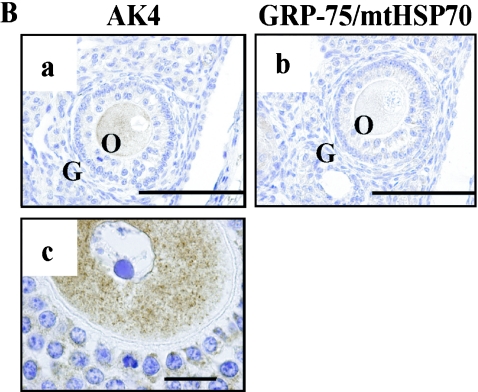
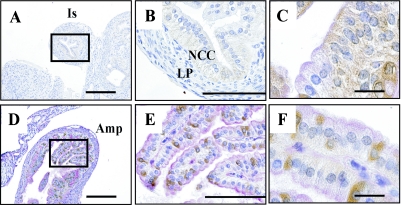
AK4 was detected in oocytes (Fig. 8A-a, c, and 8B-c), granulosa cells in the stratum granulosum (Fig. 8A-a, c), and corpus luteum cells (Fig. 8A-e). In contrast, Tom20 was detected in corpus luteum cells (Fig. 8A-f), but not in oocytes (Fig. 8A-b, d). However, the other mitochondrial marker, GRP-75/mtHSP-70, was detected weakly in oocytes (Fig. 8B-b). In the isthmus of oviduct, AK4 and Tom20 were observed in the epithelial cells (Fig. 9A–C, and data not shown). Interestingly, we found a strong intensity of AK4 in the ciliated cells that were not reacted with PAS staining in the ampulla of oviduct (Fig. 9D–F).
Fig. 8.
Cellular localization of AK4 in the ovary. Immunohistochemical analyses were performed using anti-AK4 (A-a, c, e, B-a, c), anti-Tom20 (A-b, d, f), and anti-GRP-75/mtHSP70 (B-b). Overviews at low magnification (A-a, b, e, f) and high magnification (A-c, d, B-a, b, c). (A-a–d, B-a, b, c) Oocytes and granulose cells. (A-e, f) Corpus luteum cells. Bar=200 µm (A-a, b, e, f), 100 µm (A-c, d, B-a, b), and 20 µm (B-c). O, oocytes; G, granulose cells; CL, corpora lutea.
Fig. 9.
Cellular localization of AK4 in the oviduct. Immunohistochemical analyses were performed using anti-AK4 antibody in the isthmus, and double-stained with AK4 and PAS staining in the ampulla. (A–C) Isthmus. (D–F) Ampulla of oviduct. Bar=200 µm (A, D), 100 µm (B, E), and 20 µm (C, F). Is, isthmus; NCC, non-ciliated cells; LP, lamina propria mucosae; Amp, ampulla. Open square indicates area of higher magnification.
Cellular distribution of AK4 in the lung and spleen
We could not detect AK4 protein in the lung and spleen (data not shown), which was consistent with the Western blot data (Fig. 1A).
Cellular distribution of GRP-75/mtHSP-70 in other tissues
We analyzed the tissue distribution of GRP-75/mtHSP-70 using the same sets of tissue sections with AK4 and Tom20. GRP-75/mtHSP-70 was detected in the same cell type distribution (data not shown) as Tom20 in other tissues except oocytes and spermatogonia.
IV. Discussion
The biological role of AK4 in the mitochondrial matrix remains unclear. Since AK activity has not been detected in AK4 [13], it is difficult to design functional studies. In the present study, we established the systemic analysis of AK4 localization in mouse tissues to analyze the possible functions in vivo. Since biochemical analysis has shown that AK4 is located in the mitochondrial matrix [13], we chose a well-known mitochondrial marker, Tom20, as a control [15, 16]. The cellular distributions of AK4 and Tom20 can be classified into three groups, as shown in Table 1.
Tissue group I comprises tissues that are continuously exposed to various chemical and mechanical stresses including cardiac myocytes, hepatocytes, epithelial cells of the intestine, and the ciliated epithelial cells of the oviduct. These cells need large amounts of energy to participate in the extensive exchange of ions, nutrients, hormones, and cytokines [1, 3, 8, 10, 23].
Tissue group II consists of the cerebrum, kidney, and glandular stomach. In this group, the ion-transport systems are active. For example, a large amount of water is absorbed and ions are exchanged by Na+/K+-ATPase in the kidney. In addition, toxic compounds and urate are pumped out by organic anion transporters and a multidrug resistance-associated protein family belonging to the ATP-binding cassette superfamily [19].
Tissue group III consists of the cerebellum, forestomach, and gonads. These tissues are functionally very different from each other. The expression of AK4 and Tom20 might be regulated by the cell-type specific mechanisms in the cerebellum, forestomach, and gonads.
We found two common features among the tissue groups. First, AK4 can be detected in differentiated cells. This finding supports the previous reports that AK4 mRNA expression parallels the stages of morphological differentiation [13, 27]. Association of AK4 expression with tissue functions suggested that AK4 might have tissue-specific regulatory roles in energy metabolism. The second feature is that AK4 is expressed in the surface epithelium of the gastrointestinal tract, glial cells and choroid plexus in brain, and oocyte, suggesting a possible role of AK4 under environmental stress. Several microarray studies demonstrated that AK4 mRNA is up-regulated by oxidative stress [2, 5, 25, 26]. Heat-shock protein 60, another mitochondrial matrix protein, is also induced by oxidative stress in both the liver [26] and the gastrointestinal tract [10]. The glial cells and choroid plexus supply the nutrient for neural cells. Oocytes have to protect oxidative stress-induced apoptosis caused by aging [9]. We also observed that AK4 protein expression is up-regulated in CCl4-treated mouse liver, indicating that AK4 gene is responsive to oxidative stress. Recently, Liu et al. reported that AK4 has cell-protective function from oxidative stress in vitro [7]. These findings correlate well with our second feature of AK4 localization. Further investigations are required to get the scientific evidence to better explain these two features.
Interestingly, AK4 reactivity was much different from those of Tom20 and GRP-75/mtHSP70 in Group III, demonstrating the independent regulation of AK4 and Tom20 expression. There are several possibilities for this. For example, mammalian oocytes contain abundant mitochondria, and they may be metabolically inactive [23]. In germ cells, the mitochondrial translocase Tom20 may not exist and other translocases may function. The alternative reason that we could not detect Tom20 is that the unknown oocyte-specific proteins may interact with Tom20 through antibody recognition sites, resulting in its being masked by them. For example, when we performed S100b staining, it showed only weak detection signals under good conditions for AK4 detection in Figure 2B. However, when we used frozen sections without antigen retrieval using microwave, S100b was detected clearly (data not shown). These possibilities remain to be confirmed.
Obviously, it is difficult to elucidate the physiological role of AK4 because of the absence of enzymatic activity. It is better to use spatio-temporally controlled AK4-knockout mouse models to elucidate the functions of AK4. Our histochemical data will provide useful information to design them and to perform further studies.
V. Acknowledgments
This work was partly supported by a Grant-in-Aid for scientific research (No. 16591858) from the Ministry of Education, Culture, Sports, Science and Technology, Japan. The authors thank Professors T. Sano (Department of Human Pathology, Institute of Health Biosciences, The University of Tokushima Graduate School) and K. Toida (Department of Anatomy, Kawasaki Medical School) for helpful suggestions regarding the histological analysis.
VI. References
- 1.Asaka Y., Watanabe J., Amatsu T., Kanamura S. Significance of high glucose-6-phosphatase activity in rat oviduct epithelium. J. Histochem. Cytochem. 1993;41:1841–1848. doi: 10.1177/41.12.8245432. [DOI] [PubMed] [Google Scholar]
- 2.Chen L., Fink T., Ebbesen P., Zachar V. Temporal transcriptome of mouse ATDC5 chondroprogenitors differentiating under hypoxic conditions. Exp. Cell Res. 2006;312:1727–1744. doi: 10.1016/j.yexcr.2006.02.013. [DOI] [PubMed] [Google Scholar]
- 3.Gandolfi F. Functions of proteins secreted by oviduct epithelial cells. Microsc. Res. Tech. 1995;32:1–12. doi: 10.1002/jemt.1070320102. [DOI] [PubMed] [Google Scholar]
- 4.Heldt H. W., Schwalbach K. The participation of GTP-AMP-P transferase in substrate level phosphate transfer of rat liver mitochondria. Eur. J. Biochem. 1967;1:199–206. doi: 10.1007/978-3-662-25813-2_31. [DOI] [PubMed] [Google Scholar]
- 5.Hu C. J., Iyer S., Sataur A., Covello K. L., Chodosh L. A., Simon M. C. Differential regulation of the transcriptional activities of hypoxia-inducible factor 1 alpha (HIF-1alpha) and HIF-2alpha in stem cells. Mol. Cell. Biol. 2006;26:3514–3526. doi: 10.1128/MCB.26.9.3514-3526.2006. [DOI] [PMC free article] [PubMed] [Google Scholar]
- 6.Khoo J. C., Russell P. J. Isoenzymes of adenylate kinase in human tissue. Biochim. Biophys. Acta. 1972;268:98–101. doi: 10.1016/0005-2744(72)90202-1. [DOI] [PubMed] [Google Scholar]
- 7.Liu R., Ström A. L., Zhai J., Gal J., Bao S., Gong W., Zhu H. Enzymatically inactive adenylate kinase 4 interacts with mitochondrial ADP/ATP translocase. Int. J. Biochem. Cell Biol. . 2009;41:1371–1380. doi: 10.1016/j.biocel.2008.12.002. [DOI] [PMC free article] [PubMed] [Google Scholar]
- 8.Macpherson A. J., Mayall T. P., Chester K. A., Abbasi A., Forgacs I., Malcolm A. D., Peters T. J. Mitochondrial gene expression in the human gastrointestinal tract. J. Cell Sci. 1992;102:307–314. doi: 10.1242/jcs.102.2.307. [DOI] [PubMed] [Google Scholar]
- 9.Matsumine M., Shibata N., Ishitani K., Kobayashi M., Ohta H. Pentosidine accumulation in human oocytes and their correlation to age-related apoptosis. Acta Histochem. Cytochem. 2008;41:97–104. doi: 10.1267/ahc.08014. [DOI] [PMC free article] [PubMed] [Google Scholar]
- 10.Mobius J., Groos S., Meinhardt A., Seitz J. Differential distribution of the mitochondrial heat-shock protein 60 in rat gastrointestinal tract. Cell Tissue Res. 1997;287:343–350. doi: 10.1007/s004410050759. [DOI] [PubMed] [Google Scholar]
- 11.Nakazawa A., Yamada M., Tanaka H., Shahjahan M., Tanabe T. Gene structures of three vertebrate adenylate kinase isozymes. Prog. Clin. Biol. Res. 1990;344:495–514. [PubMed] [Google Scholar]
- 12.Noma T. Dynamics of nucleotide metabolism as a supporter of life phenomena. J. Med. Invest. 2005;52:127–136. doi: 10.2152/jmi.52.127. [DOI] [PubMed] [Google Scholar]
- 13.Noma T., Fujisawa K., Yamashiro Y., Shinohara M., Nakazawa A., Gondo T., Ishihara T., Yoshinobu K. Structure and expression of human mitochondrial adenylate kinase targeted to the mitochondrial matrix. Biochem. J. 2001;358:225–232. doi: 10.1042/0264-6021:3580225. [DOI] [PMC free article] [PubMed] [Google Scholar]
- 14.Paschen S. A., Neupert W., Rapaport D. Biogenesis of beta-barrel membrane proteins of mitochondria. Trends Biochem. Sci. 2005;30:575–582. doi: 10.1016/j.tibs.2005.08.009. [DOI] [PubMed] [Google Scholar]
- 15.Rapaport D. Biogenesis of the mitochondrial TOM complex. Trends Biochem. Sci. 2002;27:191–197. doi: 10.1016/s0968-0004(02)02065-0. [DOI] [PubMed] [Google Scholar]
- 16.Rapaport D. How does the TOM complex mediate insertion of precursor proteins into the mitochondrial outer membrane? J. Cell Biol. 2005;171:419–423. doi: 10.1083/jcb.200507147. [DOI] [PMC free article] [PubMed] [Google Scholar]
- 17.Ren H., Wang L., Bennett M., Liang Y., Zheng X., Lu F., Li L., Nan J., Luo M., Eriksson S., Zhang C., Su X. D. The crystal structure of human adenylate kinase 6: An adenylate kinase localized to the cell nucleus. Proc. Natl. Acad. Sci. U S A. 2005;102:303–308. doi: 10.1073/pnas.0407459102. [DOI] [PMC free article] [PubMed] [Google Scholar]
- 18.Ruspita I., Miyoshi K., Muto T., Abe K., Horiguchi T., Noma T. Sp6 downregulation of follistatin gene expression in ameloblasts. J. Med. Invest. 2008;55:87–98. doi: 10.2152/jmi.55.87. [DOI] [PubMed] [Google Scholar]
- 19.Sekine T., Miyazaki H., Endou H. Molecular physiology of renal organic anion transporters. Am. J. Physiol. Renal Physiol. 2006;290:F251–261. doi: 10.1152/ajprenal.00439.2004. [DOI] [PubMed] [Google Scholar]
- 20.Tanabe T., Yamada M., Noma T., Kajii T., Nakazawa A. Tissue-specific and developmentally regulated expression of the genes encoding adenylate kinase isozymes. J. Biochem. (Tokyo) 1993;113:200–207. doi: 10.1093/oxfordjournals.jbchem.a124026. [DOI] [PubMed] [Google Scholar]
- 21.Toida K., Kosaka K., Heizmann C. W., Kosaka T. Chemically defined neuron groups and their subpopulations in the glomerular layer of the rat main olfactory bulb: III. Structural features of calbindin D28K-immunoreactive neurons. J. Comp. Neurol. 1998;392:179–198. doi: 10.1002/(sici)1096-9861(19980309)392:2<179::aid-cne3>3.0.co;2-#. [DOI] [PubMed] [Google Scholar]
- 22.Tomasselli A. G., Noda L. H. Mitochondrial ATP:AMP phosphotransferase from beef heart: purification and properties. Eur. J. Biochem. 1980;103:481–491. doi: 10.1111/j.1432-1033.1980.tb05972.x. [DOI] [PubMed] [Google Scholar]
- 23.Van Blerkom J. Mitochondria in human oogenesis and preimplantation embryogenesis: engines of metabolism, ionic regulation and developmental competence. Reproduction. 2004;128:269–280. doi: 10.1530/rep.1.00240. [DOI] [PubMed] [Google Scholar]
- 24.Van Rompay A. R., Johansson M., Karlsson A. Identification of a novel human adenylate kinase. cDNA cloning, expression analysis, chromosome localization and characterization of the recombinant protein. Eur. J. Biochem. 1999;261:509–517. doi: 10.1046/j.1432-1327.1999.00294.x. [DOI] [PubMed] [Google Scholar]
- 25.Wang X. J., Chamberlain M., Vassieva O., Henderson C. J., Wolf C. R. Relationship between hepatic phenotype and changes in gene expression in cytochrome P450 reductase (POR) null mice. Biochem. J. 2005;388:857–867. doi: 10.1042/BJ20042087. [DOI] [PMC free article] [PubMed] [Google Scholar]
- 26.Yamamoto T., Kikkawa R., Yamada H., Horii I. Investigation of proteomic biomarkers in in vivo hepatotoxicity study of rat liver: toxicity differentiation in hepatotoxicants. J. Toxicol. Sci. 2006;31:49–60. doi: 10.2131/jts.31.49. [DOI] [PubMed] [Google Scholar]
- 27.Yoneda T., Sato M., Maeda M., Takagi H. Identification of a novel adenylate kinase system in the brain: cloning of the fourth adenylate kinase. Brain Res. Mol. Brain Res. 1998;62:187–195. doi: 10.1016/s0169-328x(98)00249-6. [DOI] [PubMed] [Google Scholar]


