Abstract
The compliance of the vessel wall affects hemodynamic parameters which may alter the permeability of the vessel wall. Based on experimental measurements, the present study established a finite element (FE) model in the proximal elastic vessel segments of epicardial right coronary arterial (RCA) tree obtained from computed tomography. The motion of elastic vessel wall was measured by an impedance catheter and the inlet boundary condition was measured by an ultrasound flow probe. The Galerkin FE method was used to solve the Navier-Stokes and Continuity equations, where the convective term in the Navier-Stokes equation was changed in the arbitrary Lagrangian-Eulerian (ALE) framework to incorporate the motion due to vessel compliance. Various hemodynamic parameters (e.g., wall shear stress-WSS, WSS spatial gradient-WSSG, oscillatory shear index-OSI) were analyzed in the model. The motion due to vessel compliance affects the time-averaged WSSG more strongly than WSS at bifurcations. The decrease of WSSG at flow divider in elastic bifurcations, as compared to rigid bifurcations, implies that the vessel compliance decreases the permeability of vessel wall and may be atheroprotective. The model can be used to predict coronary flow pattern in subject-specific anatomy as determined by noninvasive imaging.
Keywords: vessel compliance, atherosclerosis, wall shear stress, finite element
INTRODUCTION
Atherogenesis is affected by hemodynamic parameters (Fry, 1968; Caro et al., 1971; Ku et al., 1985; Moore et al., 1994; He and Ku, 1996; Lei et al., 1996; Kleinstreuer et al., 2001), such as wall shear stress (WSS), WSS spatial gradient (WSSG), and oscillatory shear index (OSI). These parameters are strongly influenced by flow disturbances, which are largely dependent on the geometry of arterial tree (Ku, 1997). The locations with low WSS and high OSI have been thought to be atherosclerotic-prone (Caro et al., 1971; Ku et al., 1985; Moore et al., 1994; He and Ku, 1996). The high WSSG hypothesis of atherogenesis has been proposed at the flow reattachment, where the permeability of LDL (low-density lipoprotein) is increased (DePaola et al. 1992; Herrmann et al., 1994; Buchanan et al., 1999; Kleinstreuer et al., 2001; Ogunrinade et al., 2002). The effect of vessel compliance on WSSG has not been investigated.
The CFD (computational fluid dynamic) model has been used to describe the flow patterns in different anatomical geometries (Perktold et al., 1991a; 1991b; Santamarina et al., 1998; Taylor et al., 1998; Weydahl et al., 2001; Stroud et al., 2002; Zeng et al, 2003; Ramaswamy et al., 2004; Sankaranarayanan, 2006). We have recently used the FE (finite element) method to investigate the flow patterns in the epicardial arterial tree of porcine (Huo et al., 2007) and entire length of mouse aorta and primary branches (Huo et al., 2008), in which the vessel walls were assumed to be rigid. Moore and his associates implemented a dynamic analysis in a curved tube model (Santamarina et al., 1998) and a bifurcation model (Weydahl et al., 2001) of coronary arteries, where an idealized motion was used to mimic the heart beat. Ethier and his colleagues (Zeng et al., 2003) investigated the effects of cardiac-induced motion on hemodynamics in the main trunk of human right coronary arteries. Although the motion induced by heart beat has been investigated, the wall motion due to vessel compliance has not been considered. The objective of the present study is to investigate the effect of vessel compliance on the pulsatile flow pattern including WSS, WSSG, and OSI in the epicardial right coronary arterial (RCA) tree.
The morphometric data of RCA tree was obtained from CT (computed tomography) scans and the wall motion due to vessel compliance was measured by an impedance catheter (Kassab et al., 2005; Kassab et al., In review). An inlet boundary condition was imposed from the measured flow velocity and the outlet boundary condition was an estimated flow velocity from scaling laws (Kassab, 2006, Huo and Kassab, 2009a; 2009b). The Galerkin FE method (Huo and Li, 2004; 2006) was used to solve the Navier-Stokes and Continuity equations through FORTRAN program. After the meshes were updated at each time step, the convective term in the Navier-Stokes equation was changed based on the arbitrary Lagrangian-Eulerian (ALE) frameworks (Donea J., 1983). The hemodynamic parameters (i.e., WSS, WSSG, and OSI) were analyzed systematically. The results show that OSI is small in the epicardial RCA tree. Motion due to vessel compliance has a small effect on the time-averaged WSS and WSSG in the main trunk of RCA tree, but decreases WSSG at bifurcations. The decrease in time-averaged WSSG at the bifurcation flow divider has been shown to decrease wall permeability and hence may be atheroprotective. The significance and limitation of the FE model are outlined.
MATERIALS AND METHODS
Animal Preparation
Studies were performed on five normal Yorkshire porcine of either sex with body weight of 34.3– 42.1 kg. The experimental procedures of the animal preparation were similar to those described by Kassab et al (1993; 2005; In review). The animal protocols were approved by the Institutional Animal Care and Use at Indiana University-Purdue University, Indianapolis.
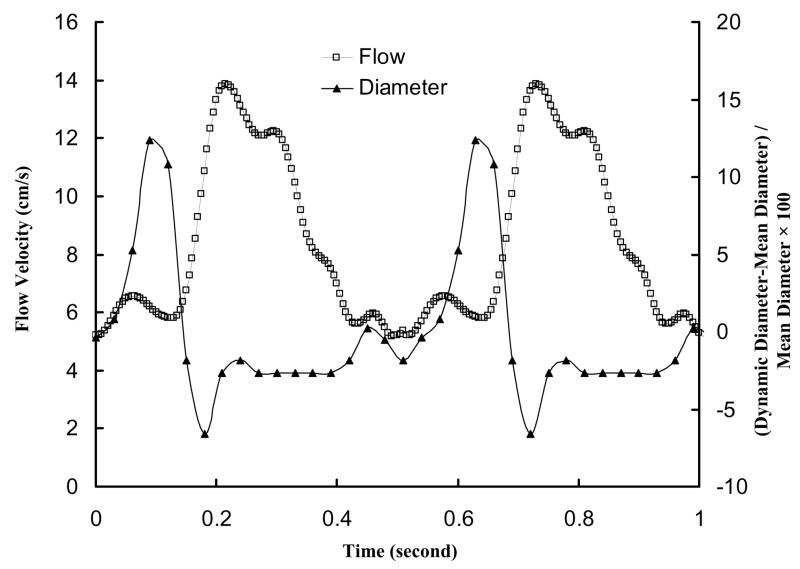
Briefly, surgical anesthesia was induced with TKX (Telaxol 500 mg, Ketamine 250 mg, Xylazine 250 mg) and was maintained with pentobarbital sodium (30 mg/kg iv in an ear vein). A midline sternotomy was performed; ventilation with room air was provided with a respiratory pump; and anticoagulation was provided with heparin (100 IU/kg). Arterial pressure was measured through a catheter inserted through the carotid artery into the ascending aorta. The perivascular flow probe (Transonic Systems Inc.; relative error of ±2% at full scale), which was connected to the flow meter module by a flexible cable, was mounted on the most proximal RCA directly. Both flow meter module and pressure catheter were monitored with a Biopac, MP 100. A sheath was introduced through the ascending aorta to access RCA. An impedance catheter (diameter of 1.0 mm) was inserted through the sheath to access RCA (Kassab et al., 2005; Kassab et al., In review). The dynamic changes of lumen cross-sectional area (CSA) of RCA were measured using the impedance catheter and the two-injection method (Kassab et al., 2005; Kassab et al., In review). Figure 1 shows the measured inlet RCA flow velocity and phasic vessel wall diameter.
Figure 1.
In vivo pulsatile flow velocity waveforms measured at the inlet of RCA arterial tree in porcine heart; Dynamic changes of elastic vessel diameter represented by (Instantaneous Diameter-Mean Diameter)/Mean Diameter × 100.
An incision was made in the pericardium, and the heart was supported in a pericardial cradle. A 1-liter bottle containing a hypothermic (10° C), isotonic, cardioplegic rinsing solution [composed of EGTA, 1 mM; calcium-channel blocker nifedipine, 0.2mg/l; and adenosine, 80mg/l] was hung above the heart. A 14-gauge needle was connected to the rinsing solution with Tygon tubing. The needle was inserted into the ascending aorta with no perfusion initially. The heart was then arrested with a saturated KCl solution given through a jugular vein, and the tubing was unclamped to allow immediate perfusion of the cardioplegic rinsing solution. The aorta was clamped proximal to the needle to allow perfusion of the coronaries through Valsalva’s sinus. The superior and inferior venae cavae were cut to allow free drainage of blood. The heart was covered with crushed ice for several minutes during perfusion with ~500 ml of cardioplegic solution. The heart was then excised with the ascending aorta still clamped to keep air bubbles out of the coronary arteries.
Anatomical Model from CT Scans
After the heart was excised, it was placed in a saline solution. The RCA, LAD (left anterior descending artery), and LCX (left circumflex artery) were cannulated under saline to avoid air bubbles and perfused with cardioplegic solution to flush out the blood. The three major arteries (RCA, LAD and LCX) were individually perfused at a pressure of 100 mmHg with three different colors of Microfil (Flow Tech Inc.). After the Microfil was allowed to harden for 45 to 60 minutes the hearts were kept in the refrigerator in saline solution until the day the CT scan was performed. The scans were made axially (120mas 120kv, 0.6/0.6mm slice) on a 16 slice scanner (Siemens Somatom). A reconstructed CT Image of RCA was selected for mesh generation.
3-D FE Model
The Navier-Stokes (momentum) and continuity equations were solved using Galerkin FE method (Huo and Li, 2004; 2006). The dynamic mesh was updated by solving a Laplace problem and the convective term in the momentum equation was changed based on the arbitrary Lagrangian-Eulerian (ALE) frameworks. FORTRAN program was used to implement the FE method. The details of mathematical formulations are described in Appendix A.
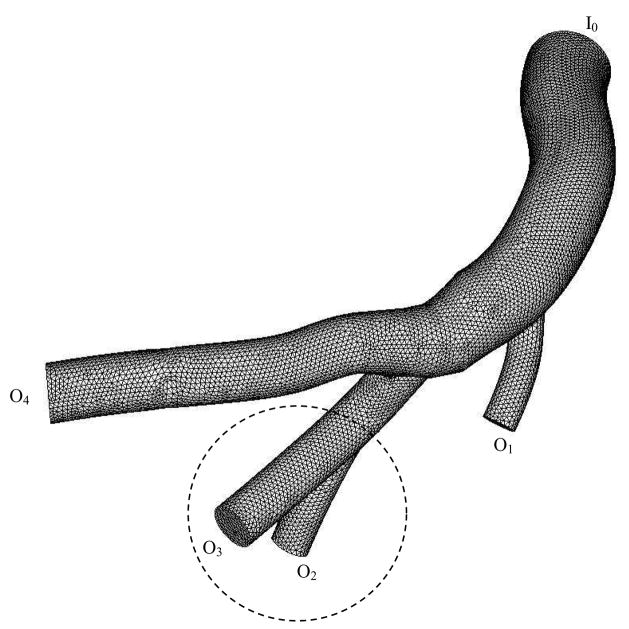
Before the final transient simulation, a mesh dependency was conduced so that the relative error in two consecutive mesh refinements was smaller than 1% for the maximum velocity for steady state flow with inlet flow velocity equal to the time-averaged velocity over a cardiac cycle. A total of almost 310,000 finite elements were required to accurately mesh the computational domains, as shown in Fig. 2. The backward method was used for the time integration. A constant time step was employed, where Δt = 0.005 s with 108 total time step per cardiac cycle. Although blood is a suspension of particles, it behaves as a Newtonian flow in tubes with diameters > 1 mm (Nichols et al., 1998). The epicardial RCA vessel segments considered satisfy this criterion, as shown in Table 1. The viscosity (μ) and density (ρ) of the solution were selected as 4.5 cp (Nichols et al., 1998) and 1.06 g/cm3 (Cutnell et al., 2006), respectively, to mimic blood flow with a hematocrit of about 45% in medium size arteries.
Figure 2.
Finite element mesh for numerical computation of RCA tree, where I0 represents the inlet of RCA tree and O1–O4 are the outlets of RCA tree.
Table 1.
Diameter and hemodynamic parameters (time-averaged mean velocity, time-averaged flow rate, and flow split) in right coronary arteries; Remean is the mean Reynolds number as defined in Eq. [10]; I and O represent inlet and outlet of the epicardial RCA tree, as shown in Fig. 2.
| RCA | Diameter (mm) | Time- averaged Mean Velocity (cm/s) | Time- averaged flow rate (ml/min) | Flow split (%) | Remean | |
|---|---|---|---|---|---|---|
| Inlet | I0 | 3.45 | 8.17 | 45.82 | 100 | 80 |
|
| ||||||
| Outlets | O1 | 1.4 | 6.05 | 5.59 | 12 | 24 |
| O2 | 1.6 | 6.33 | 7.63 | 16 | 29 | |
| O3 | 2.0 | 6.81 | 12.84 | 28 | 39 | |
| O4 | 2.45 | 7.29 | 20.62 | 45 | 51 | |
| Σ all primary branches | ~101 | |||||
A uniform flow velocity profile was assumed at the inlet of RCA tree because the RCA tree attaches to the aorta. The parabolic flow velocity profile was applied to each outlet of RCA tree because the inlet blunt flow velocity can quickly develop into a fully-developed parabolic profile (Huo et al., 2007).
Hemodynamic Parameters
The velocity and pressure of the blood flow were calculated by solving the equations of continuity and Navier-Stokes. Reynolds and Womersley numbers were obtained from the geometry and dynamic parameters. WSS, WSSG, and OSI were determined based on the velocity field (see detailed formulation in Appendix B).
RESULTS
The flow velocity was calculated from the flow rate measured at the proximal RCA by a perivascular flow probe. Figure 1 shows in vivo pulsatile flow velocity with heart rate of about 110 beats/minute. Since several proximal arteries were only investigated, we found no changes of the ratio of instantaneous diameter to mean diameter. The dynamic changes of vessel diameter due to vessel compliance, as shown in Fig. 1, were measured at the RCA using an impedance catheter. Figure 2 shows the meshes obtained from CT scans, where I0 represents the inlet of RCA tree and O1–O4 are the outlets of RCA tree. Table 1 lists the morphometric and hemodynamic parameters (time-averaged mean velocity, time-averaged flow rate, and flow split) corresponding to Fig. 2.
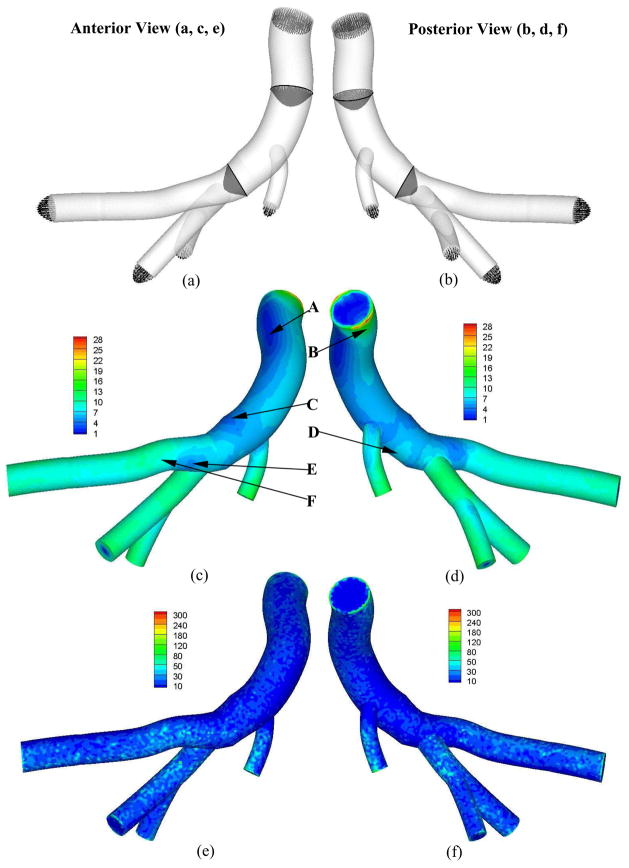
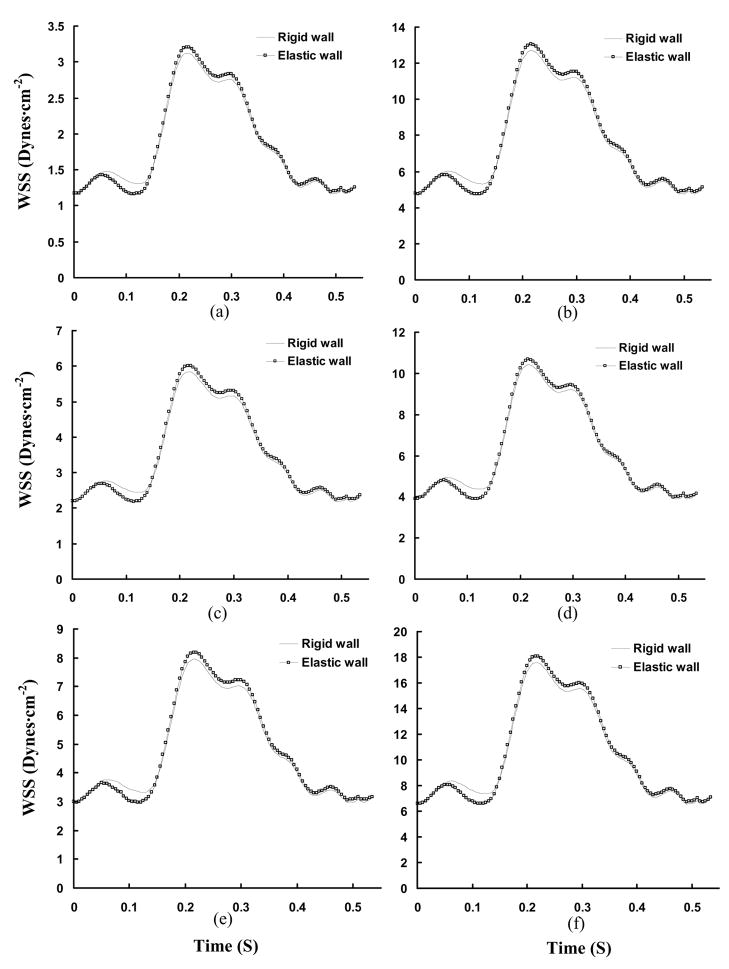
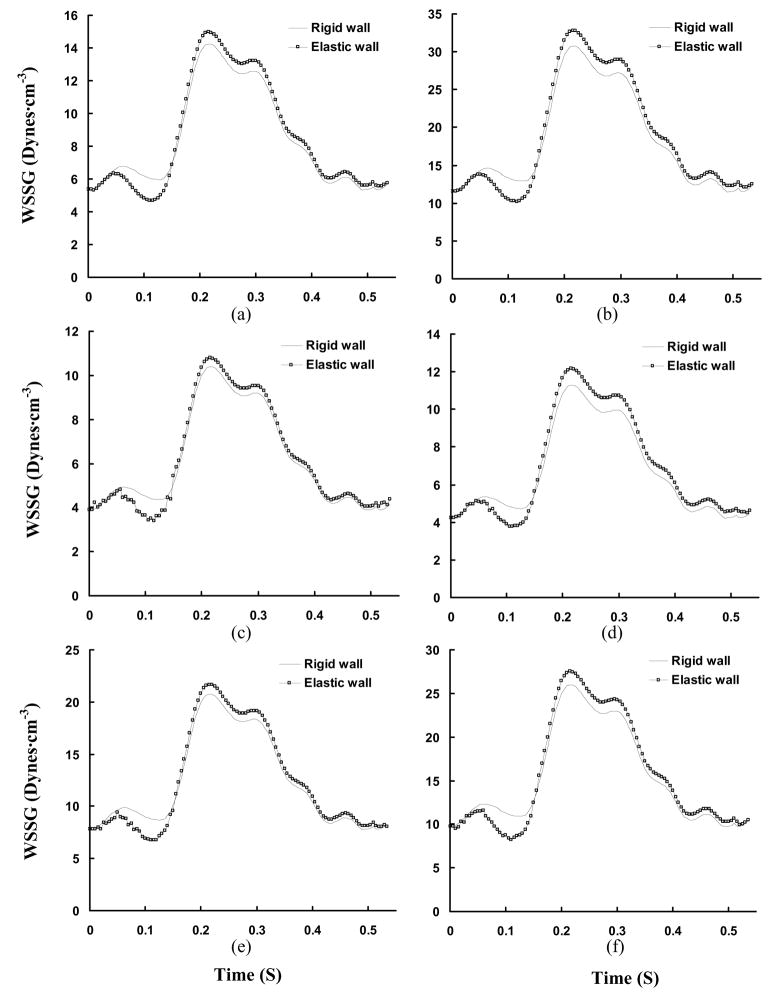
Figures 3a and 3b show the time-averaged cross-sectional flow velocity vector over a cardiac cycle along the main trunk of RCA tree in anterior and posterior views, respectively. It is found that the blunt core velocity profile at the inlet of RCA tree gradually develops into a parabolic velocity profile. Reynolds number and Womersley number are about 80 and 2, respectively, at the inlet of RCA tree. Figures 3c–d and 3e–f show the distribution of time-averaged WSS and WSSG, respectively, corresponding to Figs. 3a and 3b. The curved and twisted main trunk of RCA, as shown at positions A and B in Fig. 3, has a very complex distribution of WSS and WSSG. There is low WSS at positions C (opposite to junction orifice between main trunk and primary branches) and E (lateral to junction orifice) in Fig. 3. Figures 4a–f and 5a–f show the transient change of WSS and WSSG, respectively, along the main trunk of RCA. It is noted that the elastic vessel wall has a relatively small effect on WSS and WSSG in the main trunk. There is a very small value of OSI (< 0.002) in these arteries.
Figure 3.
Time-averaged velocity vector (Grid Units/Magnitude of Velocity = 0.01) (a: anterior views, b: posterior view); Time-averaged WSS (Unit: Dynes·cm−2) (c: anterior views, d: posterior view); and time-averaged WSSG (Unit: Dynes·cm−3) fields over a cardiac cycle (e: anterior views, f: posterior view); respectively.
Figure 4.
Transient WSS (Unit: Dynes·cm−2) in a cardiac cycle, where Figs. a–f show the change of WSS at positions A–F in Figs. 3c and 3d.
Figure 5.
Transient WSSG (Unit: Dynes·cm−3) in a cardiac cycle, where Figs. a–f show the change of WSSG at positions A–F in Figs. 3c and 3d.
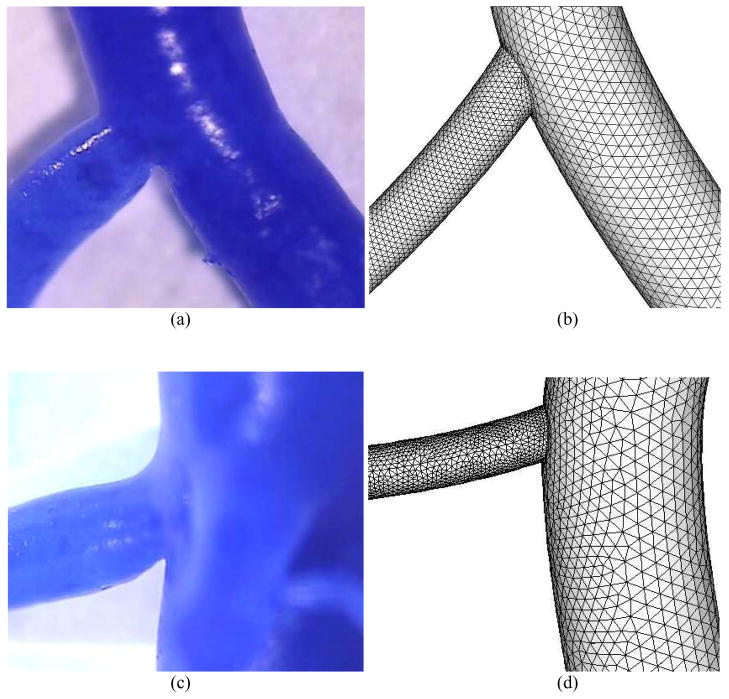
Bifurcations of different diameter ratios (the ratio of small to large daughter diameters) were obtained from casts, as shown in Figs. 6a and c as typical examples. The bifurcation with outlets O2 and O3 marked in Fig. 2 was changed to reflect the different diameter ratios of 0.5 and 0.3, which represents most bifurcations in the epicardial coronary arterial tree (Kaimovitz et al., 2008). The boundary condition at outlet O2 in Fig. 2 was recalculated based on a scaling law and cast diameter. The respective meshes are shown in Figs. 6b and d.
Figure 6.
Arterial bifurcation casts and the corresponding finite element meshes for bifurcations with diameter ratio of 0.5 (a–b) and 0.3 (c–d). The diameter ratio is defined as small daughter diameter/large daughter diameter
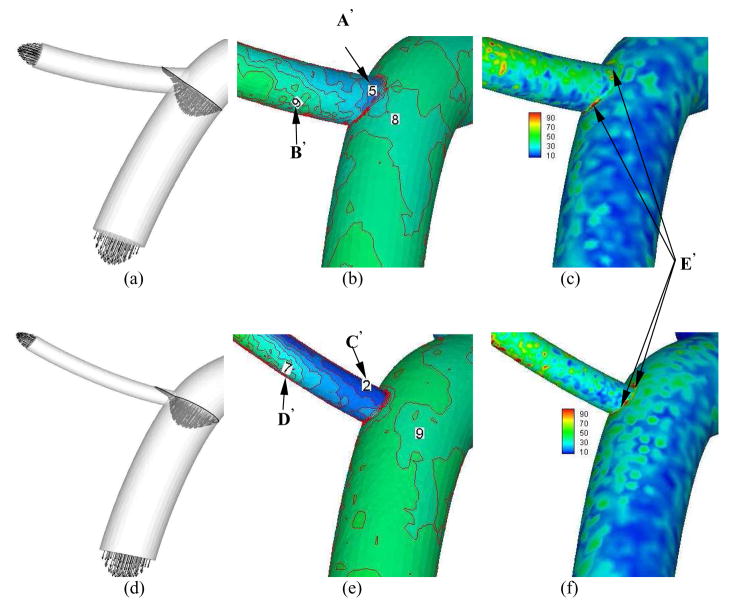
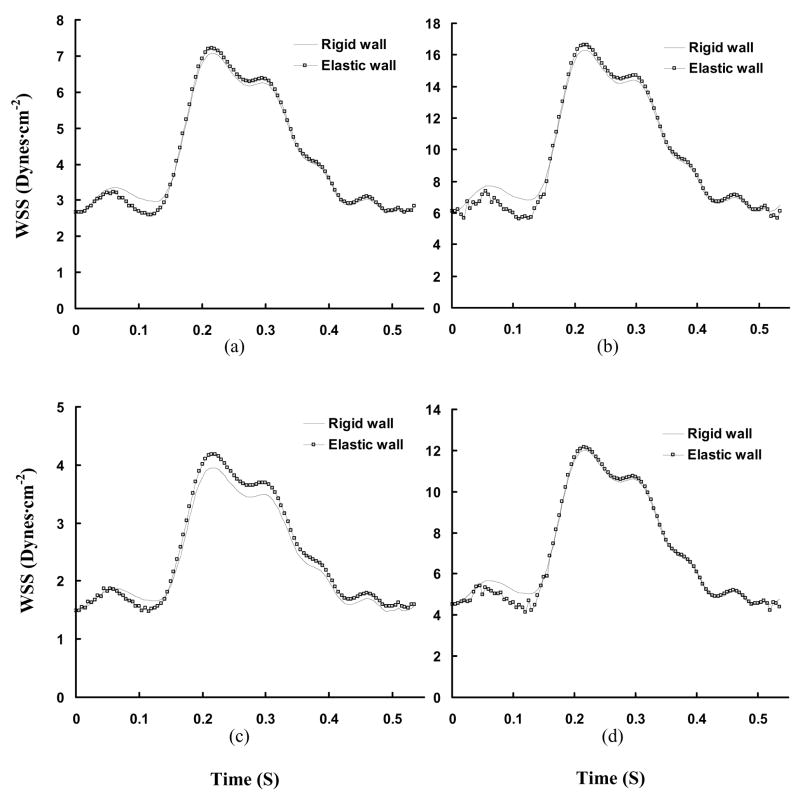
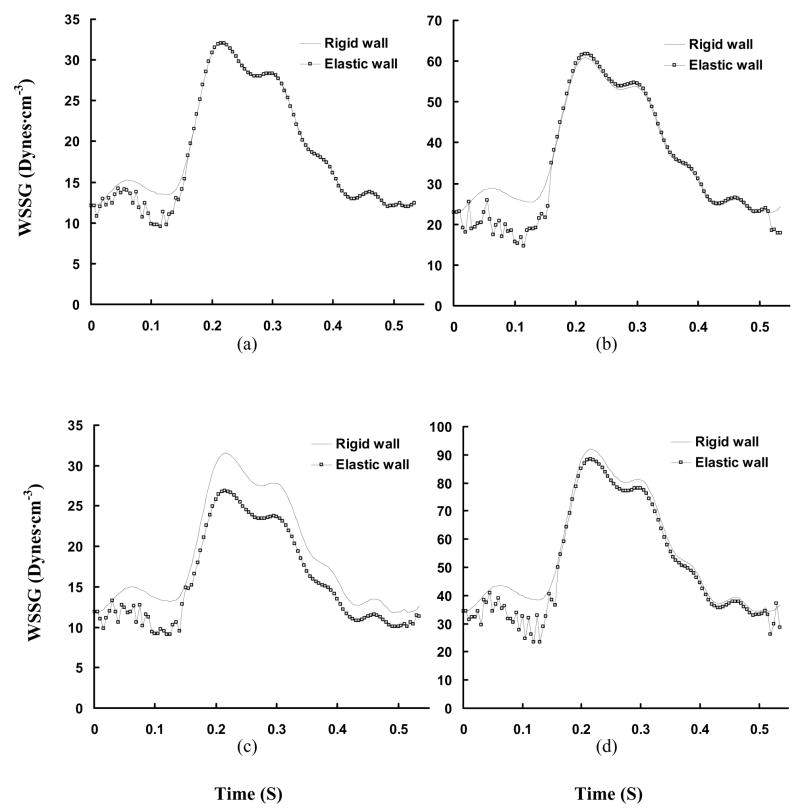
Figures 7a–c show the time-averaged velocity vector, WSS, and WSSG, respectively for diameter ratio of 0.5. Consequently, Figures 8a–b and 9a–b show the transient change of WSS and WSSG at positions A′ (opposite to flow divider) and B′ (flow divider) in Fig. 7b, respectively. Figures 7d–f show the time-averaged velocity vector, WSS, and WSSG for diameter ratio of 0.3. Figures 8c–d and 9c–d show the transient change of WSS and WSSG, respectively for diameter ratio of 0.3. Table 2 shows the time-averaged WSS and WSSG at positions A′–D′ in Fig. 7. It is found that WSS opposite to flow divider (positions A′ and C′) decreases with the diameter ratio. The WSSG at flow divider (positions B′ and D′) increases as the diameter ratio decreases. In particular, there is strong WSSG around the orifice as shown at positions E′ in Fig. 7. The vessel compliance reduces the time-averaged WSSG at flow divider as compared with rigid wall.
Figure 7.
Time-averaged velocity vector (Grid Units/Magnitude of Velocity = 0.008), WSS (Unit: Dynes·cm−2), and time-averaged WSSG (Unit: Dynes·cm−3) for arterial bifurcations with diameter ratio = 0.8 (a–c); diameter ratio = 0.5 (d–f); and diameter ratio = 0.3 (g–i)
Figure 8.
Transient WSS (Unit: Dynes·cm−2) in a cardiac cycle, where Figs. a–d show the change of WSS at positions A′–D′ in Fig. 7.
Figure 9.
Transient WSSG (Unit: Dynes·cm−3) in a cardiac cycle, where Figs. a–d show the change of WSSG at positions A′–D′ in Fig. 7.
Table 2.
Hemodynamic parameters (Time-averaged WSS and WSSG) at bifurcations of RCA with different diameter ratios, where A′–D′ correspond to positions A′–D′ in Fig. 7
| Positions | WSS (Dynes·cm−2) | WSSG (Dynes·cm−3) | ||
|---|---|---|---|---|
| Rigid Wall | Elastic Wall | Rigid Wall | Elastic Wall | |
| Low WSS Position (opposite to flow divider) | ||||
| A′ | 4.18 | 4.18 | 18.9 | 18.4 |
| C′ | 2.33 | 2.42 | 18.6 | 15.7 |
|
| ||||
| High WSS Position (at flow divider) | ||||
| B′ | 9.61 | 9.53 | 35.9 | 34.1 |
| D′ | 7.08 | 7.02 | 54.2 | 50.3 |
DISCUSSION
A Galerkin 3-D FE model was used to perform a detailed hemodynamic analysis of proximal RCA tree obtained from CT scans. The 3-D mesh moving technique was used to solve the moving flow boundaries due to vessel compliance. The effect of diameter ratio was studied at bifurcations. The major findings are: 1) vessel compliance decreases the time-averaged WSSG at the flow divider of bifurcations while it has a relatively small effect on WSS and WSSG in the main trunk of epicardial RCA tree and 2) OSI is small in the proximal right coronary arteries.
A recent study of porcine LAD epicardial arterial tree (Huo et al., 2007) showed that low WSS and high OSI occur opposite to flow divider and lateral to the junction orifice. High WSSG, on the other hand, is found at the flow divider. Our results show a very low value of OSI (<0.002) in the proximal RCA because there are no retrograde flows in the RCA (Hoffman and Spaan, 1990). Figure 1 shows that the minimum flow velocity at the inlet of RCA is > 5 cm/s unlike the significantly lower flow velocity at the inlet of LAD (Huo et al., 2007) and aorta (Huo et al., 2008), which is largely responsible for the high OSI.
The low WSS occurs opposite to junction orifice between main trunk and primary branches and lateral to junction orifice, as shown at positions C and E in Figs. 3c and d, which is consistent with previous studies (Huo et al., 2007; 2008). Unlike the LAD and aortic arch, low and high WSS, as shown at positions A and B in Fig. 3c and d, do not exist on the large inner and outer curvature of RCA main trunk, respectively. This may be due to the twisted and curved geometry of RCA main trunk (Fig. 2), which generates small transformations (e.g., pitch, roll, or yaw) inside the large curvature so that it leads to much more complex WSS distribution in RCA than LAD. Since the time-averaged velocity is smaller in RCA than LAD, the value of WSS is correspondingly lower. The complex and low WSS in the RCA main trunk may lead to more atherosclerotic-prone sites, which is consistent with direct observation (Asakura and Karino, 1990).
We investigated the distribution of flow velocity, WSS, and WSSG at bifurcations of several different diameter ratios obtained from morphometric data. The flow simulation at bifurcations in Fig. 7 has the same features as those at bifurcations of LAD epicardial arterial tree (Huo et al., 2007); i.e., low WSS coincident with low WSSG which occurs opposite to flow divider and lateral to the junction orifice and high WSSG at the flow divider. Furthermore, it is noted that low WSS opposite to flow divider decreases with a decrease in diameter ratio, as shown at positions A′ and C′ in Fig. 7. This may be caused by the relatively enlarged zone of stagnated or secondary flows opposite to flow divider, as shown in Figs. 7a and d.
The cross-sectional area of coronary arteries undergoes large change over a cardiac cycle due to vessel compliance (Hamza et al., 2003). A reduction of arterial wall compliance is associated with the onset of disease, such as atherosclerosis, hypertension, and diabetes mellitus (Glasser et al., 1997). For example, Farrar et al. (1991) showed a decrease in monkey aortic distensibility with the development of atherosclerosis and restoration with atherosclerosis regression. The relation between vessel compliance and hemodynamics parameters has not been previously investigated in the RCA tree. The change of vessel diameter due to vessel compliance (Fig. 1) was measured by an impedance catheter. The comparison of WSS between rigid and elastic models is shown in Fig. 4 for main trunk and Fig. 8 for bifurcation in the proximal RCA tree. The distribution of time-averaged WSS in elastic vessels of RCA main trunk is similar to that in rigid vessels. Ethier and his associates (Zeng et al., 2003) studied the blood flow patterns in the main trunk of RCA without considering the primary branches and found that the time-averaged WSS distribution was similar to the prediction in a static model. At bifurcations, Table 2, there is a small difference between time-averaged WSS between elastic and rigid walls.
Experimental studies (Zeinder et al., 1989; Herrmann et al., 1994) have shown that there is elevated LDL permeability at the flow divider with high WSS, which apparently contradicts the “low WSS-atherogenesis” hypothesis. DePaola et al. (1992) and Buchanan et al. (1999) related the elevated LDL permeability to high WSSG. It has been postulated that low WSS and high WSSG may increase permeability by different mechanisms (Ogunrinade et al., 2002). The time-averaged WSSG, as shown in Table 2, is found to decrease at the flow divider of elastic bifurcations. Lever and his colleagues (1993, 1996) showed that protein movement across the artery wall depends on transmural pressure and flow-sensitive polarization layer. Meyer et al. (1996) showed that rigid and elastic vessel segments have the same LDL uptake when the transmural pressure is in normal range of 70 mmHg. The vessel elasticity plays a more important role in higher pressures (e.g., at 120 and 160 mmHg). The permeability of LDL is not affected by the pressure since the pressure change induced by the vessel compliance is found to be small in the epicardial RCA tree. The permeability of LDL is determined mainly by the flow parameters; i.e., WSS and WSSG. The elasticity-induced decrease of time-averaged WSSG at flow divider, as shown in Figs. 9b and 9d and Table 2, implies that the elasticity may reduce the permeability of LDL at bifurcations.
Critique of the Model
Although the motion of vessel wall is due to heart beat and vessel compliance, only vessel compliance is considered here. The motion due to heart beat can be included when the experimental measurement is available in the epicardial RCA tree. Since the flow is assumed to be single phase, only hemodynamic parameters (WSS, WSSG, and OSI) are analyzed. The multi-phase mass transport models (Tarbell, 2003) can be incorporated into the present FE model to predict permeability of LDL. Although previous published literatures support the predictions of FE model, the direct experimental measurements should be made to compare the permeability of LDL between rigid and elastic vessel bifurcations in future studies.
Significance of the Model
The present study developed a FE model based on CT scans and physiological measurements in the normal epicardial RCA tree to predict the role of vessel compliance. The hemodynamic parameters indicate the possible sites of predilection to atherosclerosis. In the future, the model can be made patient specific through medical imaging to guide diagnosis, intervention, and therapy.
Acknowledgments
This research is supported in part by the National Institute of Health-National Heart, Lung, and Blood Institute Grant R01-HL84529 and the AHA Scientist Development Grant 0830181N.
APPENDIX A
FE Model
Governing Equations and Boundary Conditions
The governing equations were formulated for an incompressible, Newtonian fluid. The equations of Continuity and Navier-Stokes can be written as:
| [1] |
| [2] |
where v, P, ρ, and μ represent the velocity vector, pressure, blood density, and viscosity, respectively. Equations [1] and [2] are solved for velocity and pressure given appropriate boundary and initial conditions. Because the moving wall boundary due to vessel compliance is considered, the 3-D mesh moving technique is used to solve the moving fluid boundaries. In the present study, we update the mesh by solving a Laplace problem which provides the displacement (s = x · e1 + y · e2 + z · e3) of each point as follows:
| [3] |
After Eq. [3] is solved, the nodal velocity (vnode) due to the transient changes of meshes, is calculated. The convective term in Eq. [2] is changed to ρ (v + vnode) · ∇v, based on the ALE frameworks.
The solution of governing equations in RCA is determined subject to the following boundary conditions:
| [4] |
| [5] |
| [6] |
Equations [4–6] are inlet flow (vinlet), moving wall (vwall), and outlet flow (voutlet) boundary conditions, respectively. The inlet flow and moving wall boundary conditions, as shown in Fig. 1, are obtained from experimental measurements. The outlet flow boundary conditions are estimated based on scaling laws (Kassab GS, 2006; Huo and Kassab, 2009a; 2009b).
Method of Solution
Equations [1] and [2] are solved using the FE method described in our previous studies (Huo and Li, 2004, 2006). Briefly, the computational domain of blood flow is first divided into small elements. With each element, the dependent variables v and P are interpolated by the shape functions, φ(x) and ψ(x) (x is the coordinate), as:
| [7] |
where Vm (t) and P(t) (superscript m denotes the m-th component of velocity vector) are the unknown column vectors at each element nodal point. The matrix form of the discretized equations may be written as follows:
| [8] |
where the global matrices M, A(V), C, and K are assembled from the following element matrices
and
where Ωe is the computational domain of an element, ei (i =1, 2, 3) is a unit vector in the i-th direction. The right-hand side of Eq. [8] (F1 and F2) is obtained from the inlet and outlet conditions, Eqs. [4] and [6], respectively, which is iteratively updated at every time step in the transient computation.
With each element, the displacement variable s is interpolated by the shape functions, s(x) = ϕ (x)S. The matrix form of the discretized Eq. [3] may be written as follows:
| [9] |
where F3 is determined by Eq. 5. The nodal velocity (vnode) due to the transient changes of meshes is calculated in each node, which is incorporated in the convective term A(V). The assembled global matrix equations are stored and solved using the LU decomposition with partial pivoting and triangular system solvers through forward and back substitution (Superlud_dist, which is implemented in ANSI C, and MPI for communications) in the BigRed Cluster of Indiana University, which is a 1024-node (4096- processors) distributed shared-memory cluster, designed around IBM’s BladeCenter JS21.
The fluid calculation with moving wall is solved iteratively using the backward method. A new mesh is generated from Eq. [9] at the next time and the velocity vnode is calculated at each nodal point and Eq. [8] is then solved for the fluid flow field. The iteration continues until all the variables converge within a preset tolerance (relative error of flow velocity < 1 × 10⁻⁴).
APPENDIX B
Hemodynamic Parameters
The Reynolds (Re) and Womersley (α) numbers are defined as follows:
| [10] |
| [11] |
whereV = Vmin, Vmax, or Vmean, R and D, ω ρ, and μ represent minimum, maximum, or time-averaged velocity at the inlet of ascending aorta, radius and diameter of ascending aorta, angular frequency of beating hearts, blood mass density, and viscosity, respectively.
At any point of 3-D FEM model, the stress can be represented as a nine-component tensor ( ), which can be written as follows:
| [12] |
where is the shear rate tensor. The stress on the wall, its normal component, and its two tangential components can be written as, respectively:
| [13] |
where n, t1, and t2 are the unit vector in the normal and two tangential directions, respectively. The present time-averaged OSI can be written as follows:
| [14] |
The spatial derivatives of the stress can be obtained as follows:
| [15] |
where n, t1, and t2 are the natural coordinates. As define by (Buchanan et al., 1999), the diagonal components and generate intracellular tension, which causes widening and shrinking of cellular gap. However, the diagonal component can cause endothelial cells rotation, which may destroy the endothelial function too. Therefore, WSSG is defined as follows:
| [16] |
The time-averaged WSSG can be written:
| [17] |
In order to plot the shear stress in the entire computational domain, WSS is determined as the product of viscosity (μ) and wall shear rate (γ̇), which is defined as:
| [18] |
The time-averaged WSS can be written as follows:
| [19] |
Equations [14] and [16–19] were used to calculate the OSI, WSSG, and WSS in the FE model.
Footnotes
Publisher's Disclaimer: This is a PDF file of an unedited manuscript that has been accepted for publication. As a service to our customers we are providing this early version of the manuscript. The manuscript will undergo copyediting, typesetting, and review of the resulting proof before it is published in its final citable form. Please note that during the production process errors may be discovered which could affect the content, and all legal disclaimers that apply to the journal pertain.
References
- 1.Asakura T, Karino T. Flow patterns and spatial distribution of atherosclerotic lesions in human coronary arteries. Circ Res. 1990;166:1045–1066. doi: 10.1161/01.res.66.4.1045. [DOI] [PubMed] [Google Scholar]
- 2.Buchanan JR, Kleinstreuer C, Truskey GA, Lei M. Relation between non-uniform hemodynamics and sites of altered permeability and lesion growth at the rabbit aorto-celiac junction. Atherosclerosis. 1999;143:27–40. doi: 10.1016/s0021-9150(98)00264-0. [DOI] [PubMed] [Google Scholar]
- 3.Caro CG, Fitz-Gerald JM, Schroter RC. Atheroma and arterial wall shear observations, correlation and proposal of a shear dependent mass transfer mechanism for atherogenesis. Proc R Soc London B. 1971;177:109–159. doi: 10.1098/rspb.1971.0019. [DOI] [PubMed] [Google Scholar]
- 4.Cutnell JD, Johnson KW. Physics. 4. Hoboken, NJ: Wiley; 2006. [Google Scholar]
- 5.DePaola N, Gimbrone MA, Davies PF, Dewey CF. Vascular endothelium response to fluid shear stress gradients. Arterioscler Thromb Vasc Biol. 1992;12:1254–1257. doi: 10.1161/01.atv.12.11.1254. [DOI] [PubMed] [Google Scholar]
- 6.Donea J. Arbitrary Lagrangian-Eulerian finite element methods. In: Belytschko T, Hughes TJR, editors. Computational Methods for Transient Analysis. North-Holland: Amsterdam; 1983. pp. 473–516. [Google Scholar]
- 7.Farrar DJ, Bond MG, Riley WA, Sawyer JK. Anatomic correlates of aortic pulse wave velocity and carotid artery elasticity during atherosclerosis progression and regression in monkeys. Circulation. 1991;83:1754–1763. doi: 10.1161/01.cir.83.5.1754. [DOI] [PubMed] [Google Scholar]
- 8.Fry DL. Acute vascular endothelia changes associated with increased blood velocity gradients. Circ Res. 1968;22:165–197. doi: 10.1161/01.res.22.2.165. [DOI] [PubMed] [Google Scholar]
- 9.Glasser SP, Arnett DK, McVeigh GE, Finkelstein SM, Bank AJ, Morgan DJ, Cohn JN. Vascular compliance and cardiovascular disease. AJH. 1997;10:1175–1189. doi: 10.1016/s0895-7061(97)00311-7. [DOI] [PubMed] [Google Scholar]
- 10.Hamza LH, Dang Q, Lu X, Mian A, Molloi S, Kassab GS. Effect of passive myocardium on the compliance of porcine coronary arteries. Am J Physiol Heart Circ Physiol. 2003;285:H653–H660. doi: 10.1152/ajpheart.00090.2003. [DOI] [PubMed] [Google Scholar]
- 11.He X, Ku DN. Pulsatile flow in the human left coronary artery bifurcation: average conditions. ASME J Biomech Eng. 1996;118:74–82. doi: 10.1115/1.2795948. [DOI] [PubMed] [Google Scholar]
- 12.Hoffman JIE, Spaan JAE. Pressure-flow relations in coronary circulation. Physiological Reviews. 1990;70:331–390. doi: 10.1152/physrev.1990.70.2.331. [DOI] [PubMed] [Google Scholar]
- 13.Herrmann RA, Malinauskas RA, Truskey GA. Characterization of sites of elevated low density lipoprotein at the intercostals celiac and iliac branches of the rabbit aorta. Arterioscler Thromb Vasc Biol. 1994;14:313–323. doi: 10.1161/01.atv.14.2.313. [DOI] [PubMed] [Google Scholar]
- 14.Huo Y, Kassab GS. Scaling of blood flow resistance: from single vessel to entire distal tree. Biophysical Journal. 2009a doi: 10.1016/j.bpj.2008.09.038. Will be published on volume 96(2) [DOI] [PMC free article] [PubMed] [Google Scholar]
- 15.Huo Y, Kassab GS. A scaling law of vascular volume. Biophysical Journal. 2009b doi: 10.1016/j.bpj.2008.09.039. Will be published on volume 96(2) [DOI] [PMC free article] [PubMed] [Google Scholar]
- 16.Huo Y, Guo X, Kassab GS. The flow field along the entire length of mouse aorta and primary branches. Ann Biomed Eng. 2008;36(5):685–99. doi: 10.1007/s10439-008-9473-4. [DOI] [PubMed] [Google Scholar]
- 17.Huo Y, Wischgoll T, Kassab GS. Flow patterns in three-dimensional porcine epicardial coronary arterial tree. Am J Physiol Heart Circ Physiol. 2007;293(5):H2959–H2970. doi: 10.1152/ajpheart.00586.2007. [DOI] [PubMed] [Google Scholar]
- 18.Huo Y, Li BQ. Surface deformation and marangoni convection in electrostatically-positioned droplets of immiscible liquids under microgravity. ASME J Heat Trans. 2006;128:520–529. [Google Scholar]
- 19.Huo Y, Li BQ. Three-dimensional marangoni convection in electrostatically positioned droplets under microgravity. Int J Heat Mass Trans. 2004;47:3533–3547. [Google Scholar]
- 20.Kaimovitz B, Huo Y, Lanir Y, Kassab GS. Diameter asymmetry of porcine coronary arterial trees: structural and functional implications. Am J Physiol Heart Circ Physiol. 2008;294(2):H714–723. doi: 10.1152/ajpheart.00818.2007. [DOI] [PubMed] [Google Scholar]
- 21.Kassab GS, Rider CA, Tang NJ, Fung YC. Morphometry of pig coronary arterial trees. Am J Physiol Heart Circ Physiol. 1993;265:H350–H365. doi: 10.1152/ajpheart.1993.265.1.H350. [DOI] [PubMed] [Google Scholar]
- 22.Kassab GS, Lontis ER, Horlyck A, Gregersen H. Novel method for measurement of medium size arterial lumen area with an impedance catheter: in vivo validation. Am J Physiol Heart Circ Physiol. 2005;288:H2014–H2020. doi: 10.1152/ajpheart.00508.2004. [DOI] [PubMed] [Google Scholar]
- 23.Kassab GS. Scaling laws of vascular trees: of form and function. Am J Physiol Heart Circ Physiol. 2006;290:H894–H903. doi: 10.1152/ajpheart.00579.2005. [DOI] [PubMed] [Google Scholar]
- 24.Kassab GS, Choy JS, Svendsen M, Sinha AK, Alloosh M, Sturek M, Huo Y, Hermiller J. A novel system for lumen reconstruction of coronary arteries in real-time: a preclinical validation. doi: 10.1152/ajpheart.01224.2008. In review. [DOI] [PubMed] [Google Scholar]
- 25.Kleinstreuer C, Hyun S, Buchanan JR, Jr, Longest PW, Archie JP, Jr, Truskey GA. Hemodynamic parameters and early intimal thickening in branching blood vessels. Crit Rev Biomed Eng. 2001;29:1–64. doi: 10.1615/critrevbiomedeng.v29.i1.10. [DOI] [PubMed] [Google Scholar]
- 26.Ku DN. Blood flow in arteries. Annu Rev Fluid Mech. 1997;29:399–434. [Google Scholar]
- 27.Ku DN, Gidden DP, Zarins CK, Glagov S. Pulsatile flow and atherosclerosis in the human carotid bifurcation. Arteriosclerosis. 1985;5:293–302. doi: 10.1161/01.atv.5.3.293. [DOI] [PubMed] [Google Scholar]
- 28.Lei M, Kleinstreuer C, Truskey GA. A focal stress gradient-dependent mass transfer mechanism for atherogenesis in branching arteries. Med Eng Phys. 1996;18(4):326–332. doi: 10.1016/1350-4533(95)00045-3. [DOI] [PubMed] [Google Scholar]
- 29.Lever MJ, Jay MT. Convective and diffusive transport of plasma proteins across the walls of large blood vessels. Front Med Biol Eng. 1993;5(1):45–50. [PubMed] [Google Scholar]
- 30.Lever MJ, Jay MT, Coleman PJ. Plasma protein entry and retention in the vascular wall: possible factors in atherogenesis. Can J Physiol Pharmacol. 1996;74(7):818–23. [PubMed] [Google Scholar]
- 31.Meyer G, Merval R, Tedgui A. Effects of pressure-induced stretch and convection on low-density lipoprotein and albumin uptake in the rabbit aortic wall. Circulation Research. 1996;79:532–540. doi: 10.1161/01.res.79.3.532. [DOI] [PubMed] [Google Scholar]
- 32.Moore JE, Xu C, Glagov S, Zarins GK, Ku DN. Fluid wall shear stress measurements in a model of the human abdominal aorta: oscillatory behavior and relationship to atherosclerosis. Atherosclerosis. 1994;110:225–240. doi: 10.1016/0021-9150(94)90207-0. [DOI] [PubMed] [Google Scholar]
- 33.Nichols WW, O’Rourke MF. McDonald’s blood flow in arteries: theoretical, experimental and clinical principles. 4. New York: Oxford University Press; 1998. [Google Scholar]
- 34.Ogunrinade O, Kameya GT, Truskey GA. Effect of fluid shear stress on the permeability of the arterial endothelium. Ann Biomed Eng. 2002;30:430–446. doi: 10.1114/1.1467924. [DOI] [PubMed] [Google Scholar]
- 35.Perktold K, Resch M, Florian H. Pulsatile non-Newtonian flow characteristics in a three-dimensional human carotid bifurcation model. ASME J Biomech Eng. 1991a;113:464–475. doi: 10.1115/1.2895428. [DOI] [PubMed] [Google Scholar]
- 36.Perktold K, Resch M, Peter RO. Three dimensional numerical analysis of pulsatile flow and wall shear stress in the carotid artery bifurcation. J Biomech. 1991b;24:409–420. doi: 10.1016/0021-9290(91)90029-m. [DOI] [PubMed] [Google Scholar]
- 37.Ramaswamy SD, Vigmostad SC, Wahle A, Lia YG, Olszewski ME, Braddy KC, Brennan TMH, Rossen JD, Sonka M, Chandran KB. Fluid dynamics in a human left anterior descending coronary artery with arterial motion. Ann Biomed Eng. 2004;32:1628–1641. doi: 10.1007/s10439-004-7816-3. [DOI] [PubMed] [Google Scholar]
- 38.Sankaranarayanan M, Ghista DN, Poh CL, Seng TY, Kassab GS. Analysis of blood flow in an out-of-plane CABG model. Am J Physiol Heart Circ Physiol. 2006;291:H283–H295. doi: 10.1152/ajpheart.01347.2005. [DOI] [PubMed] [Google Scholar]
- 39.Santamarina A, Weydahl E, Sigel JM, Moore JS. Computational analysis of flow in a curved tube model of the coronary arteries: effects of time-varying curvature. Ann Biomed Eng. 1998;26:944–954. doi: 10.1114/1.113. [DOI] [PubMed] [Google Scholar]
- 40.Stroud JS, Berger SA, Saloner D. Numerical analysis of flow through a severely stenotic carotid artery bifurcation. ASME J Biomech Eng. 2002;124:9–20. doi: 10.1115/1.1427042. [DOI] [PubMed] [Google Scholar]
- 41.Tarbell JM. Mass transport in arteries and the localization of atherosclerosis. Annu Rev Biomed Eng. 2003;5:79–118. doi: 10.1146/annurev.bioeng.5.040202.121529. [DOI] [PubMed] [Google Scholar]
- 42.Taylor CA, Hughes TJR, Zarins CK. Finite element modeling of three-dimensional pulsatile flow in the abdominal aorta: relevance to atherosclerosis. Ann Biomed Eng. 1998;26:975–987. doi: 10.1114/1.140. [DOI] [PubMed] [Google Scholar]
- 43.Weydahl ES, Moore JE. Dynamic curvature strongly affects wall shear rates in a coronary artery bifurcation model. Journal of Biomechanics. 2001;34:1189–1196. doi: 10.1016/s0021-9290(01)00051-3. [DOI] [PubMed] [Google Scholar]
- 44.Zeindler CM, Kratky RG, Roach MR. Quantitative measurements of early atherosclerotic lesions on rabbit aortae from vascular casts. Atherosclerosis. 1989;76:245–255. doi: 10.1016/0021-9150(89)90108-1. [DOI] [PubMed] [Google Scholar]
- 45.Zeng D, Ding Z, Friedman MH, Ethier CR. Effect of cardiac motion on right coronary artery hemodynamics. Ann Biomed Eng. 2003;31:420–429. doi: 10.1114/1.1560631. [DOI] [PubMed] [Google Scholar]


