


Abstract
Recently, it was proposed that DNA looping by the λ repressor (CI protein) strengthens repression of lytic genes during lysogeny and simultaneously ensures efficient switching to lysis. To investigate this hypothesis, tethered particle motion experiments were performed and dynamic CI-mediated looping of single DNA molecules containing the λ repressor binding sites separated by 2317 bp (the wild-type distance) was quantitatively analyzed. DNA containing all three intact operators or with mutated o3 operators were compared. Modeling the thermodynamic data established the free energy of CI octamer-mediated loop formation as 1.7 kcal/mol, which decreased to –0.7 kcal/mol when supplemented by a tetramer (octamer+tetramer-mediated loop). These results support the idea that loops secured by an octamer of CI bound at oL1, oL2, oR1 and oR2 operators must be augmented by a tetramer of CI bound at the oL3 and oR3 to be spontaneous and stable. Thus the o3 sites are critical for loops secured by the CI protein that attenuate cI expression.
INTRODUCTION
From viruses to humans, transcription is regulated by proteins that bind to DNA. It is becoming increasingly clear that, in most cases, genes are controlled by large, cooperative assemblages of proteins that wrap and loop the DNA. These protein-induced DNA conformational changes can constitute functional ‘epigenetic switches’ in which alternative configurations commit the system to one developmental pathway or another. Such is the case of temperate bacteriophages which exhibit either quiescent (lysogenic) or productive (lytic) growth. The classic epigenetic switch found in bacteriophage λ is not only a paradigm of transcriptional regulation, but is also at the basis of our understanding of phage lysogeny (1). The latter is relevant to the investigation of uses of phages as antibacterial agents and phage therapy (2–4), and to the control of several infectious diseases. Indeed, bacteriophages contribute to the virulence of many bacterial pathogens, largely by encoding the structural genes for virulence factors (5–8). Prophage induction and phage-mediated lysis can contribute to production and release of virulence factors from bacterial cells (9,10) which cause a wide range of diseases (7–12).
Our understanding of phage lysogeny is based primarily on the detailed information about the λ bacteriophage (13). Lysogeny may ensue after infection, if a repressor protein binds to multipartite operators and mediates cooperative, long-range interactions to repress the lytic genes and maintain a stable lysogenic state. Subsequently, adverse environmental conditions (DNA damage, poisoning, starvation, etc.) can trigger a cascade of events that leads to repressor inactivation and efficient switch to lysis. The lysogenic state of λ prophages is maintained by the λ repressor (CI). During lysogeny, dimers of CI bind to the oL and oR control regions, located about 2.3 bp apart on the phage genome and repress the pL and pR promoters of the lytic genes. Each control region contains three binding sites for CI, oL1, oL2, oL3 and oR1, oR2, oR3 (14). CI binds to these operators with an intrinsic affinity oL1 > oR1 > oL3 > oL2 > oR2 > oR3 (15,16). When bound to adjacent or nearby operators, pairs of dimers interact forming tetramers. These cooperative interactions improve the specificity and strength of CI binding, so that CI affinity varies as follows: oR1 ∼ oL1 ∼ oR2 ∼ oL2 > oL3 > oR3. Occupancy of oR2 by CI also activates transcription of the CI gene from the pRM promoter (17) to boost the amount of CI and favor the lysogenic state.
However, CI overexpression is regulated to avoid high concentrations that would obstruct efficient switching to lysis when necessary. Long-range DNA-looping between CI-bound operators oR and oL has been proposed to be critical for this regulation (18–20). DNA loops of 2850 bp have been demonstrated in vitro using electron microscopy, and the presence of the oL operator at 3.6-bp separation was shown to improve CI repression of the lytic pR promoter in vivo (18). Improved repression of pR in the presence of oL, expected to stabilize lysogeny, was confirmed in subsequent studies (20,21). Biophysical and structural studies (22–25) support the idea of Dodd and collaborators (20) that CI tetramers bound at oL1 and oL2 and at oR1 and oR2 can pair to form a CI octamer, which secures a loop of intervening DNA and juxtaposes the oL3 and oR3 operators. In this arrangement, a CI dimer bound at the strong oL3 site could coordinate with another bound to the weak oR3 site, forming a tetramer that would further secure the DNA loop (Supplementary Data, Figure S1). Such loop-driven cooperativity would favor oR3 occupancy at physiological CI concentrations to prevent CI overexpression from pRM, which would interfere with rapid switching from lysogeny to lysis (19,20). This model is based on in vivo experiments that show a strong dependence of pRM repression on the distant (3.6–3.8-bp separation) CI-binding sites at oL (19,20,26). Therefore in λ, DNA looping is thought to maximally attenuate transcription from pR and pL, achieve repression of pRM, and enables efficient switching to lysis from the lysogenic state.
Nonetheless, direct evidence for looping has been obtained only by electron microscopy, precluding observation of reversible looping dynamics, and only allowing observation of the presumed octamer-mediated loop (18). Model-based analyses of in vivo transcription data (20,26) have provided estimates of the energy for the formation of a CI octamer-mediated loop and for the tetramerization of CI bound to the o3 sites juxtaposed by the DNA loop. Here, we used the tethered particle motion (TPM) technique (27–30) to demonstrate dynamic, long-range CI-mediated DNA looping in vitro. The free energies of formation of CI octamer- and octamer+tetramer-mediated loops were measured using DNA with either wild-type or mutationally disrupted o3 operators. Modeling the manifold configurations quantified how a CI octamer-mediated loop is stabilized by an adjunct CI tetramer to give an ‘octamer+tetramer’ secured loop (20,26).
MATERIALS AND METHODS
Plasmids
The TPM measurements were performed on DNA derived from plasmids pDL2317 (wt λ DNA), pDLΔoL 2317 (λΔoL DNA), pDL2320 (λo3− DNA) and pDL2321 (λoL−oR− DNA). To obtain plasmid pDL2317, which contains the complete λ regulatory region, a 2028-bp fragment from bacteriophage λ DNA (New England Biolabs GmbH, Frankfurt am Main, Germany) was amplified using primers phageEcoRI, 5′-ttctgctttgaattctgcccttcttcagggcttaatttttaagagcgtcaccttcatgg-3′, and lambdaAVRI, 5′-tataacgccgcctaggttgcaaaaattctcaaagttagcgttgaagaatttagccc-3′. This fragment was then inserted between the BglII and AvrII restriction sites of plasmid pDL300 (27). To obtain plasmid pDLΔoL 2317, a 329-bp fragment from pDLΔoL1-2-3 (27) was amplified using primers BioC 5′-cgcaattaatgtgagttagctcactcattaggcaccccaggc-3′ and lambda Avr-BglR 5′-ctaggttgcaaaaattagatctctcacctaccaaacaatgcccccctgcaaaaaataaattcatataaaaaacatacag-3′, and inserted between the EcoRI and BglII restriction sites of pDL2317.
To obtain plasmids pDL2320 and pDL2321, a 2156-bp-long fragment from bacteriophage λ DNA was amplified using primers lambdaBglII, 5′-caggggggcattgtttggtaggtgagagatcttgaattgctatgtttagtgagttgtatc-3′ and lambda AvrIIbis, 5′-tataacgccgcctaggaaagaaaaatgaacttggcttatcccaggaatctgtcgcagacaagatggg3′. The product was cloned between the BglII and AvrII restriction sites in pDL965, which carries point mutations in the operators oL3 and oR3, and pDL970 which instead has point mutations in all the oL and oR binding sites (Lewis et al., manuscript in preparation). Since known mutations are leaky and pleiotropic, mutations r1 (7C to T, found in oR3) and v1 (6C to A, found in oR2) (17,31,32) were combined to eliminate CI binding. The DNA fragments for TPM, that are schematically represented in Figure 1, were obtained by PCR on templates pDL2317, pDLΔoL 2317, pDL2320 and pDL2321 in the presence of a biotin-labeled primer 5′-cgcaattaatgtgagttagctcactcattaggcaccccaggc-3′ and a digoxigenin-labeled primer 5′-gcattgcttatcaatttgttgcaacgaacaggtcactatcagtc-3′ (Oligos etc. Inc., OR, USA). In each fragment, except for λΔoL DNA, the oL and oR regulatory regions are separated by 2317 bp. All unmodified primers were purchased from Sigma Genosys (the Woodlands, TX, USA).
Figure 1.

DNA constructs used. Name and overall length are indicated next to each fragment. The length of the different parts of the fragments is indicated below the first and last fragment. The biotin (BIO) and digoxigenin (DIG) labels used to anchor the DNA molecules to the glass and bead surfaces are indicated at each end of the fragments. PL and PR are the two lytic promoters, while PRM is the promoter for cI transcription. The rectangular, shaded boxes on the DNA indicate the operators where CI binds specifically. The white boxes indicate the mutated operators.
Tethered particle motion experiments
Tethered particle motion assays
Details of the TPM technique have been published previously (27,29,30,33,34), and Figure 2 schematically illustrates the technique. In brief, a submicron-size bead is tethered by a single DNA molecule to the glass surface of a microscope flow-chamber. The mobile end of the invisible DNA is marked by the bead which exhibits Brownian motion that is constrained by the DNA tether length. Thus if the DNA undergoes a conformational change, such as loop formation, which reduces the effective tether length, the Brownian excursions of the bead will diminish. Stochastic, protein-mediated, DNA loop formation and breakdown will generate a telegraphic-like TPM signal in time.
Figure 2.

Schematics of the TPM experiment using a λ DNA tether. The six operators are indicated as white circles along the DNA. Dimers of CI bound to operators (cyan circles) can interact forming a DNA loop. The change in DNA length is recorded as a change in TPM signal,  , versus time.
Four to six antidigoxigenin-coated beads (480 nm; Indicia Diagnostics, Oullins, France) were tracked in each microchamber in λ buffer (10 mM Tris–HCl pH 7.4, 200 mM KCl, 5% DMSO, 0.1 mM EDTA, 0.2 mM DTT and 0.1 mg/ml α-casein) for ∼10 min. CI protein was added in the same buffer and tracking was continued for ∼30 min. The procedure was repeated in order to monitor the motion of 50 to 100 DNA-tethered beads for each CI concentration. The square modulus of the projected displacement vector ρ2(t) = x(t)2 + y(t)2 was calculated from the drift-corrected x(t) and y(t) as described (29). The 4-s moving average of the filtered time series, , produced traces such as those shown in Figure 3. The values obtained in the control experiments (no CI, ∼375 nm) and those corresponding to the looped state in the presence of CI (∼225 nm) were as expected from a published calibration curve (29) (Supplementary Data, Figure S2). Cumulative histograms of all the TPM data points were plotted and a Gaussian distribution was used to fit the data corresponding to the looped configuration of DNA (Figure 4). The loop probability was calculated as the ratio between the area under the Gaussian curve and the total area of the histogram. The uncertainties of the measured loop probability were determined by error propagation of the 68% confidence interval of the Gaussian fitting parameters.
Figure 3.

 as a function of time for beads tethered by a 3477-bp DNA fragment containing the oL-oR regulatory regions separated by 2317 bp (wt λ DNA): (upper) In the absence of CI (control), (middle) In the presence of 20 nM, and (lower) 80 nM CI. Frequency histograms, corresponding to the individual TPM traces, are shown to the left. The histograms are normalized to the total number of events and to the bin width (8 nm).
Figure 4.

Frequency histograms of the distribution of (Left): wt λ DNA in the presence of 20, 40, 80 and 170 nM CI; (lower left): λ▵oL DNA in the presence of 40 nM CI; (right): λo3− DNA at 20, 40, 80 and 170 nM CI; (lower right): λoL−oR− DNA with 40 nM CI. The histograms are normalized to the total number of events and to the bin width (4 nm). The solid lines show the results of fitting by a Gaussian distribution. The gray distributions are those of the control measurements performed in the absence of CI previous to each experimental condition.
CI concentrations
The estimated lysogenic concentration of CI is roughly 52 nM/prophage, assuming an average multiplicity of four chromosomes per cell (35). Thus we performed measurements between 20 and 170 nM. Data obtained at any higher concentrations were not interpretable due to nonspecific CI binding which produced an intermediate range of tether lengths (see ‘Discussion’ section). On the other hand, the frequency of loop formation below 20 nM was so low that statistically significant data could not be collected.
Thermodynamic modeling
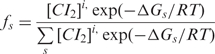
In order to relate the measured loop probabilities to the microscopic configurations of CI bound to the six operator sites, 81 unlooped and 32 looped configurations were considered according to Anderson and Yang (26). The probability for each DNA–protein configuration was expressed as,
 |
1 |
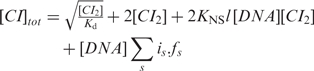
where ΔGs is the sum of the free energies for binding, short-range cooperativity and looping of each configuration and is is the number of bound CI dimers. CI dimer concentration was calculated from the expression for the total concentration of CI:
 |
2 |
where Kd is the dimerization constant for CI (36), KNS is the nonspecific binding constant (37), and l is the DNA length in base pairs (Table 1). The terms of this equation represent: CI monomers, CI dimers, nonspecifically bound and specifically bound CI.
Table 1.
Thermodynamic parameters
| Operator | ▵G (kcal/mol) | Operator | ▵G (kcal/mol) | Parameter (units) | Value |
|---|---|---|---|---|---|
| oL1a | –13.0 | oR1b | –12.5 | ▵GNSd (kcal/mol) | –4.1 |
| oL2a | –11.2 | oR2b | –10.5 | ▵GDe (kcal/mol) | –11.1 |
| oL3 wta (o3−)c | –12.0 (–4.1) | oR3 wtb (o3−)c | –9.5 (–4.1) | [DNA] (M) | <1·10−12 |
| oL1-oL2 coopa | –2.7 | oR1-oR2 coopb | –2.7 | l (bp) | 3477 |
| oL1-oL3 coopa | 0 | oR1-oR3 coopb | 0 | ▵Goctf (kcal/mol) | 1.7 |
| oL2-oL3 coopa | –2.0 | oR2-oR3 coopb | –2.9 | ▵Gtetrf (kcal/mol) | –2.4 |
The table reports the DNA length and the thermodynamic parameters used in the fitting, and the free energy obtained for octamer-mediated loop formation and for subsequent tetramer formation.
aFrom calculations by Anderson and Yang, based on data by Senear et al. (16).
bFrom Koblan and Ackers (15).
cAffinities for the binding to the point-mutated operators o3− (value in parentheses) are set as equal to the nonspecific binding (26,35,37).
eCI dimerization free energy at 200 mM KCl from Koblan and Ackers (36).
fResults of the performed analysis (Figure 3).
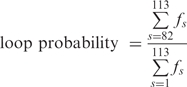
The concentration-dependent loop probability was then calculated as,
 |
3 |
The free energy for each unlooped species was expressed as the sum of all the ΔGs for binding and short-range cooperativity. The free energy expression for the looped species also included the term ΔGoct, and the tetramerization term ΔGtetr was added only for the configuration in which two CI dimers not involved in the octamer were juxtaposed (26). Using this model, the probability of looping was expressed as a function of CI concentration. The experimental data obtained using both wt λ and λo3− DNA were fitted simultaneously to estimate ΔGoct and ΔGtetr using custom Matlab routines based on the fminsearch function.
RESULTS AND DISCUSSION
The motion of several hundred DNA-tethered beads was monitored in the presence of CI concentrations varying from 0 to 170 nM. This titration was performed on two different DNA fragments: the wt λ and the λo3− DNA. λo3− DNA carries double-point mutations in the oL3 and oR3 sequences. These mutations abrogate the binding of CI to both these sites and, therefore, should prevent formation of loops mediated by more than a CI octamer.
In the absence of protein (Figure 3, upper panel) the TPM signal, , was constant. In fact, all unlooped tethers in the absence of protein exhibited a narrow range of extensions as shown in the cumulative histograms for the controls of each condition (Figure 4, gray distributions, and Supplementary Data Figure S4). In the presence of CI the TPM signal transiently dropped to a lower level that corresponded to the effective length of the looped DNA, as expected from a simple length-loss model [see calibration curve, Supplementary Data Figure S2 (29)]. The middle and lower panels of Figure 3 show representative traces recorded at 20 and 80 nM CI along with corresponding histograms. Clearly the stability and probability of loops increased as the concentration of CI increased. These observations were confirmed by the cumulative histograms of all the measurements performed at various CI concentrations (Figure 4, four upper left panels), which display a peak centered on 225 nm, corresponding to the looped DNA. Gaussians fitted to the ‘looped’ peak as well as the control (no protein) peak showed little variations across all experimental conditions (Supplementary Data, Figure S3). In both cases the data lie within 10 nm of the average value, which is within the resolution of TPM (indicated by dotted lines). The peak at 225 nm did not appear using either λoL−oR− DNA in which all six operators were mutated to abrogate CI binding (Figure 4, lower right) or λΔoL DNA in which the oL but not the oR region had been deleted (Figure 4, lower left).
Figure 4 also shows that the distribution of the unlooped state broadened as CI concentration increased and the mean shifted toward smaller values, suggesting that nonspecific CI binding may loop or bend the DNA to shorten the tethers. The probability of formation of a semispecific loop was determined as the probability of nonspecific binding at a distance LNS from the specific operators multiplied by the circularization factor J(LNS). The probability for nonspecific binding is not length dependent, while J can be calculated by means of statistical models (38,39) and shows a maximum for loops of 400–450 bp. Such a loop would only reduce the TPM signal, shifting the distribution maximum to 345 nm. However, two semispecific (or nonspecific) loops would be expected to reduce the corresponding TPM signal to about 325 nm (Supplementary Data, Figure S4). CI binding to both λΔoL and λoL−oR− DNA produces a peak at this value. While interesting from a biophysical point of view, these forms are not expected to be important transcriptionally and are completely distinct from the loop mediated by specifically bound CI. It is also possible that nonspecific and specific binding bend DNA similarly (40), and that bends from multiple, nonspecifically bound CI proteins produce the intermediate signals (currently under investigation). In either case, these forms do not obscure specific looping in our data.
Loops formed in both the wt λ and the λo3− DNA, although less frequently in the latter case (Figure 4, upper four right panels). These observations confirmed that the presence of two operators at oL and oR suffices to permit a low level of loop formation and that the o3 sites shift the equilibrium toward looping. A structural study of CI by Stayrook et al. (25) showed that contact is precluded between a cooperatively bound dimer pair at oR1 and oR2 and an adjacently bound third dimer at oR3 (and analogously for dimers bound at oL1, oL2 and oL3). Therefore, the only apparent means of further stabilization of looping by CI dimers bound at the o3 sites is through head-to-head interactions with the consequent formation of a CI tetramer. The probability of loop formation, calculated as described in the ‘Materials and methods’ section, is reported in Figure 5. The wt λ DNA spent ∼40% of the time in the looped configuration at the lowest CI concentration used (20 nM) and ∼80% of the time at the highest concentration (170 nM). In contrast, the λo3− DNA loop probability was ∼10% at 20 and 40 nM CI and rose to only ∼18% at 170 nM CI (Figures 4 and 5). These values are in agreement with an estimate obtained using EM (12%) on DNA fragments also containing only two pairs of operators (18). A statistical mechanical model, first proposed by Koblan et al. (15) and subsequently extended by Dodd et al.(20) and Anderson and Yang (26), was used to validate the hypothesis that the concentration dependence of loop probability is due to the following two-step mechanism: (i) loop formation via interaction between a pair of CI tetramers bound at the oL and oR region, leading to a loop secured by a CI octamer (with free energy ΔGoct); and (ii) head-to-head interaction, or tetramer formation, between two CI dimers bound to the remaining operators juxtaposed by the DNA loop (with free energy ΔGtetr), which leads to an increase in loop stability (15,16). Using the configurational possibilities described by Anderson and Yang (26), 81 unlooped and 32 looped configurations were considered (see ‘Materials and Methods’ section).
Figure 5.

Loop probability as a function of CI concentration for wt λ (dots) and λo3− DNA (squares). The lines are the result of the global simulation performed as explained in the text. Errors on the fitted parameters have been estimated at 95.4% confidence interval using constant χ2 boundaries as a confidence limit [(45) and Supplementary Data, Figure S5]. χ2 = Σ [(expected – data)/error)2] = 3.02, where expected = expected values of the data; data = experimentally observed value of the data; error = error on the data.
All the experimental data obtained using wt λ or λo3− DNA were fitted simultaneously to estimate ΔGoct and ΔGtetr (Figure 5). Since the two mutations in λo3− DNA abrogate specific CI binding, nonspecific DNA dissociation constants in the millimolar range (35,37) were used to model the o3− operators. The resulting model curve for the wt λ looping probability quickly rises with CI concentration, while the o3− curve derived from the fitting remains near 10% across the range of CI concentrations employed. Remarkably, this fit of the looping titrations for both the wt and the mutant λo3− DNA was obtained with only two free parameters, ΔGoct = 1.7 ± 0.4 kcal/mol and ΔGtetr = –2.4 ± 0.6 kcal/mol. It indicates that the o3 operators are critical for loop stability and their dissociation constants determine loop probability. Notably, the free energy contribution due to the tetramerization reaction is comparable to the value obtained from modeling in vivo transcription assays (–3.0 kcal/mol) (20) and to the values reported for cis DNA-bound dimmer–dimer interaction (–2 to –3 kcal/mol) (16). ΔGoct is higher than the value obtained in the in vivo work by the groups of Dodd and Yang (20,26). This difference is most likely due to the fact that the DNA plasmids used in those measurements were supercoiled, while our DNA tethers were torsionally relaxed (41).
The free energy change associated with the octamer-mediated loop formation can be expressed as the sum of two contributions:
The first term corresponds to the unfavorable free energy change due to bringing the oL and the oR regions in close proximity (entropic cost of looping), while the second is due to the favorable change resulting from protein–protein interactions. The J factor can be calculated knowing just the persistence length (ξ) of DNA and the separation between the two sites (lloop) (38). The loop is 2317-bp long and, in our experimental conditions, ξ = 43 nm (29,42,43). Thus −RT log J equals 10.2 kcal/mol. From this value and the equation above, the free energy change due to the interaction of the two pairs of dimers involved in the octamer-mediated loop was calculated to be ∼–8.5 kcal/mol. This is in good agreement with the free energy change of –9 kcal/mol associated with the interaction of two CI tetramers without DNA, as determined by sedimentation equilibrium experiments (22,24). Hence, while CI is able to octamerize while bound simultaneously to oL and oR, the magnitude of the free energy term from protein–protein interaction is not sufficient to favor loop formation. However, tetramerization between the CI molecules bound to the sites not involved in the octamer-mediated loop (ΔGtetr) lowers the free energy by an additional 2.4 kcal/mol to reverse the sign of the total free energy, rendering loop formation energetically favorable.
In summary, this work provides the first direct evidence that o1 and o2 operators suffice for a low level of CI-mediated looping between oL and oR, which significantly increases when all six operators are functional. This is consistent with a model in which DNA loops mediated by a CI octamer may be further stabilized, in a CI-concentration-dependent manner, by tetramerization of CI bound to a third operator, and strongly supports the idea that the arrangement of λ operators is the minimum required to guarantee robust lysogeny (strong repression of lytic genes) and efficient switching to lysis (repression of pRM) at physiological CI levels. In this view, looping is not an evolutionary decoration, but an epigenetic strategy for efficient transcriptional regulation (44). Since λ is not only a paradigm for transcriptional regulation, but also for genetic networks, the thermodynamic underpinnings of this regulatory loop are important to understand both sensitivity and stability of genetic switches.
SUPPLEMENTARY DATA
Supplementary Data are available at NAR Online.
FUNDING
HFSPO (RGP0050/2002-C to L.F. and S.A.); Emory URC-2006 (to LF); Intramural Research Program of the National Institutes of Health, National Cancer Institute and the Center for Cancer Research (to S.A.). Funding for open access charge: SA's; Intramural Research Program of the National Institutes of Health, National Cancer Institute and the Center for Cancer Research.
Conflict of interest statement. None declared.
Supplementary Material
ACKNOWLEDGEMENTS
We wish to thank Ian Dodd for reading our manuscript and providing many useful comments.
REFERENCES
- 1.Ptashne MCP. A Genetic Switch: Gene Control and Phage Lambda. Cambridge, MA: Cell Press; 1986. p. 1. [Google Scholar]
- 2.Parisien A, Allain B, Zhang J, Mandeville R, Lan CQ. Novel alternatives to antibiotics: bacteriophages, bacterial cell wall hydrolases, and antimicrobial peptides. J. Appl. Microbiol. 2008;104:1–13. doi: 10.1111/j.1365-2672.2007.03498.x. [DOI] [PubMed] [Google Scholar]
- 3.Waehler R, Russell SJ, Curiel DT. Engineering targeted viral vectors for gene therapy. Nat. Rev. Genet. 2007;8:573–587. doi: 10.1038/nrg2141. [DOI] [PMC free article] [PubMed] [Google Scholar]
- 4.Projan S. Phage-inspired antibiotics? Nat. Biotechnol. 2004;22:167–168. doi: 10.1038/nbt0204-167. [DOI] [PubMed] [Google Scholar]
- 5.Barksdal L, Arden SB. Persisting bacteriophage infections, lysogeny, and phage conversions. Annu. Rev. Microbiol. 1974;28:265–299. doi: 10.1146/annurev.mi.28.100174.001405. [DOI] [PubMed] [Google Scholar]
- 6.Boyd EF, Brussow H. Common themes among bacteriophage-encoded virulence factors and diversity among the bacteriophages involved. Trends Microbiol. 2002;10:521–529. doi: 10.1016/s0966-842x(02)02459-9. [DOI] [PubMed] [Google Scholar]
- 7.Wagner PL, Waldor MK. Bacteriophage control of bacterial virulence. Infect. Immun. 2002;70:3985–3993. doi: 10.1128/IAI.70.8.3985-3993.2002. [DOI] [PMC free article] [PubMed] [Google Scholar]
- 8.Wagner PL. In: The Bacteriophages. Calender R, editor. New York: Oxford University Press; 2006. pp. 710–719. [Google Scholar]
- 9.Wagner PL, Livny J, Neely MN, Acheson DWK, Friedman DI, Waldor MK. Bacteriophage control of Shiga toxin 1 production and release by Escherichia coli. Mol. Microbiol. 2002;44:957–970. doi: 10.1046/j.1365-2958.2002.02950.x. [DOI] [PubMed] [Google Scholar]
- 10.Wagner PL, Neely MN, Zhang XP, Acheson DWK, Waldor MK, Friedman DI. Role for a phage promoter in Shiga toxin 2 expression from a pathogenic Escherichia coli strain. J. Bacteriol. 2001;183:2081–2085. doi: 10.1128/JB.183.6.2081-2085.2001. [DOI] [PMC free article] [PubMed] [Google Scholar]
- 11.Bensing BA, Rubens CE, Sullam PM. Genetic loci of Streptococcus mitis that mediate binding to human platelets. Infect. Immun. 2001;69:1373–1380. doi: 10.1128/IAI.69.3.1373-1380.2001. [DOI] [PMC free article] [PubMed] [Google Scholar]
- 12.Bensing BA, Siboo IR, Sullam PM. Proteins PblA and PblB of Streptococcus mitis, which promote binding to human platelets, are encoded within a lysogenic bacteriophage. Infect. Immun. 2001;69:6186–6192. doi: 10.1128/IAI.69.10.6186-6192.2001. [DOI] [PMC free article] [PubMed] [Google Scholar]
- 13.Ptashne M. A Genetic Switch: Phage Lambda Revisited. 3rd edn. Cold Spring Harbor, NY: Cold Spring Harbor Laboratory Press; 2004. pp. 11–29. [Google Scholar]
- 14.Maniatis T, Ptashne M. Multiple Repressor Binding At Operators In Bacteriophage-Lambda — (Nuclease Protection Polynucleotide Sizing Pyrimidine Tracts Supercoils E-Coli) Proc. Natl Acad. Sci. USA. 1973;70:1531–1535. doi: 10.1073/pnas.70.5.1531. [DOI] [PMC free article] [PubMed] [Google Scholar]
- 15.Koblan KS, Ackers GK. Site-specific enthalpic regulation of DNA-transcription at bacteriophage-lambda Or. Biochemistry. 1992;31:57–65. doi: 10.1021/bi00116a010. [DOI] [PubMed] [Google Scholar]
- 16.Senear DF, Brenowitz M, Shea MA, Ackers GK. Energetics of cooperative protein DNA interactions – comparison between quantitative deoxyribonuclease footprint titration and filter binding. Biochemistry. 1986;25:7344–7354. doi: 10.1021/bi00371a016. [DOI] [PubMed] [Google Scholar]
- 17.Meyer BJ, Maurer R, Ptashne M. Gene-regulation at the right operator (Or) of bacteriophage-lambda.2. Or1, Or2, and Or3 - their roles in mediating the effects of repressor and Cro. J. Mol. Biol. 1980;139:163–194. doi: 10.1016/0022-2836(80)90303-4. [DOI] [PubMed] [Google Scholar]
- 18.Revet B, von Wilcken-Bergmann B, Bessert H, Barker A, Muller-Hill B. Four dimers of lambda repressor bound to two suitably spaced pairs of lambda operators form octamers and DNA loops over large distances. Curr. Biol. 1999;9:151–154. doi: 10.1016/s0960-9822(99)80069-4. [DOI] [PubMed] [Google Scholar]
- 19.Dodd IB, Perkins AJ, Tsemitsidis D, Egan JB. Octamerization of lambda CI repressor is needed for effective repression of P-RM and efficient switching from lysogeny. Genes Dev. 2001;15:3013–3022. doi: 10.1101/gad.937301. [DOI] [PMC free article] [PubMed] [Google Scholar]
- 20.Dodd IB, Shearwin KE, Perkins AJ, Burr T, Hochschild A, Egan JB. Cooperativity in long-range gene regulation by the lambda CI repressor. Genes Dev. 2004;18:344–354. doi: 10.1101/gad.1167904. [DOI] [PMC free article] [PubMed] [Google Scholar]
- 21.Svenningsen SL, Costantino N, Court DL, Adhya S. On the role of Cro in lambda prophage induction. Proc. Natl Acad. Sci. USA. 2005;102:4465–4469. doi: 10.1073/pnas.0409839102. [DOI] [PMC free article] [PubMed] [Google Scholar]
- 22.Bandyopadhyay S, Mukhopadhyay C, Roy S. Dimer-dimer interfaces of the lambda-repressor are different in liganded and free states. Biochemistry. 1996;35:5033–5040. doi: 10.1021/bi952123f. [DOI] [PubMed] [Google Scholar]
- 23.Bell CE, Lewis M. Crystal structure of the lambda repressor C-terminal domain octamer. J. Mol. Biol. 2001;314:1127–1136. doi: 10.1006/jmbi.2000.5196. [DOI] [PubMed] [Google Scholar]
- 24.Senear DF, Laue TM, Ross JBA, Waxman E, Eaton S, Rusinova E. The primary self-assembly reaction of bacteriophage-lambda Ci repressor dimers is to octamer. Biochemistry. 1993;32:6179–6189. doi: 10.1021/bi00075a010. [DOI] [PubMed] [Google Scholar]
- 25.Stayrook S, Jaru-Ampornpan P, Ni J, Hochschild A, Lewis M. Crystal structure of the lambda repressor and a model for pairwise cooperative operator binding. Nature. 2008;452:1022–1026. doi: 10.1038/nature06831. [DOI] [PubMed] [Google Scholar]
- 26.Anderson LM, Yang H. DNA looping can enhance lysogenic CI transcription in phage lambda. Proc. Natl Acad. Sci. USA. 2008;105:5827–5832. doi: 10.1073/pnas.0705570105. [DOI] [PMC free article] [PubMed] [Google Scholar]
- 27.Zurla C, Franzini A, Galli G, Dunlap DD, Lewis DEA, Adhya S, Finzi L. Novel tethered particle motion analysis of CI protein-mediated DNA looping in the regulation of bacteriophage lambda. J. Phys.-Condens. Matter. 2006;18:S225–S234. [Google Scholar]
- 28.Finzi L, Gelles J. Measurement of lactose repressor-mediated loop formation and breakdown in single DNA-molecules. Science. 1995;267:378–380. doi: 10.1126/science.7824935. [DOI] [PubMed] [Google Scholar]
- 29.Nelson PC, Zurla C, Brogioli D, Beausang JF, Finzi L, Dunlap D. Tethered particle motion as a diagnostic of DNA tether length. J. Phys. Chem. B. 2006;110:17260–17267. doi: 10.1021/jp0630673. [DOI] [PubMed] [Google Scholar]
- 30.Pouget N, Dennis C, Turlan C, Grigoriev M, Chandler M, Salome L. Single-particle tracking for DNA tether length monitoring. Nucleic Acids Res. 2004;32:e73. doi: 10.1093/nar/gnh073. [DOI] [PMC free article] [PubMed] [Google Scholar]
- 31.Johnson AD, Meyer BJ, Ptashne M. Interactions between DNA-bound repressors govern regulation by the lambda-phage repressor. Proc. Natl Acad. Sci. USA. 1979;76:5061–5065. doi: 10.1073/pnas.76.10.5061. [DOI] [PMC free article] [PubMed] [Google Scholar]
- 32.Maurer R, Meyer BJ, Ptashne M. Gene-regulation at the right operator (Or) of bacteriophage-lambda.1. Or3 and autogenous negative control by repressor. J. Mol. Biol. 1980;139:147–161. doi: 10.1016/0022-2836(80)90302-2. [DOI] [PubMed] [Google Scholar]
- 33.Finzi L, Dunlap D. Single-molecule studies of DNA architectural changes induced by regulatory proteins. Methods Enzymol. 2003;370:369–378. doi: 10.1016/S0076-6879(03)70032-9. [DOI] [PubMed] [Google Scholar]
- 34.Vanzi F, Broggio C, Sacconi L, Pavone FS. Lac repressor hinge flexibility and DNA looping: single molecule kinetics by tethered particle motion. Nucleic Acids Res. 2006;34:3409–3420. doi: 10.1093/nar/gkl393. [DOI] [PMC free article] [PubMed] [Google Scholar]
- 35.Bakk A, Metzler R. In vivo non-specific binding of lambda CI and Cro repressors is significant. FEBS Lett. 2004;563:66–68. doi: 10.1016/S0014-5793(04)00249-2. [DOI] [PubMed] [Google Scholar]
- 36.Koblan KS, Ackers GK. Energetics of subunit dimerization in bacteriophage-lambda CI repressor-linkage to protons, temperature, and KCL. Biochemistry. 1991;30:7817–7821. doi: 10.1021/bi00245a022. [DOI] [PubMed] [Google Scholar]
- 37.Bakk A, Metzler R. Nonspecific binding of the O-R repressors CI and Cro of bacteriophage lambda. J. Theor. Biol. 2004;231:525–533. doi: 10.1016/j.jtbi.2004.07.007. [DOI] [PubMed] [Google Scholar]
- 38.Rippe K. Making contacts on a nucleic acid polymer. Trends Biochem. Sci. 2001;26:733–740. doi: 10.1016/s0968-0004(01)01978-8. [DOI] [PubMed] [Google Scholar]
- 39.Shimada J, Yamakawa H. Ring-closure probabilities for twisted wormlike chains – applications to DNA. Macromolecules. 1984;17:689–698. [Google Scholar]
- 40.Strahs D, Brenowitz M. DNA Conformational-changes associated with the cooperative binding of CI-repressor of bacteriophage-lambda to O-R. J. Mol. Biol. 1994;244:494–510. doi: 10.1006/jmbi.1994.1748. [DOI] [PubMed] [Google Scholar]
- 41.Purohit PK, Nelson PC. Effect of supercoiling on formation of protein-mediated DNA loops. Phys. Rev. E. 2006;74 doi: 10.1103/PhysRevE.74.061907. [DOI] [PubMed] [Google Scholar]
- 42.Strick TR, Croquette V, Bensimon D. Homologous pairing in stretched supercoiled DNA. Proc. Natl Acad. Sci. USA. 1998;95:10579–10583. doi: 10.1073/pnas.95.18.10579. [DOI] [PMC free article] [PubMed] [Google Scholar]
- 43.Wang MD, Yin H, Landick R, Gelles J, Block SM. Stretching DNA with optical tweezers. Biophys. J. 1997;72:1335–1346. doi: 10.1016/S0006-3495(97)78780-0. [DOI] [PMC free article] [PubMed] [Google Scholar]
- 44.Little JW, Shepley DP, Wert DW. Robustness of a gene regulatory circuit. EMBO J. 1999;18:4299–4307. doi: 10.1093/emboj/18.15.4299. [DOI] [PMC free article] [PubMed] [Google Scholar]
- 45.Press WH, Teukolsky SA, Vettering WT, Flannery BP. Numerical Recipes in C. Cambridge, U.K: Cambridge University Press; 1992. pp. 692–694. Chapter 15.6. [Google Scholar]
Associated Data
This section collects any data citations, data availability statements, or supplementary materials included in this article.