Abstract
The robustness of ecosystems to species losses is a central question in ecology, given the current pace of extinctions and the many species threatened by human impacts, including habitat destruction and climate change. Robustness from the perspective of secondary extinctions has been addressed in the context of food webs to consider the complex network of species interactions that underlie responses to perturbations. In-silico removal experiments have examined the structural properties of food webs that enhance or hamper the robustness of ecosystems to species losses, with a focus on the role of hubs, the most connected species. Here we take a different approach and focus on the role of the connections themselves. We show that trophic links can be divided into functional and redundant based on their contribution to robustness. The analysis of empirical webs shows that hubs are not necessarily the most important species as they may hold many redundant links. Furthermore, the fraction of functional connections is high and constant across systems regardless of size and interconnectedness. The main consequence of this scaling pattern is that ecosystem robustness can be considerably reduced by species extinctions even when these do not result in any secondary extinctions. This introduces the possibility of tipping points in the collapse of ecosystems.
Keywords: ecological networks, food webs, extinctions, stability, complexity, robustness
1. Introduction
Understanding and predicting how the structure of ecological networks influences extinction patterns is crucial at this time of rapid loss in biodiversity and associated ecosystems' services (Loreau et al. 2001; Raffaelli 2004; Worm et al. 2006). The relationship between network structure and robustness has been recently addressed by research on scale-free networks in which hubs hold the majority of connections and their removal causes major disruption (Albert et al. 2000; Newman 2003). The same approach has been applied to the extinction of species in food webs (Dunne et al. 2002, 2004; Montoya & Sole 2002; Allesina & Bodini 2004; Ebenman & Jonsson 2005; Allesina et al. 2006; Montoya et al. 2006) and other ecological networks (Memmott et al. 2004), emphasizing the role of the most connected species. Many studies (Dunne et al. 2002, 2004; Montoya & Sole 2002) have concentrated on hubs, implicitly assuming that these are the critical players in maintaining network structure (keystone species, Power et al. 1996; Raffaelli 2004; Zavaleta & Hulvey 2004; Christianou & Ebenman 2005), and therefore, robustness. This view led to the conclusion that food webs with a great number of connections would be more robust than poorly connected ones. Although true on average, this is not always the case (Allesina & Bodini 2004; Allesina et al. 2006). Moreover, the extinction of highly connected species may not be as likely as that of poorly connected ones (Memmott et al. 2004; Srinivasan et al. 2007), and properties other than the number of connections could better measure a species' importance (Melian & Bascompte 2002; Solan et al. 2004; Zavaleta & Hulvey 2004; Ebenman & Jonsson 2005).
All previous studies (Dunne et al. 2002, 2004; Montoya & Sole 2002; Allesina & Bodini 2004; Allesina et al. 2006; Montoya et al. 2006; Srinivasan et al. 2007) share a common approach: they consider how the loss of species cascades into the further loss of biodiversity. The importance of the species is predicted on the basis of their topological properties, especially their number of connections. Robustness, however, is not simply determined by the connectedness of species but also by their ‘effective communication’ in the network of interactions. Connections in food webs transfer energy from one species to another and the full topology of the network determines the fragility of these systems. This view of network robustness finds a correspondence in the early work of MacArthur (1955) when he proposed that higher complexity, intended as a higher number of links, would enhance stability because of the large number of pathways that can be used for the transfer of energy in food webs. More generally, the long-standing question of the relationship between complexity and stability has been one main driver of ecological research (Elton 1958; McCann 2000; Ives & Carpenter 2007). Complexity was initially analysed in relation to the local stability of equilibria (May 1972; Pimm 1982) and, more recently, from the persistence of species (McCann et al. 1998). In these cases, complexity was a source of instability, even when more realistic biological assumptions can mitigate the destabilizing effect (Fagan 1997; McCann et al. 1998; Neutel et al. 2002; Kondoh 2003; Worm & Duffy 2003; Berlow et al. 2004).
In line with MacArthur's hypothesis, we concentrate here on connections and their contribution to robustness. We show that connections can be classified as functional or redundant, based on their positive or null contribution to network robustness. From this perspective, we show that hubs are not necessarily the most critical species in food webs. Empirical food webs contain a very high fraction of functional links that remain remarkably invariant with the number and density of connections and the size of the systems. It follows that ecosystem disturbance should decrease robustness with a high probability, and that even in the complete absence of secondary extinctions, this enhanced fragility should increase the risk of a collapse in biodiversity. Thus, MacArthur's argument applies to food webs from the more general perspective of robustness to secondary extinctions.
Secondary extinction refers here to the loss of a species in response to a previous extinction event. Modelling extinctions in complex food webs are far from trivial. Species losses can result from the dynamics of ecological interactions (e.g. lack of food, competitive exclusion), from stochastic fluctuations (demographic and environmental stochasticity), Allee effects, infectious diseases, genetic effects and so forth. Thus, prediction of secondary extinctions would require detailed knowledge of the system and its dynamics, including functional responses and the values of interaction strengths, genetic features, spatial dynamics, seasonal patterns, etc. All possible models share, however, a subset of extinctions that can be predicted with certainty and with no loss of generality. These extinctions are those triggered by the lack of food items: if a predator has no available prey, it will go extinct. Such bottom-up extinctions are present in all possible models, representing the most predictable subset of secondary losses. Moreover, this type of extinction can be predicted using minimal data: given a binary web (for the presence/absence of links), bottom-up extinctions follow from simple considerations: a predator can persist despite the loss of all its prey only by changing its diet, a behaviour known as predator switching (Kondoh 2003). Predator switching can be easily included in the study of these bottom-up extinctions by considering a food web of potential (as opposed to realized) connections, and examining these ‘potential’ food webs for secondary extinctions. This is not the case for the other types of extinction described above. The study of bottom-up secondary extinctions can therefore identify the minimum expected response (the best-case scenario) to the most extreme type of perturbation, the loss of a species. In other words, bottom-up extinctions provide a baseline to which other, dynamic effects can only add further losses. In particular, all the other causes of extinction listed above can add to, but not subtract from, these bottom-up extinctions. For example, we could examine weighted food webs, in which flows of energy between species are quantified, and consider that a predator that has lost most of its prey could go extinct when the remaining prey provide an insufficient flow of energy (e.g. Allesina et al. 2006). However, even in this case, a predator with no prey will go extinct. In what follows, we show that even when we consider only bottom-up extinctions, the vast majority of connections in food webs contribute to their robustness. Those links that do not, however, could very well be important when we consider other causes of extinction and dynamics in particular.
2. Material and methods
We exploit the properties of generalized multiple dominators, a graph property originally introduced in control flow graph analysis (Gupta 1995; Alstrup et al. 1996, 2000), to assess which connections are functional and which are redundant.
The concept of single-node dominator is as follows: if all the pathways from the primary producers to a given species x contain another node y, then y is a dominator of x. If y goes extinct, so does x: y is a bottleneck in energy delivery from the producers to x. Single-node dominators have been extensively used in computer science (Alstrup et al. 1999) and have been recently introduced in ecology (Allesina & Bodini 2004; Allesina et al. 2006). This concept can be extended to detect sets of nodes that collectively dominate a given node. This is accomplished by using multiple (or generalized) dominators.
The set of prey that collectively dominates a predator x, imdom(x) (containing the immediate multiple-node dominators of x), is the smallest possible set of prey of x so that each pathway from producers to x contains at least one of the prey in imdom(x). Thus, to divide the connections in a food web into functional and redundant, we first find the set of immediate multiple-node dominators for each species v. Then, all the connections from nodes w∈imdom(v) to v are functional, and all others are redundant. In what follows, we characterize imdom(v) using the notation introduced by Alstrup et al. (1996).
A food web G(V,E,r) contains V species connected by E links (or edges) and is rooted in r (i.e. all the primary producers receive energy from the external environment, represented by r). The set of prey that collectively dominates a predator v, which is the set of prey that connects the root to v with independent pathways, is defined as imdom(v). This set satisfies three properties: (i) imdom(v)⊆prey(v): the set is contained in the set of prey of v. (ii) Any path from r to v (r→→v) contains a species w∈imdom(v): there is no way to connect the producers to v bypassing the set of immediate multiple-node dominators. (iii) For each species w∈imdom(v) there is a path r→→w→v that does not contain any other species in imdom(v): the connection w→v represents a new, independent pathway that connects producers to v.
Finding the imdom set for all species can be accomplished with simple algorithms (Alstrup et al. 1996). Once all the sets are found, we can classify all the links w→v,w∈imdom(v) as functional.
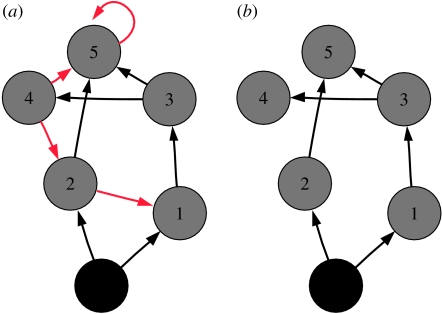
Recalling MacArthur's idea of stability, we can say that robustness depends on how much ‘choice’ energy has on its way up through the food web. Here we argue that this choice of pathways is not simply quantified by the number of connections a species is receiving, as only functional links matter. To interpret the significance of functional and redundant links, we begin with the intuitive relation between robustness and pathways of energy flow. Secondary extinctions occur with certainty when species are left without access to exploitable resources, but not all pathways contribute to prevent this from happening. In figure 1, for example, the top species (5) receives four connections from 2, 3, 4 and 5. Each and every pathway from the producers to 5 must end with one of these links. But some of these pathways are redundant. We can show, for example, that every path from the source of energy (root—in black) to 5 via 4→5 is redundant. In fact, for each possible path from the root to 5 that ends in 4→5 (say R→1→3→4→5), we can find a shorter path that contains a subset of its nodes and which does not contain 4 (e.g. R→1→3→5): 4→5 is redundant. What does this mean in terms of secondary extinctions? The presence or absence of 4 cannot determine the existence of a pathway connecting the root to 5 so that, from the bottom-up perspective adopted in this work, the two networks in figure 1 behave exactly the same. For example, removing species 1 cascades into the extinction of 3 and 4 in both food webs, while the removal of 4 and 5 does not cascade into secondary extinctions. This illustrates that only functional connections do contribute to the robustness to bottom-up secondary extinctions. Note that further simplifications of the food web would make the two networks behave differently. For example, if we delete in the right network the connection 3→5, this would make species 5 go extinct when 2 is absent, while this does not happen in the original food web. Although redundant pathways can be very strong (e.g. 4 could be the preferred prey of 5), they do not contribute to robustness, as predator and prey depend critically on the same species for their survival. As we argue below, however, strong redundant connections could be important when considering other types of extinctions.
Figure 1.
Functional and redundant connections. (a) A hypothetical food web and (b) the network obtained by removing redundant links. The simplified network contains fewer connections but has the same robustness properties than the one on the left. The resulting food web is minimal, in the sense that removing any other connection would decrease robustness.
3. Results
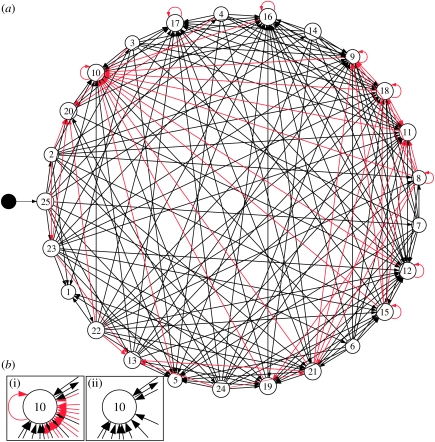
We performed the search for functional and redundant connections in 17 published food webs (see Appendix). Figure 2a shows the results obtained for the St Mark's food web (Christian & Luczkovich 1999), with the redundant and functional connections indicated in red and black, respectively.
Figure 2.
Analysis of the St Mark's food web. (a) The black node is the root of the web. The red links are redundant and can be deleted without affecting the robustness of the food web and the black links are functional. (b(i),(ii)) Functional and redundant connections for species 10. The total number of connections is 22, of which just 11 are functional. Species' importance for robustness should be evaluated using functional connections only, as the total number of connections can be misleading.
We then contrasted the number of functional and redundant connections in empirical networks. To do so, we examined how the number of functional connections varied with the total number of connections. In order to avoid undesirable effects of the different network sizes, we first removed S−1 connections from both quantities (where S is the total number of species in the network). The rationale for doing this is that this quantity represents the minimum number of connections that are required to keep the web connected using a spanning tree. S−1 is therefore the minimum number of functional connections. In such minimal spanning tree, there is just a single path connecting the root to each species. Other connections could either increase (functional) or leave unaltered (redundant) the number of independent pathways. By removing these S−1 ‘essential’ connections, we guarantee the absence of an intercept due to trivial size effects.
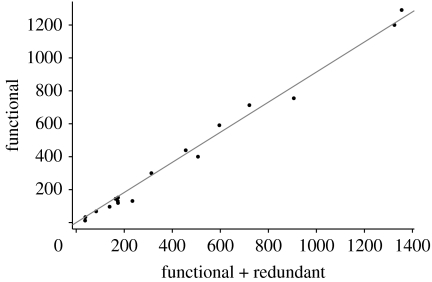
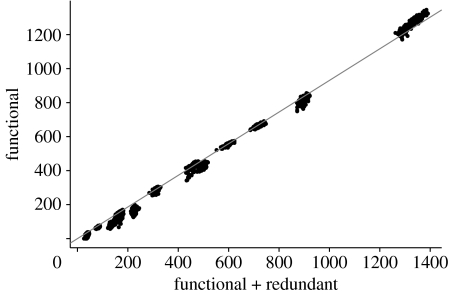
We found a strong linear relationship between the number of functional connections and the total number of connections (figure 3). The correlation between fitted and measured values is 0.995 (Functional−S+1=0.914 (Total−S+1)). In other words, less than 10 per cent of the links can be removed with no loss of robustness. Notably, this pattern is maintained when the same networks are analysed in their species-resolved formulation rather than in their trophospecies aggregated form (Appendix; figure 6). Also, the ‘quality’ of the network appears not to affect the results: the random removal (or addition) of links, simulating sampling errors, gave the same results for the fraction of functional links (Appendix; figure 8). Thus, more than 90 per cent of the connections in natural food webs do matter for robustness to extinction events. Note that this is clearly an underestimate of the fraction of ‘relevant’ links, as only bottom-up extinctions are taken into account in our analysis.
Figure 3.
Number of functional connections as a function of the number of total connections in empirical food web. S−1 has been subtracted from both quantities to remove size effects. The solid line (slope: 0.914; correlation: 0.995) corresponds to the linear regression with no intercept.
Figure 6.
Number of functional connections as a function of the number of connections using unaggregated food webs. S−1 (S is the number of species in the unaggregated version of the food web) has been subtracted from both quantities to remove size effects. The solid line (slope 0.909; correlation: 0.997) corresponds to the linear regression with no intercept.
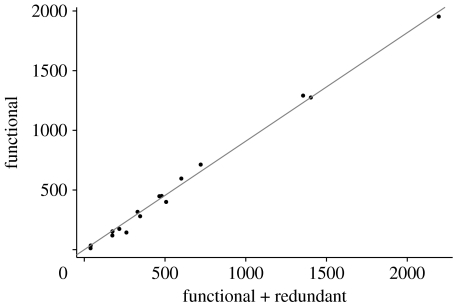
Figure 8.
Number of functional connections as a function of the number of connections using unaggregated food webs. S−1 (S is the number of species in the unaggregated version of the food web) has been subtracted from both quantities to remove size effects. The solid line (slope: 0.931; correlation: 0.999) corresponds to the linear regression with no intercept.
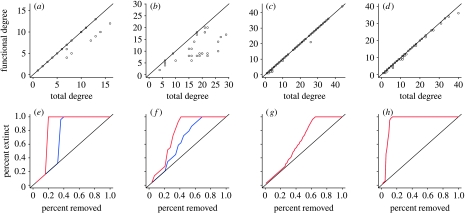
The fact that more than 90 per cent of the connections are functional does not mean that the more connected nodes in the original webs will be the most connected ones in their corresponding simplified version, obtained by removing redundant connections, nor that every species in the simplified web will retain 90 per cent of its original connections. For example, in figure 2b, species 10 has 22 connections but 50 per cent of them are redundant. Whereas a simple criterion for the importance of nodes, and the one typically used in studies of robustness, is their degree (number of connections), only those connections that are functional affect food web robustness. In figure 4 we compare the change in the degree of a node for four webs when all connections are considered, versus the case of excluding those that are redundant. In two cases (figure 4a), the consideration of only functional connections changes the order of the species dramatically, so that the removal of species from the most to the least connected ones gives two different results (figure 4e). In these cases, the real importance of the species was masked by the presence of redundant connections. In the other two (figure 4d), the degree of the species does not change much, with similar extinction plots (figure 4h). These examples emphasize that it is impossible to tell a priori, without identifying the functional links, whether they will be essential or not to determine the importance of species. More generally, we find that the most connected species in the original network is not the most connected in the simplified network, as in figure 4d, for 50 per cent of cases (Appendix; table 2). In these cases, hubs are not the most important species for bottom-up secondary extinctions.
Figure 4.
(a–d) Number of total connections (x axis) and number of functional connections (y axis) for species in four food webs. In two cases, the species with the highest degree when all connections are considered are not the ones holding the largest number of functional connections. In the other two cases, considering only functional connections does not alter dramatically the number of connections for the species. (e–h) This difference is reflected in the behaviour of extinction plots. If one removes the species in a targeted way according to the number of total connections—from most to least connected—the number of total extinctions results in the blue curve. The removal of species according to the number of functional connections yields the red curve, and therefore, larger areas in the first two cases because important species are removed earlier. The real importance of species was masked by the presence of redundant connections. (a,e) Skipwith Pond, (b,f) Coachella Valley, (c,g) Stony Brook and (d,h) Ythan Estuary.
Table 2.
For each food web, we report the fraction of species that, when redundant connections are removed, change their In-Degree (Ch. In, number of incoming connections), Out-Degree (Ch. Out, number of outgoing connections) or their Total Degree (Ch. Tot, total number of connections). We also report if the most connected species in the original network is not the most connected in the simplified food web when the In, Out or Total Degree is considered.
| food web | Ch. In | Ch. Out | Ch. Tot | Ch. Top In | Ch. Top Out | Ch. Top Tot |
|---|---|---|---|---|---|---|
| Benguela | 0.52 | 0.76 | 0.9 | 1 | 0 | 1 |
| Bridge Brook Lake | 0.24 | 0.2 | 0.32 | 1 | 0 | 1 |
| Scotch Broom | 0.14 | 0.16 | 0.22 | 1 | 0 | 0 |
| Canton Creek | 0.04 | 0.04 | 0.07 | 0 | 0 | 0 |
| Chesapeake Bay | 0.06 | 0.16 | 0.19 | 1 | 0 | 0 |
| Coachella Valley | 0.76 | 0.86 | 0.9 | 1 | 0 | 1 |
| El Verde | 0.15 | 0.13 | 0.23 | 1 | 0 | 0 |
| UK Grassland | 0.21 | 0.31 | 0.46 | 0 | 0 | 1 |
| Little Rock Lake | 0.28 | 0.46 | 0.55 | 1 | 0 | 1 |
| Caribbean Reef | 0.52 | 0.8 | 0.82 | 0 | 0 | 1 |
| NE US Shelf | 0.58 | 0.59 | 0.73 | 0 | 1 | 1 |
| Skipwith Pond | 0.56 | 0.72 | 0.8 | 1 | 0 | 1 |
| St Mark's Estuary | 0.29 | 0.19 | 0.38 | 1 | 0 | 0 |
| St Martin Island | 0.24 | 0.26 | 0.43 | 0 | 0 | 0 |
| Stony Stream | 0.04 | 0.06 | 0.07 | 0 | 0 | 0 |
| Ythan Estuary | 0.11 | 0.14 | 0.2 | 0 | 0 | 0 |
| Ythan Estuary w Parasites | 0.09 | 0.11 | 0.17 | 0 | 0 | 0 |
| Averages | 0.28 | 0.35 | 0.44 | 0.53 | 0.06 | 0.47 |
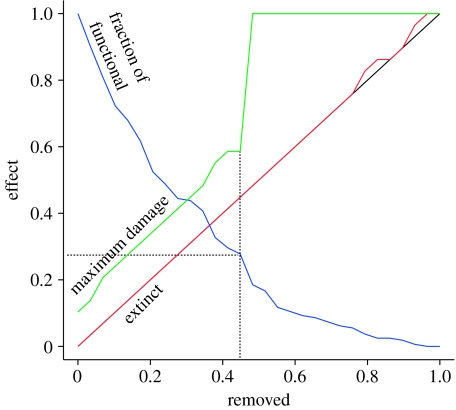
The constant fraction of functional and redundant connections in food webs has important consequences for patterns of ecosystem collapse. Figure 5 shows a removal/extinction plot obtained by removing species in the Coachella Valley food web (Polis 1991) in a random order. The extinction curve (in red) shows no secondary extinctions until a threshold of 75 per cent of species is removed: up to this point, no species goes extinct as a secondary effect. This would be a reassuring sign that the lost species were not critical to ecosystem structure. A deeper analysis shows, however, that there is no reason for optimism. The fraction of functional connections remaining after the removals decreases sharply. With 20 per cent of the species removed, more than 50 per cent of the functional connections have been lost. The consequences for network robustness are even more striking. The maximum possible damage we can cause to the network at each step with a targeted attack is obtained using single-node dominators (green curve; Allesina & Bodini 2004; Allesina et al. 2006). This damage is quantified as the fraction of species that would go extinct if we were to remove the most critical node in the network. As the curve shows, the network becomes increasingly fragile, to the point that with less than 50 per cent nodes being lost, a single targeted removal can cascade into the loss of all species.
Figure 5.
Effect of species removal on secondary extinctions. The red curve represents one extinction scenario resulting from a random sequence of extinctions. The overlap with the diagonal up to 75 per cent of the nodes being removed indicates that up to that point, there have been no secondary extinctions. The number of species decreases only because of species removal (linear decrease in species), but the fraction of remaining functional connections decreases very rapidly (blue), and therefore, so does robustness. The green curve represents the maximum damage that a single extinction can cause to the network, obtained by the targeted removal of the most critical node. After 45 per cent of the species have been removed, a single loss can cause the extinction of all the remaining species.
4. Discussion
Recent studies on food web fragility have focused on the number of secondary extinctions expected after a single species removal or a sequence of losses (Dunne et al. 2002, 2004; Montoya & Sole 2002; Montoya et al. 2006; Srinivasan et al. 2007). This is a node-oriented approach to secondary extinctions in which the loss of nodes subtracts connections from the food web, increasing the likelihood of further extinctions. Here we have shown that not all connections contribute to robustness. Only functional connections matter; redundant ones can be removed without altering food web robustness.
Redundant and functional connections have a clear ecological interpretation when translating the algorithm in ecological terms. A connection is redundant if it connects a given prey, say x, with a predator that also preys upon species that are direct or indirect prey of x itself. Therefore, redundant connections are related to the concept of omnivory (Williams & Martinez 2004) since omnivorous predators are those that apportion their diets to different trophic levels. Figure 1 provides an example of this type of omnivory. Species 5 preys upon 4 and 3; the latter is also a prey of 4: thus, 5 is an omnivore. The connection 4→5, from the predator to its higher level prey, is redundant, and so are all the connections of this type. Furthermore, other trophic relations can be reduced to this case of omnivory: for example, cannibalism implies that species 5 preys upon itself and its prey. Therefore, every cannibal link is also redundant. In the same way, intra-guild predation connections can be redundant (e.g. 2→1 in figure 1). The consequence of this pattern is that higher trophic level species are likely to receive redundant connections, while lower trophic species are often at the source of redundant connections (figure 1).
The role of omnivory is a highly debated and controversial issue in food web ecology. Whereas local stability analyses suggested that omnivory would destabilize communities (Pimm & Lawton 1978; Pimm 1982), more recent theoretical models based on nonlinear dynamics have shown that omnivory can stabilize food webs (Fagan 1997; McCann & Hastings 1997; Borrvall et al. 2000; Emmerson & Yearsley 2004). To complicate matters, the stabilizing role of omnivory can depend on interaction strengths (Vandermeer 2006). We have shown here that a particular type of omnivory, the one that develops within the same trophic chain, does not contribute to food web robustness. This type of omnivory accounts for less than 10 per cent of the links in each of the food webs. However, even when these links could be severed with no consequences from the bottom-up perspective, they could still contribute to robustness to other types of extinctions, given the results in the literature on the stabilizing role of omnivory. If this were indeed the case, it would imply that almost any disturbance to the network connections would hamper its robustness. To test this hypothesis, we would need a general framework for extinctions in food webs. Although we have shown here that the analysis from a bottom-up perspective can be carried out with minimal data in a complete and general way, no such simple solution exists for evaluating other types of extinctions.
Our findings strongly support MacArthur's argument from the perspective of network robustness: the presence of multiple independent pathways from primary producers to top predators enhances food web robustness to species extinction. This argument takes special relevance in light of our findings on the high fraction of functional links in empirical food webs and on their invariance with system size. In all the examined webs, more that 90 per cent of the connections do contribute to enhance food web robustness. The fact that the redundant connections are concentrated in a few species and absent in others questions the relevance of the most connected species as the criterion for importance to secondary extinctions. Finally, we have shown that even when secondary extinctions are not observed, the loss of species will make ecosystems more fragile to further extinctions. This sobering message underscores the possibility of surprises and tipping points in the collapse of ecological networks.
Acknowledgments
The Center for the Study of Complex Systems at the University of Michigan provided computational resources. This work was supported by a Centennial Fellowship of the James S. McDonnell Foundation to M.P.
Appendix
We report the number of connections that are functional and redundant for all food webs together with summary statistics in table 1.
Table 1.
For each food web, we report the number of trophospecies S (in parentheses the number of species before aggregation in trophospecies), the total number of connections (in parentheses the original value), the number of functional and redundant connections. C is the connection in the trophospecies and original version of the food web.
| food web | S | connections | functional | redundant | C | reference |
|---|---|---|---|---|---|---|
| Benguela | 29 (29) | 202 (202) | 147 (147) | 55 (55) | 0.24 (0.24) | Yodzis (1988) |
| Bridge Brook Lake | 25 (75) | 107 (553) | 92 (524) | 15 (29) | 0.171 (0.098) | Havens (1992) |
| Scotch Broom | 85 (154) | 223 (370) | 180 (327) | 43 (43) | 0.031 (0.016) | Memmott et al. (2000) |
| Canton Creek | 102 (108) | 697 (708) | 692 (703) | 5 (5) | 0.067 (0.061) | Townsend et al. (1998) |
| Chesapeake Bay | 31 (33) | 68 (72) | 63 (67) | 5 (5) | 0.071 (0.066) | Baird & Ulanowicz (1989) |
| Coachella Valley | 29 (30) | 262 (290) | 159 (173) | 103 (117) | 0.312 (0.322) | Polis (1991) |
| El Verde | 155 (156) | 1509 (1510) | 1445 (1446) | 64 (64) | 0.063 (0.062) | Waide & Reagan (1996) |
| UK Grassland | 61 (75) | 97 (113) | 72 (86) | 25 (27) | 0.026 (0.02) | Martinez et al. (1999) |
| Little Rock Lake | 92 (181) | 997 (2375) | 846 (2133) | 151 (242) | 0.118 (0.072) | Martinez (1991) |
| Caribbean Reef | 50 (50) | 556 (556) | 449 (449) | 107 (107) | 0.222 (0.222) | Optiz (1996) |
| NE US Shelf | 79 (81) | 1403 (1483) | 1278 (1355) | 125 (128) | 0.225 (0.226) | Link (2002) |
| Skipwith Pond | 25 (35) | 197 (380) | 154 (314) | 43 (66) | 0.315 (0.31) | Warren (1989) |
| St Mark's Estuary | 48 (48) | 221 (221) | 199 (199) | 22 (22) | 0.096 (0.096) | Christian & Luczkovich (1999) |
| St Martin Island | 42 (44) | 205 (218) | 185 (197) | 20 (21) | 0.116 (0.113) | Goldwasser & Roughgarden (1993) |
| Stony Stream | 109 (112) | 829 (832) | 821 (824) | 8 (8) | 0.07 (0.066) | Townsend et al. (1998) |
| Ythan Estuary | 83 (92) | 395 (421) | 382 (408) | 13 (13) | 0.057 (0.05) | Hall & Raffaelli (1991) |
| Ythan Estuary w Par. | 124 (134) | 579 (598) | 562 (581) | 17 (17) | 0.038 (0.033) | Huxham et al. (1996) |
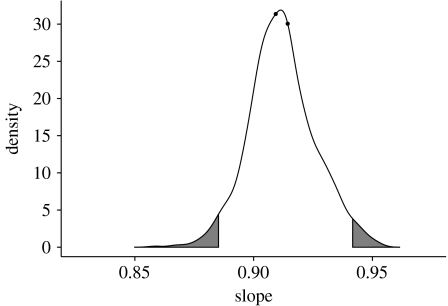
We repeated the analysis using the non-aggregated version of the food webs (table 1, figure 6). We found a small variation in the slope for the regression with no intercept (slope 0.909; it is 0.914 for the aggregated version). To test if the difference between the two slopes was significant, we pooled the two sets of values and sampled repeatedly the resulting set extracting 17 pairs of values without replacement (permutation test). We constructed in this way 1000 randomized datasets. We then found the best fitting slope for each set, obtaining a distribution for the slope values. The resulting distribution is represented in figures 7 and 8. In the figure, the shaded parts represent the 2.5 per cent tails. We see that the slopes measured for the aggregated and unaggregated versions of the food webs are very close in the distribution, so that we cannot reject the null hypothesis of a common slope.
Figure 7.
Results of the permutation test for the common slope of the two datasets. The values of the slopes obtained for the unaggregated and aggregated version of the food webs are represented by the solid dots. The curve has been obtained sampling 1000 times 17 pairs of values without repetition from the dataset obtained by pooling the values for the aggregated and original version of the food webs. The 2.5 per cent tails are shaded.
To further test the robustness of the results to changes in the data, we performed the following sensitivity analysis. Using the trophospecies aggregated network, we removed each link with probability 0.1 and we added randomly links with probability 0.1C (connectance of the food web). In this way, we distorted the data simulating sampling errors and varying sampling effort. We built 100 networks for each original food web. We then run the analysis and found a very similar slope (0.931) and a very strong correlation between the fitted and the original data (0.999; figure 8).
To test whether the removal of redundant connections changes simple metrics of species importance, we measure how many species hold redundant incoming, outgoing or total redundant connections (table 2). We see that on average 28 per cent of the species have incoming redundant connections, while 35 per cent have redundant outgoing connections and 44 per cent have either incoming or outgoing redundant connections. A simple measure of species importance is represented by the total number of connections (Dunne et al. 2002; Montoya & Sole 2002). When we simplify the food webs, we see that in 47 per cent of the cases the most connected species is not the same that in the original network: the redundant connections are masking the species holding the majority of functional connections, which are the only important ones for food web robustness. Interestingly, when we look for the species with the highest number of outgoing connections, we see that the most connected species remains the same in the simplified web in 94 per cent of cases, compared with the 47 per cent obtained by checking only the incoming connections.
Footnotes
One contribution of 15 to a Theme Issue ‘Food-web assembly and collapse: mathematical models and implications for conservation’.
References
- Albert R., Jeong H., Barabasi A.-L. Error and attack tolerance of complex networks. Nature. 2000;406:378–382. doi: 10.1038/35019019. doi:10.1038/35019019 [DOI] [PubMed] [Google Scholar]
- Allesina S., Bodini A. Who dominates whom in the ecosystem? Energy flow bottlenecks and cascading extinctions. J. Theor. Biol. 2004;230:351–358. doi: 10.1016/j.jtbi.2004.05.009. doi:10.1016/j.jtbi.2004.05.009 [DOI] [PubMed] [Google Scholar]
- Allesina S., Bodini A., Bondavalli C. Secondary extinctions in ecological networks: bottlenecks unveiled. Ecol. Model. 2006;194:150–161. doi:10.1016/j.ecolmodel.2005.10.016 [Google Scholar]
- Alstrup S., Clausen J., Jorgensen K. An O(|v|×|e|) algorithm for finding immediate multiple-vertex dominators. Infor. Proc. Lett. 1996;59:9–11. doi:10.1016/0020-0190(96)00085-3 [Google Scholar]
- Alstrup S., Harel D., Lauridsen W., Thorup M. Dominators in linear time. SIAM J. Comp. 1999;28:2117–2132. doi:10.1137/S0097539797317263 [Google Scholar]
- Alstrup S., Lauridsen P., Thorup M. Generalized dominators for structured programs. Algorithmica. 2000;27:244–253. doi:10.1007/s004530010018 [Google Scholar]
- Baird D., Ulanowicz R.E. The seasonal dynamics of the Chesapeake Bay ecosystem. Ecol. Monogr. 1989;59:329–364. doi:10.2307/1943071 [Google Scholar]
- Berlow L., et al. Interaction strengths in food webs: issues and opportunities. J. Anim. Ecol. 2004;73:585–598. doi:10.1111/j.0021-8790.2004.00833.x [Google Scholar]
- Borrvall C., Ebenman B., Jonsson T. Biodiversity lessens the risk of cascading extinction in model food webs. Ecol. Lett. 2000;3:131–136. doi:10.1046/j.1461-0248.2000.00130.x [Google Scholar]
- Christian R.R., Luczkovich J. Organizing and understanding a winter's seagrass foodweb network through effective trophic levels. Ecol. Model. 1999;117:99–124. doi:10.1016/S0304-3800(99)00022-8 [Google Scholar]
- Christianou M., Ebenman B. Keystone species and vulnerable species in ecological communities: strong or weak interactors? J. Theor. Biol. 2005;235:95–103. doi: 10.1016/j.jtbi.2004.12.022. doi:10.1016/j.jtbi.2004.12.022 [DOI] [PubMed] [Google Scholar]
- Dunne J., Williams R., Martinez N. Network structure and biodiversity loss in food webs: robustness increases with connectance. Ecol. Lett. 2002;5:558–567. doi:10.1046/j.1461-0248.2002.00354.x [Google Scholar]
- Dunne J., Williams R., Martinez N. Network structure and robustness of marine food webs. Mar. Ecol. Prog. Ser. 2004;273:291–302. doi:10.3354/meps273291 [Google Scholar]
- Ebenman B., Jonsson T. Using community viability analysis to identify fragile systems and keystone species. Trends Ecol. Evol. 2005;20:568–575. doi: 10.1016/j.tree.2005.06.011. doi:10.1016/j.tree.2005.06.011 [DOI] [PubMed] [Google Scholar]
- Elton C. Chapman & Hall; London, UK: 1958. Ecology of invasions by animals and plants. [Google Scholar]
- Emmerson M., Yearsley J. Weak interactions, omnivory and emergent food-web properties. Proc. R. Soc. B. 2004;271:397–405. doi: 10.1098/rspb.2003.2592. doi:10.1098/rspb.2003.2592 [DOI] [PMC free article] [PubMed] [Google Scholar]
- Fagan F. Omnivory as a stabilizing feature of natural communities. Am. Nat. 1997;150:554–567. doi: 10.1086/286081. doi:10.1086/286081 [DOI] [PubMed] [Google Scholar]
- Goldwasser L., Roughgarden J. Construction of a large Caribbean food web. Ecology. 1993;74:1216–1233. doi:10.2307/1940492 [Google Scholar]
- Gupta R. Generalized dominators. Inform. Proc. Lett. 1995;53:193–200. doi:10.1016/0020-0190(94)00192-2 [Google Scholar]
- Hall S., Raffaelli D. Food-web patterns: lessons from a species rich web. J. Anim. Ecol. 1991;60:823–842. doi:10.2307/5416 [Google Scholar]
- Havens K. Scale and structure in natural food webs. Science. 1992;257:1107–1109. doi: 10.1126/science.257.5073.1107. doi:10.1126/science.257.5073.1107 [DOI] [PubMed] [Google Scholar]
- Huxham M., Beany S., Raffaelli D. Do parasites reduce the chances of triangulation in a real food web? Oikos. 1996;76:284–300. doi:10.2307/3546201 [Google Scholar]
- Ives A.R., Carpenter S.R. Stability and diversity of ecosystems. Science. 2007;317:58–62. doi: 10.1126/science.1133258. doi:10.1126/science.1133258 [DOI] [PubMed] [Google Scholar]
- Kondoh M. Foraging adaptation and the relationship between food-web complexity and stability. Science. 2003;299:1388–1391. doi: 10.1126/science.1079154. doi:10.1126/science.1079154 [DOI] [PubMed] [Google Scholar]
- Link J. Does food web theory work for marine ecosystems? Mar. Ecol. Prog. Ser. 2002;230:1–9. doi:10.3354/meps230001 [Google Scholar]
- Loreau M., et al. Biodiversity and ecosystem functioning: current knowledge and future challenges. Science. 2001;294:804–808. doi: 10.1126/science.1064088. doi:10.1126/science.1064088 [DOI] [PubMed] [Google Scholar]
- MacArthur R. Fluctuations of animal populations, and a measure of community stability. Ecology. 1955;36:533–536. doi:10.2307/1929601 [Google Scholar]
- Martinez N.D. Artifacts or attributes—effects of resolution on the little-rock lake food web. Ecol. Monogr. 1991;61:367–392. doi:10.2307/2937047 [Google Scholar]
- Martinez N.D., Hawkins B.A., Dawah H.A., Feifarek B.P. Effects of sampling effort on characterization of food-web structure. Ecology. 1999;80:1044–1055. doi:10.2307/177037 [Google Scholar]
- May R.M. Will a large complex system be stable? Nature. 1972;238:413–414. doi: 10.1038/238413a0. doi:10.1038/238413a0 [DOI] [PubMed] [Google Scholar]
- McCann K., Hastings A. Re-evaluating the omnivory–stability relationship in food webs. Proc. R. Soc. B. 1997;264:1249–1254. doi:10.1098/rspb.1997.0172 [Google Scholar]
- McCann K., Hastings A., Huxel R. Weak trophic interactions and the balance of nature. Nature. 1998;395:794–798. doi:10.1038/27427 [Google Scholar]
- McCann S. The diversity-stability debate. Nature. 2000;405:228–233. doi: 10.1038/35012234. doi:10.1038/35012234 [DOI] [PubMed] [Google Scholar]
- Melian C., Bascompte J. Complex networks: two ways to be robust? Ecol. Lett. 2002;5:705–708. doi:10.1046/j.1461-0248.2002.00386.x [Google Scholar]
- Memmott J., Martinez N.D., Cohen J.E. Predators, parasitoids and pathogens: species richness, trophic generality and body sizes in a natural food web. J. Anim. Ecol. 2000;69:1–15. doi:10.1046/j.1365-2656.2000.00367.x [Google Scholar]
- Memmott J., Waser N., Price M. Tolerance of pollination networks to species extinctions. Proc. R. Soc. B. 2004;271:2605–2611. doi: 10.1098/rspb.2004.2909. doi:10.1098/rspb.2004.2909 [DOI] [PMC free article] [PubMed] [Google Scholar]
- Montoya J., Sole R. Small world patterns in food webs. J. Theor. Biol. 2002;214:405–412. doi: 10.1006/jtbi.2001.2460. doi:10.1006/jtbi.2001.2460 [DOI] [PubMed] [Google Scholar]
- Montoya J., Pimm S., Sole R. Ecological networks and their fragility. Nature. 2006;442:259–264. doi: 10.1038/nature04927. doi:10.1038/nature04927 [DOI] [PubMed] [Google Scholar]
- Neutel A., Heesterbeek A.P., De Ruiter C. Stability in real food webs: weak links in long loops. Science. 2002;296:1120–1123. doi: 10.1126/science.1068326. doi:10.1126/science.1068326 [DOI] [PubMed] [Google Scholar]
- Newman M.E.J. The structure and function of complex networks. SIAM Rev. 2003;45:167–256. doi:10.1137/S003614450342480 [Google Scholar]
- Optiz, S. 1996 Trophic interactions in caribbean coral reefs. Technical Report 43, ICLARM, Manila.
- Pimm L., Lawton H. On feeding on more than one trophic level. Nature. 1978;275:542–544. doi:10.1038/275542a0 [Google Scholar]
- Pimm S. Chapman & Hall; New York, NY: 1982. Food webs. [Google Scholar]
- Polis G. Complex trophic interactions in deserts: an empirical critique of food-web theory. Am. Nat. 1991;138:123–155. doi:10.1086/285208 [Google Scholar]
- Power M., et al. Challenges in the quest for keystones. BioScience. 1996;46:609–620. doi:10.2307/1312990 [Google Scholar]
- Raffaelli D. How extinction patterns affect ecosystems. Science. 2004;306:1141–1142. doi: 10.1126/science.1106365. doi:10.1126/science.1106365 [DOI] [PubMed] [Google Scholar]
- Solan M., Cardinale B., Downing A., Engelhardt K., Ruesink J., Srivastava D. Extinction and ecosystem function in the marine benthos. Science. 2004;306:1177–1180. doi: 10.1126/science.1103960. doi:10.1126/science.1103960 [DOI] [PubMed] [Google Scholar]
- Srinivasan U., Dunne J., Harte J., Martinez N. Response of complex food webs to realistic extinction sequences. Ecology. 2007;88:671–682. doi: 10.1890/06-0971. doi:10.1890/06-0971 [DOI] [PubMed] [Google Scholar]
- Townsend C., Thompson R., McIntosh A., Kilroy C., Edwards E., Scarsbrook M. Disturbance, resource supply, and food-web architecture in streams. Ecol. Lett. 1998;1:200–209. doi:10.1046/j.1461-0248.1998.00039.x [Google Scholar]
- Vandermeer J. Omnivory and the stability of food webs. J. Theor. Biol. 2006;238:497–504. doi: 10.1016/j.jtbi.2005.06.006. doi:10.1016/j.jtbi.2005.06.006 [DOI] [PubMed] [Google Scholar]
- Waide R., Reagan W., editors. The food web of a tropical rainforest. University of Chicago Press; Chicago, IL: 1996. [Google Scholar]
- Warren P. Spatial and temporal variation in the structure of a freshwater food web. Oikos. 1989;55:299–311. doi:10.2307/3565588 [Google Scholar]
- Williams R., Martinez N. Limits to trophic levels and omnivory in complex food webs: theory and data. Am. Nat. 2004;163:458–468. doi: 10.1086/381964. doi:10.1086/381964 [DOI] [PubMed] [Google Scholar]
- Worm B., Duffy E. Biodiversity, productivity and stability in real food webs. Trends Ecol. Evol. 2003;18:628–632. doi:10.1016/j.tree.2003.09.003 [Google Scholar]
- Worm B., et al. Impacts of biodiversity loss on ocean ecosystem services. Science. 2006;314:787–790. doi: 10.1126/science.1132294. doi:10.1126/science.1132294 [DOI] [PubMed] [Google Scholar]
- Yodzis P. Local trophodynamics and the interaction of marine mammals and fisheries in the Benguela ecosystem. J. Anim. Ecol. 1998;67:635–658. doi:10.1046/j.1365-2656.1998.00224.x [Google Scholar]
- Zavaleta E., Hulvey K. Realistic species losses disproportionately reduce grassland resistance to biological invaders. Science. 2004;306:1175–1177. doi: 10.1126/science.1102643. doi:10.1126/science.1102643 [DOI] [PubMed] [Google Scholar]


