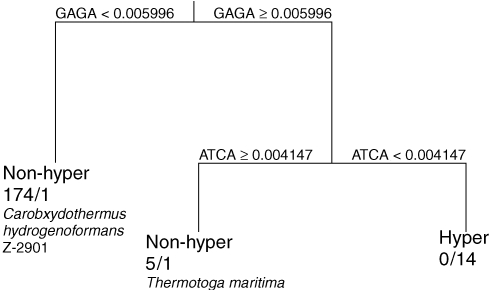
Figure 1.
Classification tree of hyperthermophile (hyper) versus non-hyperthermophile (non-hyper) based on tetramer relative frequencies of 195 genomes. Each split shows the tetramer selected by CART for each level of classification and the relative frequencies for each direction. Nodes show the classified temperature range and number of organisms classified in each temperature category according to NCBI (non-hyper/hyper). Organisms misclassified in this model are listed under the appropriate nodes.

