

Abstract
Prism (Protein Interactions by Structural Matching) is a system which employs a novel prediction algorithm for protein-protein interactions. It adopts a bottom-up approach that combines structure and sequence conservation in protein interfaces. The algorithm seeks possible binary interactions between proteins through the structure similarity and evolutionary conservation of known interfaces. It is composed of a database holding protein interface structures derived from the Protein Data Bank (PDB) and predicted protein-protein interactions. It also provides related information about the proteins, and an interactive protein interface viewer. In the current version, 3799 structurally non-redundant interfaces are used to predict the interactions among 6170 proteins. A substantial number of interactions are verified in two publicly available interaction databases (DIP and BIND). As the verified interactions demonstrate the suitability of our approach, unverified ones may point to undiscovered interactions.
Prism can be accessed through a user friendly web site (http://prism.ccbb.ku.edu.tr) and it is planned to be updated regularly as new protein structures become available in the PDB. Users may browse through the non-redundant dataset of representative interfaces which the prediction algorithm depends on, retrieve the list of similar structures to these interfaces, or see the results of interaction predictions for a particular protein. Another service provided is the interactive prediction. This is done by running the algorithm for the user input structures.
Keywords: Protein interactions, protein interaction prediction, protein interfaces, protein databases
1. Introduction
Molecular and cellular operations are largely carried out by interactions between proteins. Interactions are physical associations of protein structures through weak, non-covalent bonds. Two proteins interact through particular regions on their surfaces, called binding sites, or interfaces. Identifying protein binding sites and knowing which proteins interact with which others are crucial for a better understanding of the bases of many biological processes. Despite the ongoing effort to decipher the complex nature of protein interactions, they are not still entirely understood (1-5). Protein binding sites have been thoroughly analyzed for the presence of certain physico-chemical and geometric properties that can be used to distinguish these regions from the non-interacting surface regions. Notable differences have been found both in the chemical composition and geometric properties of these sites (6-10). Almost a decade ago, Wells and his colleagues have discovered the existence of ‘energy hot spots’, that is, residues that contribute significantly (over 2 Kcal/mol) to the binding free energy (11). These residues have been identified through alanine scanning mutagenesis. Subsequently, computational methods have been developed to predict these residues. In a landmark paper, Bogan and Thorn (1) have proposed that hot spots are surrounded by what they called ‘O-rings’. These are hydrophobic regions which may serve to exclude water from the hot spot residue. Combined, binding sites have been described by amino acids that interact across the two-chain interface. However, not all amino acids contribute equally. Some contribute marginally or not at all (12). On the other hand, a few others dominate the stability of the complex. These hot spot residues were observed to correlate with structurally conserved residues (13,14). Prediction of binding sites using these specific properties can be used for improving docking algorithms. Besides the experimental methods for detecting and analyzing the protein-protein interactions (7,15,16), computational approaches are becoming increasingly important venues as large amounts of data become available. Development of predictive methods is a major goal in computational biology that will lead to protein engineering and drug discovery (9,10,17). Structural classification of protein interfaces gives insights about the possible ways proteins may interact (18,19). Hence, an efficient computational technique with acceptable error rates that can be utilized to predict the binding sites and binding partners in proteins will surely be of great aid (20-22).
We present Prism (Protein Interactions by Structural Matching), a system incorporating a novel protein-protein interaction algorithm (20,23) and a web-server that can be used to explore protein interfaces and predict protein-protein interactions. Our algorithm principally seeks for pairs of proteins that may potentially interact in a dataset of protein structures (target dataset) by comparing them with a dataset of interfaces (template dataset), which is a structurally and evolutionary representative subset of biological and crystal interactions present in the Protein Data Bank (PDB) (24). If, after comparisons, two target structures are found to structurally and evolutionarily complement each other as chains of any template interface do, they qualify as a potentially interacting pair. Thus, a list of potentially interacting protein pairs is obtained as a final result. Prism consists of a web interface to the dataset of our interface dataset and target structures including a summary of the proteins the interface belongs to (with cross references to other biological databases where available), similarity matching results, solvent accessible surface area calculation results on a residue level scale, interface visualization on the protein using both static images and an interactive interface viewer implemented using a browser plug-in.
2. Materials
The rationale of our protein-protein prediction algorithm is that, if any two structures contain particular regions on their surfaces that resemble the complementary partners of a known interface, they “possibly interact”, through these regions. In other words, if protein A is known to interact with protein B, and A' shares similarity with the binding site of A, B' shares similarity with the binding site of B, then we predict that interacts A' with B'. This resemblance indicates the ability of these structures to structurally and evolutionarily complement each other along an interface, as chains of any template interface might do. The algorithm requires a “template” dataset, i.e. the representative dataset of “available” interfaces; and a “target” dataset, to seek every potential binary interaction between its members (20).
2.1 Interface Dataset
This dataset contains a structurally non-redundant dataset of protein-protein interfaces. Interfaces consist of interacting residues between the two polypeptide chains (of a complex protein), and those residues which are in their spatial vicinity (neighboring residues), representing the scaffold of the interface. Two residues from the opposite chains were marked as interacting, if there was at least a pair of atoms, one from each residue, at a distance smaller than the sum of their van der Waals radii plus a threshold of 0.5 Å. If the C-α of a noninteracting residue lay at a distance of at most 6.0 Å from a C-α of an already assigned interface residue in the same chain, it was marked as a neighboring residue. All interfaces between two protein chains obtained from higher complexes of proteins available in PDB were extracted (18) resulting in 21,684 two-chain interfaces. These interfaces were clustered structurally using a structural alignment in a sequence order-independent way (25). At the end of the iterative structural clustering procedure, 3,799 interface clusters were obtained. Each cluster includes a representative interface structure and members similar to the representative interface.
2.2 Template Interface Dataset
Evolutionary conservation of certain residues at protein interfaces is a strong characteristic of binding sites. Ma et al. (26) reported that particular residues are conserved on structurally similar interfaces. Moreover, they found that these conserved residues were highly correlated with polar residue hotspots, residues that are more important than others defining affinity and stability of an interaction. Therefore, the interface dataset was further filtered using a dataset of computational hotspots. Computational hotspots are the critical residues for binding on representative interfaces. The members of the 3,799 interface clusters were processed by a filtering process which eliminated the redundant sequences from the clusters. A cluster was defined to be non-redundant if it contained at least five non-homologous sequences. Then, simultaneous structural alignments among the non-homologous members of each cluster were performed (27). If a residue was conserved at a particular spot among interfaces of similar architectures with a frequency of 50% or more, it was flagged as a computational hot spot (13). As a result, we could detect the hot spots of 67 clusters out of 3,799 since most of the clusters could not pass the non-homologous filtering. The prediction algorithm serviced by Prism uses only these 67 template interfaces for similarity matching. Hence, Prism considers both shape complementarities and evolutionary conservation while searching for binding sites on the surface of a target protein.
2.3 Target Dataset
This dataset is a sequentially non-redundant subset (with a sequence identity upper limit of 50%) of all the polypeptide chains and complexes existing in the PDB. Every pair of member structures in this dataset is checked for potential interactions. The protein chains may be in the form of monomers or in the form of isolated chains from multimeric complexes. As of January 27, 2004; the target dataset contains 6,170 structures (20). The generation of this dataset is a two step process. The first is a preprocessing step that involves downloading of the set of proteins obtained by applying a sequence identity filter of 50% to all existing protein structures in the PDB. This resulted in a list containing 5,427 proteins. Then, the multimeric proteins are split into constituent chains where homologous chains are counted only once, the target dataset consists of 6,170 structures. 1,981 of these are multimeric and 4,189 are monomeric. Of the monomeric structures, 2,483 are derived from complexes. All these structures are on our web as “Target Structure Dataset”.
3. Methods
This section describes the algorithm to infer novel protein-protein interactions using the shape complementarities and conservation in protein interfaces. A web server that allows one to search the interface, target datasets, and the predicted interactions is presented as well. The web server also allows one to run the algorithm on a new target protein that is not in our target database.
3.1 Protein-protein Interaction Prediction
The prediction algorithm is based on searching pairs of proteins that share structure and conserved residue (hotspot) similarity to our known interface template data. First, we extract surfaces of target proteins and perform successive structural alignments between these surfaces and the partner chains of interfaces in the template interface dataset, in an all-against-all manner. If surfaces of two target proteins (A and B) contain regions similar to complementary partner chains of a template interface I, in other words, one side of the interface I is similar to target A and the other side is similar to target B, then we say A and B may interact through these similar regions (or through interface I). Fig 1 shows the top level pseudo code and the schematic flow of our algorithm. The algorithm starts by extracting surfaces of target structures by invoking NACCESS program (28). Along with the atomic accessible surface, NACCESS calculates relative surface accessibilities (RSA) of residues. Residues whose RSAs (percent accessibility compared to the accessibility of the residue type X in an extended ALA-X-ALA tripeptide) are greater than 5%, can be considered to be on the surface (3).
Fig 1.

Main steps of the PRISM prediction algorithm
The algorithm then checks whether particular regions on target surfaces resemble complementary partners of representative interfaces in the template dataset. Each partner (side) of an interface is then structurally aligned with the target surface, by invoking MULTIPROT (25,27) . MULTIPROT detects common geometrical cores between given protein structures in a sequence-order-independent way. This feature makes MULTIPROT a favorable selection for the task, since protein surfaces and protein-protein interfaces have sequence discontinuity. MULTIPROT returns 10 best substructural matches resulting from every possible alignment. Each substructure corresponds to different regions on the surface, bearing different levels of structural similarity to the interface partner. Among these alignments, the algorithm seeks the most favorable alignment that maximizes our similarity scoring function. The similarity scoring function is defined as αfevolution + (1-α)fstructure, where fevolution and fstructure are evolutionary and structural similarity scoring functions respectively. The coefficient, α, represents the relative importance of evolutionary similarity to structural similarity. The first function reflects the number of identically matched hotspots, the second function reflects the size and quality of the alignment along the target-template alignment. We assume that hotspots bear greater importance in defining an interface than geometrical complementarity. Therefore we select α as 0.6. The condition prior to alignment restrains the interface partner size to be at least 0.7 times the target surface size. (Size of a structure is defined as the number of residues it contains). This condition keeps relatively small interfaces out of computations. Such relatively small interfaces are likely to align perfectly with target surfaces and yield high similarity scores, causing biased and unselective results.
After the completion of successive structural alignments, a similarity list for each interface partner is obtained. If the similarity lists of corresponding partners of a template interface contain N and M target structures, respectively, we obtain N x M predictions for that interface. A prediction is uniquely represented by (A,B,I) triplets, where A and B are predicted targets and I is the template interface via which the interaction was predicted. The extent of favorableness of the predicted interaction (prediction score) is quantified by simply the sum of the similarity scores of the target pairs. We have run our algorithm using the template interface set and target structure set which resulted in a total of 62,616 protein-protein interactions. The details of the algorithm and the parameters of the scoring function is available in the Prism server documentation.
3.2 Services Provided by Prism
The Prism web server provides its users with a front-end to our datasets used in our prediction algorithm, an interface to the offline results of our calculations based on the most previous run of our algorithm, and also the ability to run our algorithm for a user input protein. Services provided to the user and the input types differ accordingly, so they are discussed separately.
3.2.1 Browsing and Searching Interface Database
In the interfaces section we make our interface dataset available to the scientific community. A total number of 21,684 interfaces are stored, clustered into 3,799 clusters according to their structural similarity. Users are provided with a search facility by which they can find specific interfaces in our dataset. Their inputs can be a simple search string which is searched for in the corresponding records in the title section of the PDB file of the protein which the template interface belongs to. For example the user might be interested in interfaces that are extracted from proteins that play a role in apoptosis or the user may want to see interfaces that are extracted from enzymes only. In addition to this basic search functionality, some advanced search options can also be used, enabling the user to search for interfaces of certain size (in terms of solvent accessible surface areas measured in Å2) or interfaces that have the highest frequency for a certain type of amino acid. Once the user clicks on an interface, an output containing the following data is provided: (i) A summary of the proteins the interface is extracted from, including cross references to other biological databases where available. (ii) Details about the interface in question such as the names of the constituent chains, interface size (in terms of number of residues), solvent accessible surface areas buried upon complexation, polar and non-polar ASAs, and a listing of all interface residues with their respective interface ASA. Fig 2 shows a snapshot of the web server's results on the summary of the proteins, i.e., name of the protein, number of atoms of the protein, ASA of the interfaces, etc.). (iii) A visualization of the interface is also output as static images that are dynamically generated by running RasMol scripts where the interface is highlighted on the protein. The whole protein is represented with a stick representation, whereas the interface atoms are shown with spheres.
Fig 2.
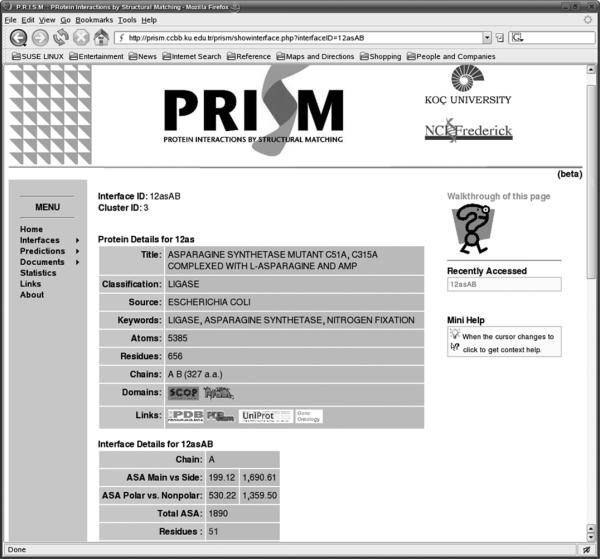
A snapshot of the web server displaying the details of the proteins that the interface belongs to. Chain identities give the details of the two sides of the interface.
3.2.2 Browsing and Searching Target Dataset
In the targets section (under prediction), users are provided with a search facility with which they can find specific structures in our dataset that match to a set of search criteria. The input can be a simple search string which is searched for in the corresponding records in the title section of the PDB file of the protein. In addition, using advanced search options, specific sets of target structures can be returned where, for instance, the target structure is of predefined size (size defined in number of residues) or of type (monomer, complex, split chain). Once the user clicks on a certain target protein, she is provided with an output containing the following data: A summary of the target protein, a list of template interfaces that the target structure is found to have a match for, several dynamically generated static images visualizing the target structure.
3.2.3 Searching Predicted Interactions
Under the predictions section of PRISM, users can search our results in two different ways. One possibility is that, users can directly search for the presence of similarities between a template interface and a target structure. Alternatively, one can either input the PDB ID or the sequence of a protein (whose sequence is then aligned to the target dataset using BLAST (29)) which is then checked for any predicted protein-protein interactions that the input protein participates in. The target structures that match to different partner chains of a template interface is then displayed to the user as a list of proteins that are candidates for an interaction. This is done by first checking to see if the input protein has a binding site similar to any one of the template interfaces as explained in the methodology section. All the target structures that are a priori found to have a binding site similar to the partner of the matched interface are listed as the predicted interacting protein.
Fig 3 presents a snapshot of the web server for the prediction results. The left column lists the possible binding partners for the protein with PDB code 1mr8. The second column contains links to the domain information of partners. The third column shows which template interfaces were used in the prediction phase. The last column gives the prediction score. Detailed information of the predictions is given in respective pages. Fig 4 displays a snapshot of an example output. Here one of the putative binding partners of 1mr8, 1e8a is detailed. The target here is 1mr8 and the template is 1mr8 (in the template dataset, A chain of 1mr8 interacts with 1mr8B chain). The target is 1e8aA. Each row in the figure displays which residue in the template dataset is structurally aligned with those of the target protein. The red residues (dark colored) are the computational hot spots of the template interface. It is also possible to list all proteins matching left and right side of an interface. For example, Fig 5 shows all matching proteins through the interface 1mrsAB.
Fig 3.
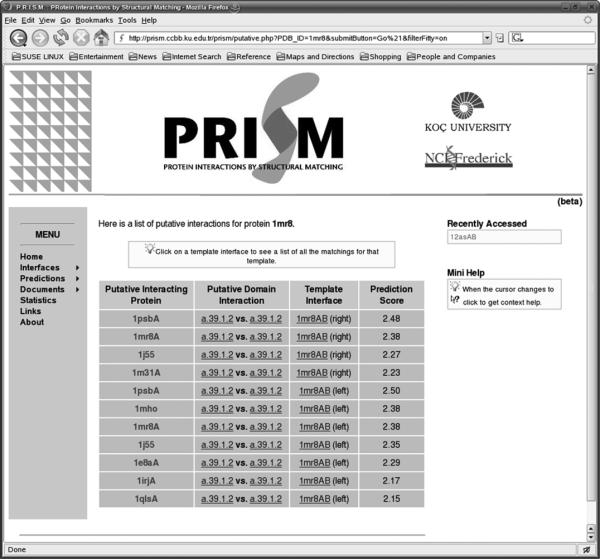
List of the putative interacting proteins for protein 1mr8. The left column lists the possible binding partners. The second column contains links to the domain information of partners. The third column is the template interfaces were used in the prediction. The last column is the prediction score.
Fig 4.
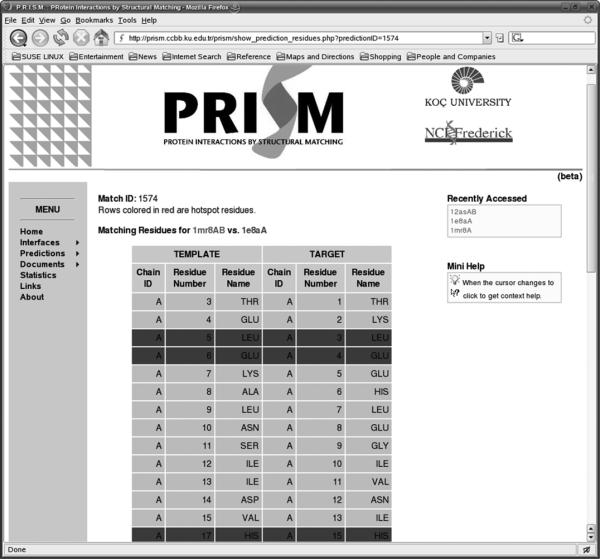
A snapshot of the server displaying the results of the list of residues of the one side of predicted interface (target columns). The template columns are the residue listing of the template interface through which the interface was predicted. Red (dark colored) ones show the computational hot spots of the template interface.
Fig 5.
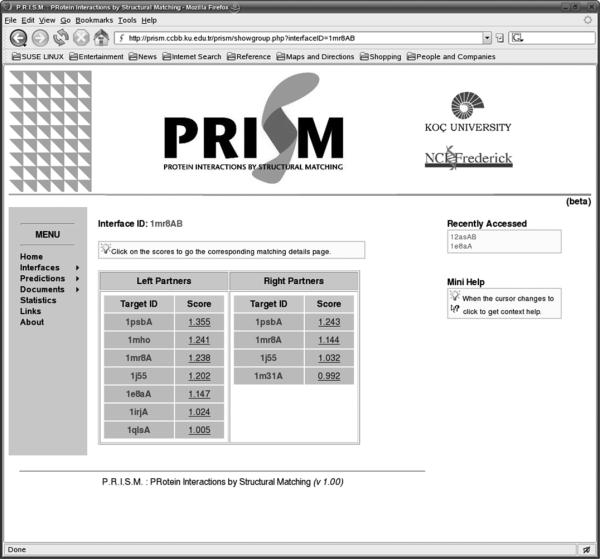
Matching details of template interface. The proteins matching left and right side of interface 1mr8AB is listed with corresponding similarity scores.
3.2.4 Online Prediction Calculations
The Prism web site can also be used for performing online calculations to predict binding partners of input proteins not covered by our datasets. At the moment we have implemented a preliminary service in which users can ask to see which of the proteins in our datasets, their input protein interacts with. Prism accepts an input protein either by its PDB code, or by file upload. The online calculations build on top of our previous results. First the target dataset is replaced with the structure in question. Then the algorithm is run using the original template set and the user input structure. Upon completion of the algorithm we know which of the template interface partners are structurally similar to the surface of the structure in question. It then finds the original structures in our target set that are similar to the partner of the template interface. These structures are then output as the proteins the input protein is predicted to interact with.
4. Results and Discussion
Prediction results contain various interaction pairs, some of which are verified in DIP (30) and BIND (31) interaction databases as well as PDB. Starting from 67 template interfaces we found 62,616 pair wise interactions among the 6,170 target proteins. 31,980 of these interactions are between the monomeric structures. 25,448 of them are between a monomeric protein and a complex structure. 5,188 are between two complex structures. Most of these predictions are heterodimers; only 284 are homodimers (100% sequence identity between partners). This number contains predictions with partners having identical sequences, within the same complex.
Table 1 displays a list of predictions with highest scores. The first 4 letters in columns 1, 2 and 4 are PDB representations of proteins, the following letters are PDB chain identifiers. In columns 1 and 2, multiple chains are enclosed in curly brackets, to indicate that the chains are identical and the prediction applies to all of them. In column 4, the two letters indicate between which chains of the structures template interface exists. Columns 5 and 6 are respective functions of SWISSPROT cross references of target partners, queried via SWISSPROT Sequence Retrieval System (SRS).
Table 1.
A selected set of verified and unverified predictions. The letters B, D, and P in verified column corresponds to verification in BIND, DIP, and PDB databases.
| Left Partner | Right Partner | Verif. D.base | Template | Left Function | Right Function |
|---|---|---|---|---|---|
| 1cov1 | 1h8tC | 1cov13 | Coxsackievirus Coat Protein | Echovirus 11 Coat Protein | |
| 1dgi | 1ncqC | 1cov13 | Poliovirus Receptor | Coat Protein Vp3 | |
| 1lq8{AECG} | 1jjo{EF} | P | 1as4AB | Plasma Serine Protease Inhibitor | Neuroserpin |
| 2ae2{AB} | 1e7w{AB} | D,B,P | 1e92AC | Tropinone Reductase-II | Pteridine Reductase |
| 2sicE | 1lw6I | P | 2sniEI | Subtilisin BPN | Subtilisin-Chymotrypsin Inhibitor-2A |
| 1mho | 1psb{AB} | D,B,P | 1mr8AB | S-100 Protein | S-100 Protein, Beta Chain |
| 1hj9 | 1jbl | 1sbwAI | Beta-Trypsin | Cyclic Trypsin Inhibitor | |
| 2tnf{ABC} | 1dg6 | D,P | 1cdaAB | TNF | TNF Related Apoptosis Inducing Ligand |
| 1fxkC | 1jm7B | 1jm7AB | Prefoldin | Brca1-Associated Ring Domain Protein 1 | |
| 1gk6{AB} | 2ebo{ABC} | P | 1cosAB | Vimentin | Ebola Virus Envelope Glycoprotein |
| 1kb9K | 1n8v | 1hezCE | Light Chain (VI) of Fv-Fragment | Chemosensory Protein | |
| 1i4k1 | 1m5q{A..Z12} | 1i4k12 | Putative Snrnp Sm-like Protein | Small Nuclear Ribonucleoprotein homolog | |
| 1l8d{AB} | 1c17 | 1jgcAC | RAD50 Atpase | ATP Synthase Subunit C | |
| 1mso{AC} | 1mso(32) | P | 6rlxAB | Insulin like growth factor A-Chain | Insulin like growth factor B-Chain |
| 1ixm{AB} | 1k75{AB} | 1fuuAB | Sporulation Response Regulatory Protein | L-Histidinol Dehydrogenase | |
| 1iesB | 1ecm{AB} | 1iesAB | Ferritin | Endo-Oxabicyclic Transition State Analogue | |
| 1ju5C | 1uff | B | 1azeAB | Abl | Intersectin 2 |
| 1osh | 1fm6E | 1fm6DE | Bile Acid Receptor | Steroid Receptor Coactivator |
Analysis of the 62,616 predicted interactions reveals that the top five templates with the most number of matches contribute some 65% of the predictions (40856 interactions). These interfaces, which are “fitty templates” since they scored high similarity scores and fit targets easily. Three of these come from helical proteins (1cosAC, 1aq5AC, 1sfcBJ). They are all single domain interfaces. Furthermore, the first one (1cosAC) comes from a designed protein and is found to match most of the helical structures in the target set. Prism will normally filter these predictions from the results of search queries unless the user explicitly wants them.
A reasonable number of predictions were verified in DIP and BIND interaction databases. We don't expect that all predicted interactions can be verified since not all target structures are cross-referenced to DIP or BIND databases. Table 2 displays the number of verified interactions out of cross referenced interactions for three interaction databases (as of January 2004). The column two in the table is the number of verified (target1, target2) interactions. The third column is the maximum number of predictions that could be verified due to available cross-referenced data in the corresponding database. The results display a good balance of verified and unverified predictions. Verified interactions prove the reliability of our algorithm whereas unverified ones may correspond to unobserved interactions that actually occur in nature or may synthetically be realized in laboratory conditions. We believe these unverified predictions may have important implications regarding drug design.
Table 2.
Number of verified predictions ( January 2004)
| Interaction database | Unique verifications | Practical maximum verifications |
|---|---|---|
| DIP | 597 | 4107 |
| BIND | 431 | 1739 |
| PDB | 1094 | 1497 |
5. Conclusion
As a large amount of protein structure data becomes available, predictive methods to detect and characterize protein-protein interactions are becoming increasingly important venues towards defining new foundations of systems biology. We have developed a novel algorithm for automated prediction of protein-protein interactions that employs a bottom-up approach combining structure and sequence conservation in protein interfaces, and developed a web server for the analysis of protein-protein interfaces and predicted predictions.
Starting from a non-redundant dataset that represents of structurally available interfaces in protein-protein interactions, some 60000 predictions were obtained, some of which were verified in interaction databases. The datasets and prediction results can be searched using the Prism web server. Another service provided by Prism is the interactive prediction. This is done by running the algorithm for the user input structures. At the moment, the online prediction of an interaction for a user input protein and all the structures in our target dataset is possible. Currently, Prism server is being improved by both updating interface and target datasets and by providing more advanced online calculations such as classification of predictions as crystal-crystal interactions or biological interactions.
Acknowledgements
The authors would like to thank A. Selim Aytuna and Utkan Ogmen for the development and implementation of Prism. This project has been funded in whole or in part with TUBITAK Research Grant (104T504) and Federal funds from the National Cancer Institute, National Institutes of Health, under contract number NO1-CO-12400. This research was supported [in part] by the Intramural Research Program of the NIH, National Cancer Institute, Center for Cancer Research. The content of this publication does not necessarily reflect the view or policies of the Department of Health and Human Services, nor does mention of trade names, commercial products, or organization imply endorsement by the U. S. Government. O.Keskin acknowledges Turkish Academy of Sciences Young Scientist Award (TUBA-GEBIP).
REFERENCES
- 1.Bogan AA, Thorn KS. Anatomy of hot spots in protein interfaces. J Mol Biol. 1998;280:1–9. doi: 10.1006/jmbi.1998.1843. [DOI] [PubMed] [Google Scholar]
- 2.Chakrabarti P, Janin J. Dissecting protein-protein recognition sites. Proteins. 2002;47:334–43. doi: 10.1002/prot.10085. [DOI] [PubMed] [Google Scholar]
- 3.Jones S, Thornton JM. Analysis of protein-protein interaction sites using surface patches. J Mol Biol. 1997;272:121–32. doi: 10.1006/jmbi.1997.1234. [DOI] [PubMed] [Google Scholar]
- 4.Lo Conte L, Chothia C, Janin J. The atomic structure of protein-protein recognition sites. J Mol Biol. 1999;285:2177–98. doi: 10.1006/jmbi.1998.2439. [DOI] [PubMed] [Google Scholar]
- 5.Keskin O, Ma B, Rogale K, Gunasekaran K, Nussinov R. Protein-protein interactions: organization, cooperativity and mapping in a bottom-up Systems Biology approach. Phys Biol. 2005;2:S24–S35. doi: 10.1088/1478-3975/2/2/S03. [DOI] [PubMed] [Google Scholar]
- 6.Glaser F, Steinberg DM, Vakser IA, Ben-Tal N. Residue frequencies and pairing preferences at protein-protein interfaces. Proteins. 2001;43:89–102. [PubMed] [Google Scholar]
- 7.Ito T, Tashiro K, Muta S, Ozawa R, Chiba T, Nishizawa M, Yamamoto K, Kuhara S, Sakaki Y. Toward a protein-protein interaction map of the budding yeast: A comprehensive system to examine two-hybrid interactions in all possible combinations between the yeast proteins. Proc Natl Acad Sci U S A. 2000;97:1143–7. doi: 10.1073/pnas.97.3.1143. [DOI] [PMC free article] [PubMed] [Google Scholar]
- 8.Jones S, Thornton JM. Protein-protein interactions: a review of protein dimer structures. Prog Biophys Mol Biol. 1995;63:31–65. doi: 10.1016/0079-6107(94)00008-w. [DOI] [PubMed] [Google Scholar]
- 9.Neuvirth H, Raz R, Schreiber G. ProMate: a structure based prediction program to identify the location of protein-protein binding sites. J Mol Biol. 2004;338:181–99. doi: 10.1016/j.jmb.2004.02.040. [DOI] [PubMed] [Google Scholar]
- 10.Zhou HX, Shan Y. Prediction of protein interaction sites from sequence profile and residue neighbor list. Proteins. 2001;44:336–43. doi: 10.1002/prot.1099. [DOI] [PubMed] [Google Scholar]
- 11.Clackson T, Wells JA. A hot spot of binding energy in a hormone-receptor interface. Science. 1995;267:383–6. doi: 10.1126/science.7529940. [DOI] [PubMed] [Google Scholar]
- 12.DeLano WL. Unraveling hot spots in binding interfaces: progress and challenges. Curr Opin Struct Biol. 2002;12:14–20. doi: 10.1016/s0959-440x(02)00283-x. [DOI] [PubMed] [Google Scholar]
- 13.Keskin O, Ma B, Nussinov R. Hot regions in protein--protein interactions: the organization and contribution of structurally conserved hot spot residues. J Mol Biol. 2005;345:1281–94. doi: 10.1016/j.jmb.2004.10.077. [DOI] [PubMed] [Google Scholar]
- 14.Ma B, Wolfson HJ, Nussinov R. Protein functional epitopes: hot spots, dynamics and combinatorial libraries. Curr Opin Struct Biol. 2001;11:364–9. doi: 10.1016/s0959-440x(00)00216-5. [DOI] [PubMed] [Google Scholar]
- 15.Uetz P, Giot L, Cagney G, Mansfield TA, Judson RS, Knight JR, Lockshon D, Narayan V, Srinivasan M, Pochart P, Qureshi-Emili A, Li Y, Godwin B, Conover D, Kalbfleisch T, Vijayadamodar G, Yang M, Johnston M, Fields S, Rothberg JM. A comprehensive analysis of protein-protein interactions in Saccharomyces cerevisiae. Nature. 2000;403:623–7. doi: 10.1038/35001009. [DOI] [PubMed] [Google Scholar]
- 16.Zhu H, Bilgin M, Bangham R, Hall D, Casamayor A, Bertone P, Lan N, Jansen R, Bidlingmaier S, Houfek T, Mitchell T, Miller P, Dean RA, Gerstein M, Snyder M. Global analysis of protein activities using proteome chips. Science. 2001;293:2101–5. doi: 10.1126/science.1062191. [DOI] [PubMed] [Google Scholar]
- 17.Kortemme T, Baker D. Computational design of protein-protein interactions. Curr Opin Chem Biol. 2004;8:91–7. doi: 10.1016/j.cbpa.2003.12.008. [DOI] [PubMed] [Google Scholar]
- 18.Keskin O, Tsai CJ, Wolfson H, Nussinov R. A new, structurally nonredundant, diverse data set of protein-protein interfaces and its implications. Protein Sci. 2004;13:1043–55. doi: 10.1110/ps.03484604. [DOI] [PMC free article] [PubMed] [Google Scholar]
- 19.Winter C, Henschel A, Kim WK, Schroeder M. SCOPPI: a structural classification of protein-protein interfaces. Nucleic Acids Res. 2006;34:D310–4. doi: 10.1093/nar/gkj099. [DOI] [PMC free article] [PubMed] [Google Scholar]
- 20.Aytuna AS, Gursoy A, Keskin O. Prediction of protein-protein interactions by combining structure and sequence conservation in protein interfaces. Bioinformatics. 2005;21:2850–5. doi: 10.1093/bioinformatics/bti443. [DOI] [PubMed] [Google Scholar]
- 21.Murakami Y, Jones S. SHARP2: protein-protein interaction predictions using patch analysis. Bioinformatics. 2006;22:1794–5. doi: 10.1093/bioinformatics/btl171. [DOI] [PubMed] [Google Scholar]
- 22.Aloy P, Bottcher B, Ceulemans H, Leutwein C, Mellwig C, Fischer S, Gavin AC, Bork P, Superti-Furga G, Serrano L, Russell RB. Structure-based assembly of protein complexes in yeast. Science. 2004;303:2026–9. doi: 10.1126/science.1092645. [DOI] [PubMed] [Google Scholar]
- 23.Ogmen U, Keskin O, Aytuna AS, Nussinov R, Gursoy A. PRISM: protein interactions by structural matching. Nucleic Acids Res. 2005;33:W331–6. doi: 10.1093/nar/gki585. [DOI] [PMC free article] [PubMed] [Google Scholar]
- 24.Berman HM, Westbrook J, Feng Z, Gilliland G, Bhat TN, Weissig H, Shindyalov IN, Bourne PE. The Protein Data Bank. Nucleic Acids Res. 2000;28:235–42. doi: 10.1093/nar/28.1.235. [DOI] [PMC free article] [PubMed] [Google Scholar]
- 25.Nussinov R, Wolfson HJ. Efficient detection of three-dimensional structural motifs in biological macromolecules by computer vision techniques. Proc Natl Acad Sci U S A. 1991;88:10495–9. doi: 10.1073/pnas.88.23.10495. [DOI] [PMC free article] [PubMed] [Google Scholar]
- 26.Ma B, Elkayam T, Wolfson H, Nussinov R. Protein-protein interactions: structurally conserved residues distinguish between binding sites and exposed protein surfaces. Proc Natl Acad Sci U S A. 2003;100:5772–7. doi: 10.1073/pnas.1030237100. [DOI] [PMC free article] [PubMed] [Google Scholar]
- 27.Shatsky M, Nussinov R, Wolfson HJ. A method for simultaneous alignment of multiple protein structures. Proteins. 2004;56:143–56. doi: 10.1002/prot.10628. [DOI] [PubMed] [Google Scholar]
- 28.Hubbard SJ, Thornton JM. London: 1993. (Department Biochemistry and Molecular Biology, U. C., Ed.)
- 29.Altschul SF, Madden TL, Schaffer AA, Zhang J, Zhang Z, Miller W, Lipman DJ. Gapped BLAST and PSI-BLAST: a new generation of protein database search programs. Nucleic Acids Res. 1997;25:3389–402. doi: 10.1093/nar/25.17.3389. [DOI] [PMC free article] [PubMed] [Google Scholar]
- 30.Xenarios I, Salwinski L, Duan XJ, Higney P, Kim SM, Eisenberg D. DIP, the Database of Interacting Proteins: a research tool for studying cellular networks of protein interactions. Nucleic Acids Res. 2002;30:303–5. doi: 10.1093/nar/30.1.303. [DOI] [PMC free article] [PubMed] [Google Scholar]
- 31.Dandekar T, Snel B, Huynen M, Bork P. Conservation of gene order: a fingerprint of proteins that physically interact. Trends Biochem Sci. 1998;23:324–8. doi: 10.1016/s0968-0004(98)01274-2. [DOI] [PubMed] [Google Scholar]
- 32.Adams CW, Allison DE, Flagella K, Presta L, Clarke J, Dybdal N, McKeever K, Sliwkowski MX. Humanization of a recombinant monoclonal antibody to produce a therapeutic HER dimerization inhibitor, pertuzumab. Cancer Immunol Immunother. 2006;55:717–27. doi: 10.1007/s00262-005-0058-x. [DOI] [PMC free article] [PubMed] [Google Scholar]