Abstract
To study the effect of mitochondrial permeability transition pore (PTP) opening on NAD(P)H localization, intact cells were exposed to the Ca2+ ionophore A23187. PTP opening, mitochondrial membrane potential, mitochondrial volume, and NAD(P)H localization were assessed by time-lapse laser confocal microscopy using the calcein-cobalt technique, tetramethylrhodamine methyl ester, MitoTracker, and NAD(P)H autofluorescence, respectively. Concomitant with PTP opening, NAD(P)H fluorescence increased outside mitochondria. These events occurred in all cells and were prevented by cyclosporin A. Mitochondrial membrane potential was not systematically collapsed, whereas mitochondrial volume did not change, confirming that A23187 induced transient PTP opening in a subpopulation of cells and suggesting that mitochondrial swelling did not immediately occur after PTP opening in intact cells. NAD(P)H autofluorescence remained elevated after PTP opening, particularly after membrane potential had been collapsed by an uncoupler. Extraction of nucleotide for NAD(P)H quantification confirmed that PTP opening led to an increase in NAD(P)H content. Because the oxygen consumption rate decreased, whereas the lactate/pyruvate ratio increased after PTP opening in intact cells, we conclude that PTP opening inhibits respiration and dramatically affects the cytosolic redox potential in intact cells.
The permeability transition pore (PTP)3 is a mitochondrial channel activated by matrix Ca2+ and inhibited by cyclosporin A (CsA) (1, 2). Although its molecular nature remains a matter of debate, the role of the PTP in cell death is now well acknowledged, especially when cell death is triggered by oxidative stress (3–5).
Under normal physiological conditions, the mitochondrial inner membrane is impermeable to almost all metabolites and ions. The compounds that enter or leave mitochondria are generally transported via specific and highly controlled carriers (6). Consequently, intra- and extramitochondrial environments are significantly different in ionic composition. PTP opening dramatically changes the properties of the inner membrane, making it unspecifically permeable to molecules smaller than 1500 Da, which thus equilibrate according to their concentration gradient (1).
In isolated mitochondria, PTP opening leads to the collapse of the protonmotive force and the release of matrix NADH (7, 8). When incubated in the standard media used with isolated organelles, PTP opening leads to mitochondrial swelling because of the presence of matrix proteins that cannot diffuse through the open pore, thus creating an oncotic pressure gradient. This oncotic pressure gradient can be eliminated by incubating mitochondria in media containing osmotic molecules larger than 1500 Da, a particular condition in which PTP opening occurs in the absence of mitochondrial swelling (9). Concomitant to this change in permeability, PTP opening in isolated mitochondria also leads to a partial inhibition of respiratory chain Complex 1 and to a dramatic increase in reactive oxygen species production (10).
It has long been recognized that PTP opening is a reversible event (11). However, not all the consequences of PTP opening are reversible. Closure of the pore restores the protonmotive force and the ionic homeostasis of compounds that are physiologically transported, whereas compounds that only diffuse through an open PTP remain either entrapped or excluded after they have entered or left mitochondria, respectively (12). Consequently, PTP closure in isolated mitochondria does not lead to mitochondrial shrinkage in sucrose- or KCl-based media (13).
PTP opening in intact cells has been visualized using compounds that do not enter mitochondria unless the PTP is open. Two different approaches with calcein have been developed. In experimental conditions where cell loading with calcein acetoxymethyl ester does not load mitochondria, calcein fluorescence is compartmentalized outside mitochondria, and PTP opening is visualized by the distribution of calcein inside mitochondria (14). In experimental conditions where calcein acetoxymethyl ester also loads mitochondria, the fluorescence from cytosolic calcein is quenched by the addition of cobalt that distributes in cells but not in mitochondria. The calcein fluorescence is then compartmentalized within mitochondria until PTP opening permits the distribution of cobalt inside mitochondria, which results in the quenching of calcein fluorescence (15). Whatever the technique, PTP opening thus leads to the decompartmentalization of calcein fluorescence.
PTP opening in intact cells may or may not lead to mitochondrial depolarization depending on the PTP open time. Observations where calcein decompartmentalization occurred without mitochondrial depolarization indicate that PTP opening may be reversible in intact cells (16).
Whether or not PTP opening leads to mitochondrial swelling in intact cells remains a matter of debate. Concomitant to PTP opening in intact cells, mitochondrial morphological changes interpreted as mitochondrial swelling (17, 18) or the absence of any mitochondrial swelling (19) have both been reported.
Indirect evidence suggests that PTP opening in vivo leads to the release of mitochondrial NAD(P)+ (20). However, mitochondrial NAD(P)H release following PTP opening has never been directly demonstrated in intact cells. Finally, it is not known whether PTP opening inhibits Complex 1 in intact cells, as it does in isolated mitochondria. In the present work, studying intact cells by time-lapse laser confocal microscopy, we report that both transient PTP opening (i.e. calcein decompartmentalization in the absence of mitochondrial depolarization) and permanent PTP opening (i.e. calcein decompartmentalization with mitochondrial depolarization) led to the appearance of NAD(P)H outside mitochondria and inhibited the respiratory chain but did not induce mitochondrial swelling.
MATERIALS AND METHODS
Cell Culture—Immortalized human microvascular endothelial cells (HMEC-1), a generous gift of Dr. J. J. Feige (Commissariat à l'Energie Atomique, Grenoble, France), were maintained in MCDB 131 medium supplemented with 15% heat-inactivated fetal bovine serum, 2 mm l-glutamine, 50 IU/ml penicillin, 50 μg/ml streptomycin, 10 ng/ml epidermal growth factor, and 1 μg/ml hydrocortisone. HMEC-1 cells were grown to confluence and maintained at 37 °C in humidified atmosphere (95% air, 5% CO2). Two days before the experiment, cells were harvested, seeded, and grown on glass coverslips in the medium described above.
Hepatocytes were isolated according to the method of Berry and Friend (21), as modified by Groen et al. (22). Hepatocytes were seeded on collagen type I-coated glass coverslips (5 μg/cm2) in a mixture containing 75% minimum essential medium and 25% medium 199, supplemented with 10% fetal bovine serum, 50 IU/ml penicillin, 50 μg/ml streptomycin, 0.2 mg/ml bovine serum albumin, 2 mm l-glutamine, and 10 μg/ml insulin. The medium was removed after 3 h and replaced by the same medium, with the exception that fetal bovine serum was omitted and bovine serum albumin concentration was increased to 1 mg/ml.
Cell Loading—Cell loading was performed immediately before the experiment in the presence of 1 μm CsA or vehicle in MCDB 131 medium for HMEC-1 cells or in 75% minimum essential medium plus 25% medium 199 for hepatocytes. For calcein/cobalt staining, cells were exposed for 30 min to a medium supplemented with 8 mm CoCl2 and 0.25 μm calcein acetoxymethyl ester. For membrane potential determination, cells were loaded with 10 nm tetramethylrhodamine methyl ester (TMRM) for 30 min. For the determination of mitochondrial volume, cells were loaded with 50 nm MitoTracker Green for 20 min. After loading, cells were washed free of probes and further incubated in MCDB 131 medium for HMEC-1 cells or in 75% minimum essential medium plus 25% medium 199 for hepatocytes.
Imaging—Cells on glass coverslips were studied by time-lapse laser confocal microscopy at 37 °C in a humidified atmosphere (95% air, 5% CO2) using a microscope equipped with a perfusion chamber (POC chamber, LaCon, Erbach, Germany) and an incubation system (O2-CO2-°C, PeCon, Erbach, Germany). Images were collected with a Leica TCS SP2 Acoustico Optical Beam Splitter (AOBS) inverted laser scanning confocal microscope equipped with a Coherent 351–364 UV laser using a ×63 water immersion objective (HCX PL APO 63.0 × 1.20 water corrected). Laser excitation was 351–364 nm for NAD(P)H, 488 nm for calcein or MitoTracker Green, and 543 nm for TMRM. Fluorescence emission adjusted with AOBS was 390–486 nm for NAD(P)H, 506–541 nm for calcein, 565–645 nm for TMRM, and 501–542 nm for MitoTracker Green. Confocal pinhole (Airy units) was 1 for calcein and TMRM. Because NAD(P)H is less fluorescent, the pinhole aperture was increased to 2.62. The same aperture was used with MitoTracker Green to perform volume comparison. Image acquisition conditions were kept constant during each experiment. Each experiment was performed on a randomly chosen field containing 15–25 cells.
The images of calcein and TMRM were not electronically manipulated. NADH autofluorescence images were improved by linear contrast enhancement followed by fine filter (Kernel 3 × 3) and deconvolution by calculated point spread function using the Volocity software. The MitoTracker Green images were improved using the ImageJ software as described in Ref. 23 using a “top-hat” spatial filter. This filter is particularly suited to extract intense peaks upon background, depending on the criteria of size and shape. Therefore, this allows the removal of noise and a precise definition of the mitochondrial morphology.
Image quantification was performed using the ImageJ and Volocity software for area, volume, and fluorescence intensity quantification. Because the fluorescence intensity depends on the number of cells, whereas the percentage of changes of fluorescence does not, the fluorescence was arbitrarily set at 100 at the beginning of each experiment. This was done to facilitate the comparison of changes in fluorescence between the different experiments.
Oxygraphy—Hepatocyte oxygen consumption was measured polarographically at 37 °C using a Clark-type electrode. The incubation medium was a Krebs-Henseleit-bicarbonate buffer at pH 7.4 containing 1.4 mm Ca2+ and 10 mm lactate plus 1 mm pyruvate.
Quantification of NADH—For the quantification of total hepatocyte NAD(P)H content, nucleotides were extracted as described in Ref. 24. For the quantification of mitochondrial NAD(P)H content, nucleotides were extracted using the digitonin fractionation method as described by in Ref. 25, except that the quenching phase under the oil was replaced by 2 m KOH. After extraction, NAD(P)H was immediately measured by fluorometry.
Lactate/Pyruvate Ratio—Hepatocytes were incubated in 30-ml stopped plastic vials in a shaking water bath at 37 °C. The incubation medium (5 ml) was a Krebs-Henseleit-bicarbonate buffer in equilibrium with a gas phase containing O2/CO2 (95% O2 and 5% CO2), pH 7.4, supplemented with 1.4 mm Ca2+ and 20 mm dihydroxyacetone. When indicated, 700-μl samples of the cell suspension were taken, quenched in HClO4 (0.4 g/liter final concentration), and neutralized with 2 m KOH, 0.3 m MOPS. Lactate and pyruvate were measured enzymatically as described in Bergmeyer (26).
Isolated Mitochondria—Rat liver mitochondria were prepared according to standard differential centrifugation procedures in a medium containing 250 mm sucrose, 10 mm Tris-HCl (pH 7.4), and 0.1 mm EGTA-Tris. Mitochondrial volume changes (light scattering at 520 nm) and NAD(P)H fluorescence (excitation-emission, 340-460 nm) were measured simultaneously using a PTI Quantamaster C61 spectrofluorometer equipped with magnetic stirring and thermostatic controls.
Reagents—Calcein acetoxymethyl ester, TMRM, and Mitotracker Green were from Molecular Probes, whereas all other chemicals were from Sigma.
RESULTS
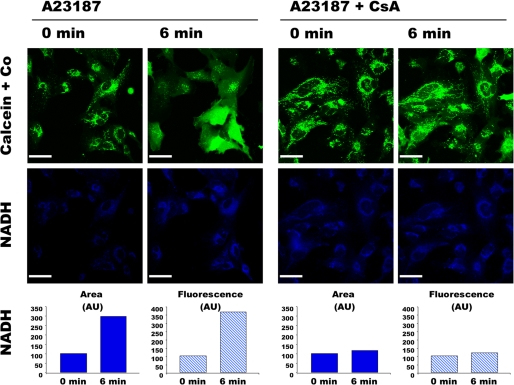
HMEC-1 cells coloaded with calcein plus cobalt displayed a fluorescence compatible with a mitochondrial calcein distribution (Fig. 1). Cells were exposed to the Ca2+ ionophore A23187 and, as expected (16), a decompartmentalization of the calcein fluorescence occurred (Fig. 1, upper panel, left). No change in the pattern of calcein distribution was observed in the absence of Ca2+ ionophore (not shown). Note that the A23187-induced calcein decompartmentalization was partial in some cells (i.e. some mitochondria remained fluorescent). However, total or partial calcein decompartmentalization occurred in every cell, suggesting that this protocol led to PTP opening in every HMEC-1 cell but not in all mitochondria. In the presence of CsA, PTP opening requires more Ca2+ (27). Because the Ca2+ load increases with time under our conditions, CsA is expected to retard PTP opening (16). As shown in Fig. 1, the decompartmentalization of the calcein fluorescence was dramatically delayed when cells where incubated in the presence of CsA (Fig. 1, upper panel, right).
FIGURE 1.
Double channel imaging of PTP opening and NAD(P)H autofluorescence. HMEC-1 cells coloaded with 0.25 μm calcein-AM and 8 mm CoCl2 (Co) in the absence or presence of 1 μm CsA were exposed to 0.05 μm A23187. The fluorescence of calcein (green) and NAD(P)H (blue) was imaged simultaneously every 3 min. NAD(P)H quantification (arbitrary units (AU)) was calculated with the Volocity software using a threshold value of 50, which corresponded to the highest fluorescence outside cells. Area represents the sum of all the pixels above the threshold in the image shown. Fluorescence represents the whole fluorescence of the pixels with fluorescence intensity above the threshold in the presented image. Bar, 44 μm.
NAD(P)H autofluorescence was measured in parallel in the same cells (Fig. 1, lower panels). As expected, NAD(P)H was mainly localized within mitochondria before A23187 addition (see also Figs. 2 and 3). Concomitant to calcein decompartmentalization, A23187 addition led to an increase in NAD(P)H autofluorescence in terms of both intensity and surface distribution. The effect of A23187 on NAD(P)H fluorescence was prevented by CsA (Fig. 1), and the same behavior was also observed in the absence of calcein plus cobalt (not shown). These data indicate that A23187-induced PTP opening affected the localization and fluorescence of NAD(P)H in HMEC-1 cells.
FIGURE 2.
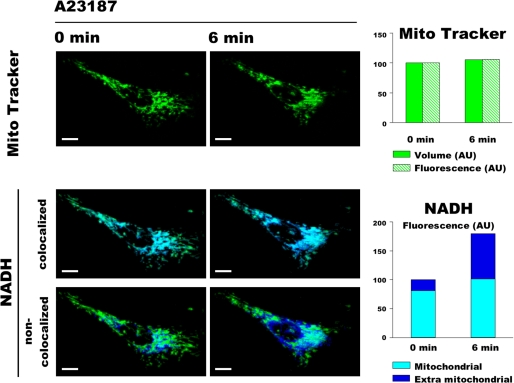
Three-dimensional double channel imaging of NAD(P)H autofluorescence and mitochondrial volume. HMEC-1 cells loaded with 50 nm MitoTracker Green were exposed to 0.05 μm A23187. The fluorescence of NAD(P)H (blue) and MitoTracker (green) was imaged every 3 min in 11 optical sections with 0.3-μm z-step. NAD(P)H images were split in two images using ImageJ software, one that colocalizes with MitoTracker (i.e. mitochondrial NAD(P)H) and the other that does not colocalize with MitoTracker (i.e. extra mitochondrial NAD(P)H). The presented images represent three-dimensional reconstructions of the 11 optical sections performed with the Volocity software. Volume represents the sum of all the voxels above a threshold value of 3 for MitoTracker. Fluorescence represents the fluorescence intensity of all the voxels above a threshold value of 3 and 50 for MitoTracker and NAD(P)H, respectively. Bar, 10 μm.
FIGURE 3.
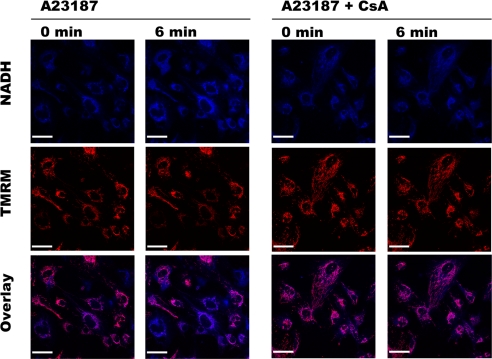
Double channel imaging of NAD(P)H autofluorescence and mitochondrial electrical membrane potential. HMEC-1 cells loaded with 10 nm TMRM in the absence or presence of 1 μm CsA were exposed to 0.05 μm A23187. The fluorescence of NAD(P)H (blue) and TMRM (red) was imaged simultaneously every 3 min. Bar, 44 μm. NAD(P)H fluorescence (quantified as in Fig. 1) increased from 100 (AU) at 0 min to 226 (AU) at 6 min in the absence of CsA, whereas it increased from 100 (AU) at 0 min to 114 (AU) at 6 min in the presence of CsA.
To test whether the increase in NAD(P)H fluorescence area was due to mitochondrial swelling, HMEC-1 cells loaded with MitoTracker Green were observed in three dimensions by confocal microscopy while being exposed to the same concentration of A23187. MitoTracker Green accumulates in polarized mitochondria, where it reacts with thiols to form aldehydefixable conjugates. Because most of the MitoTracker Green remains in mitochondria after depolarization (28), this is a suitable probe for analysis of mitochondrial morphology in conditions in which membrane potential may change.
As shown in Fig. 2 (upper panels), although the mitochondrial network morphology changed with time (because of the physiological processes of fusion, fission, and movement), A23187-induced PTP opening did not affect MitoTracker Green volume (i.e. the entire mitochondrial volume). As expected, PTP opening led to an increase in the total NAD(P)H fluorescence in terms of both intensity and volume distribution (result not shown). However, the mitochondrial NAD(P)H autofluorescence remained almost unchanged (Fig. 2, middle panels), whereas the NAD(P)H autofluorescence outside mitochondria dramatically increased (Fig. 2, lower panels).
To study the relationship between NAD(P)H localization and mitochondrial membrane potential, HMEC-1 cells loaded with TMRM were exposed to the same concentration of A23187. Although PTP opening affected NAD(P)H fluorescence in every cell, it decreased mitochondrial membrane potential in a subpopulation of cells only (Fig. 3, left panels). As expected, NAD(P)H and TMRM signals did not change when CsA prevented PTP opening (Fig. 3, right panels). These data indicate that our protocol induced PTP opening in every HMEC-1 cell. However, PTP opening was permanent only in cells in which membrane potential was collapsed, whereas it was transient in cells that maintained their membrane potential.
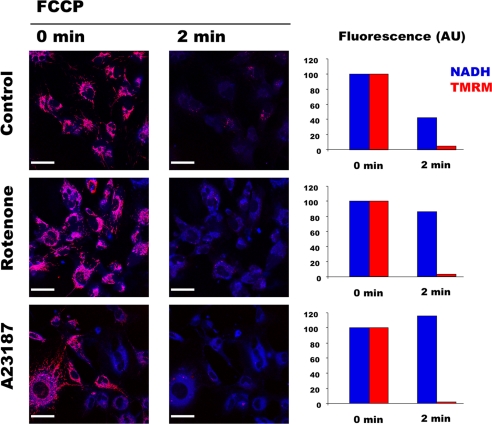
Because membrane potential and NAD(P)H redox potential are known to be in thermodynamic equilibrium via Complex 1, one would expect that NAD(P)H fluorescence decreases with membrane potential, but this was not the case (Fig. 3, left panels). To clarify this issue, HMEC-1 cells loaded with TMRM were exposed to the uncoupler FCCP in control condition, in the presence of rotenone, or after A23187-induced PTP opening (Fig. 4). As expected, mitochondrial depolarization was followed by a dramatic decrease in NAD(P)H fluorescence in normal conditions (Fig. 4, upper panel), whereas NAD(P)H fluorescence did not change and remained compartmentalized after mitochondrial depolarization when Complex 1 was inhibited with rotenone (Fig. 4, middle panel). Interestingly, NAD(P)H fluorescence did not fall after either transient or permanent PTP opening and was not affected when membrane potential was collapsed by FCCP (Fig. 4, lower panel). These results indicate that membrane potential and NAD(P)H redox potential were no longer in thermodynamic equilibrium after PTP opening.
FIGURE 4.
PTP opening dissociates redox and electrical membrane potentials. HMEC-1 cells loaded with 10 nm TMRM were exposed to vehicle (Control), 1 μm rotenone, or 0.05 μm A23187 for 6 min (omitted for clarity). The presented images correspond to the fluorescence of NAD(P)H (blue) and TMRM (red) imaged simultaneously before (0 min) and 2 min after the addition of 600 nm FCCP. NAD(P)H and TMRM quantification was calculated with the Volocity software. Fluorescence (AU) represents the whole fluorescence of the pixels with fluorescence intensity higher than a threshold value of 3 and 50 for TMRM and NAD(P)H, respectively. Bar, 44 μm.
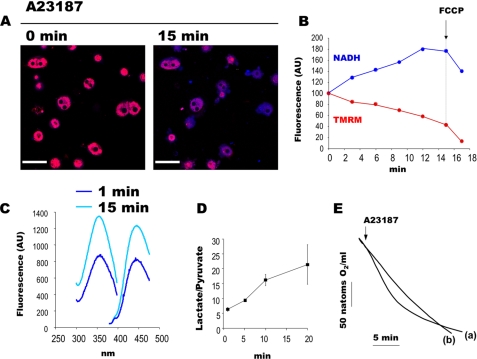
NAD(P)H autofluorescence depends on the concentration and redox status of pyridine nucleotides as well as on the microenvironment (29). To test whether the increase in NAD(P)H fluorescence intensity was due to a change in NAD(P)H content, nucleotides were extracted from cells for subsequent quantification. Because this experiment required a large amount of cells, this experiment was performed on isolated hepatocytes. As shown in Fig. 5, A and B, we first checked that A23187 induced an increase in NAD(P)H autofluorescence in hepatocytes. NAD(P)H extraction was then performed in parallel experiments. As shown in Fig. 5C, the NAD(P)H fluorescence spectrum measured 15 min after A23187 addition was dramatically higher than that after 1 min, whereas it remained constant over time in the absence of A23187 (not shown). This observation confirms that PTP opening increases NAD(P)H content in intact cells, as suggested by confocal imaging.
FIGURE 5.
PTP opening increases cellular NAD(P)H content and inhibits cell respiration in isolated hepatocytes. A and B, double channel imaging of NAD(P)H autofluorescence and mitochondrial electrical membrane potential of isolated hepatocytes loaded with 10 nm TMRM and exposed to 0.75 nmol of A23187/mg of hepatocytes (dry weight). The fluorescence of NAD(P)H (blue) and TMRM (red) was imaged simultaneously every 3 min. Bar, 44 μm. B, quantification was performed with the Volocity software as in Fig. 4. C, excitation-emission spectra of NAD(P)H extracted from isolated hepatocytes incubated in a Krebs-Henseleit-bicarbonate buffer at pH 7.4 containing 1.4 mm Ca2+ and 10 mm lactate plus 1 mm pyruvate, 1 and 15 min after the addition of 0.75 nmol of A23187/mg of hepatocytes (dry weight). D, the lactate/pyruvate ratio of hepatocytes incubated in a Krebs-Henseleit-bicarbonate buffer containing 1.4 mm Ca2+ and 20 mm dihydroxyacetone in the presence of 0.75 nmol of A23187/mg of hepatocytes (dry weight). Results are mean ± S.E. (error bars), n = 3. E, oxygen consumption rate of isolated hepatocytes incubated as in panel C in the presence (a) or absence (b) of 0.75 nmol of A23187/mg of hepatocytes (dry weight).
To test whether such an increase in NAD(P)H content occurred in mitochondria, in cytosol, or in both compartments, NAD(P)H extraction was performed after cell fractionation. A23187 addition did not significantly affect mitochondrial NAD(P)H content (not shown), suggesting that PTP opening increases cytosolic NAD(P)H content.
Because NAD(P)H can be either free or bound on proteins, we finally measured the lactate/pyruvate ratio, which is in equilibrium with the free cytosolic NADH. As shown in Fig. 5D, A23187 addition dramatically increased the lactate/pyruvate ratio, which remained unchanged in the control condition (not shown).
As seen in Fig. 5B, NAD(P)H fluorescence increased, whereas TMRM fluorescence decreased after PTP opening in hepatocytes. Moreover, chemical uncoupling dramatically decreased TMRM fluorescence but slightly decreased NAD(P)H fluorescence, which remained higher than that observed before PTP opening. In other words, as seen in HMEC-1 cells, membrane potential and NAD(P)H redox potential were no longer in thermodynamic equilibrium after PTP opening in hepatocytes as well.
Because this dissociation can be observed after respiratory chain inhibition, the oxygen consumption rate of hepatocytes was measured. In comparison with the control, A23187 led to a mild stimulation followed by a marked inhibition of oxygen consumption (Fig. 5E).
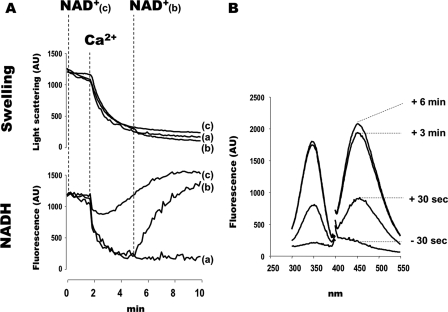
To clarify how the increase in extramitochondrial NAD(P)H could be generated after PTP opening, we next measured the NAD(P)H fluorescence of isolated rat liver mitochondria during Ca2+-induced PTP opening. As previously shown, PTP opening in vitro led to mitochondrial swelling and NAD(P)H oxidation (Fig. 6A, trace a). Under those conditions of incubation, mitochondrial pyridine nucleotides are released outside mitochondria, which decreases the availability of NAD+ for matrix dehydrogenases. This sets a limit for NADH synthesis, which becomes lower than NADH consumption; as a consequence, NAD(P)H fluorescence decreases.
FIGURE 6.
PTP opening increases extramitochondrial NAD(P)H content in isolated mitochondria incubated in the presence of NAD+. A, mitochondrial volume (upper panel) and NAD(P)H fluorescence (lower panel) of isolated mitochondria. The incubation medium contained 250 mm sucrose, 10 μm EGTA, 20 mm Tris-HCl, 5 mm Tris-Pi, 5 mm glutamate-Tris, 2.5 mm malate-Tris. The final volume was 2 ml, pH 7.4, at 30 °C. Experiments began with the addition of 1 mg of mitochondria. Where indicated, 500 μm Ca2+ (all traces) and 1 mm NAD+ (traces b and c) were added. B, excitation-emission spectra of extramitochondrial NAD(P)H. The experiment in panel A, trace b, was reproduced. 30 s before and 30 s and 3 and 6 min after the addition of 1 mm NAD+, 400 μl of suspension were removed and immediately centrifuged (8000 × g, 30 s). The supernatant was withheld for NAD(P)H measurement.
As shown in Fig. 6A (trace b), the addition of NAD+ after PTP opening led to an increase in NAD(P)H fluorescence, which finally exceeded the NAD(P)H fluorescence observed before PTP opening. When PTP opening was triggered in the presence of NAD+, the drop in NAD(P)H fluorescence was restricted and transient (Fig. 6A, trace c), and the final NAD(P)H fluorescence was higher than before PTP opening had occurred.
In parallel experiments, mitochondrial samples were withheld and immediately centrifuged to measure extramitochondrial NAD(P)H. As shown in Fig. 6B, extramitochondrial NAD(P)H concentration increased after PTP opening once NAD+ had been added. NAD(P)H did not appear outside mitochondria when NAD+ was added in the absence of PTP opening (data not shown). These data indicate that after PTP opening in the presence of NAD+, the following occurred: (i) NADH production exceeded NADH consumption, and (ii) the NADH produced by matrix dehydrogenase left mitochondria.
DISCUSSION
In this work, we have shown that A23187-induced PTP opening was followed by (i) the appearance of NAD(P)H outside mitochondria in the absence of obvious mitochondrial swelling and (ii) the rupture of the thermodynamic equilibrium between NAD(P)H redox potential and membrane potential. The appearance of NAD(P)H outside mitochondria after PTP opening suggests that part of NAD(P)H has left mitochondria. This is consistent with its concentration gradient and in accordance with results obtained with isolated mitochondria. Alternatively, a number of electrons from mitochondrial NAD(P)H may have left mitochondria to reduce cytosolic NAD(P)+ via enzymatic reactions after contact between the cytosolic and the mitochondrial pools of pyridine nucleotides. These two mechanisms are non-mutually exclusive and, in both cases, PTP opening dramatically increases the cytosolic NAD(P)H content.
After PTP opening in intact cells, not only does NAD(P)H appear outside mitochondria, but the total fluorescence of NAD(P)H dramatically increases (Figs. 1, 2, 3 and 5). The spectral quantification of cell extracts confirmed that NAD(P)H content increases after PTP opening (Fig. 5). Experiments performed with isolated mitochondria show that NADH is synthesized and exported outside mitochondria when PTP opening occurs in the presence of a physiological concentration (26) of NAD+ (Fig. 6). Under normal conditions, NAD(P)+-reducing and NAD(P)H-oxidizing processes are finely tuned. For example, the addition of rotenone (i.e. the inhibition of the main NADH-oxidizing pathway) slightly increases NADH matrix concentration, which in turn inhibits mitochondrial dehydrogenases that produce NADH. After PTP opening in intact cells, NADH oxidation decreased (because oxygen consumption decreased; Fig. 5), but this was not followed by an inhibition of the NAD(P)+-reducing pathways (because NAD(P)H content increased; Figs. 1, 2, 3 and 5). We hypothesize that this lack of inhibition was most probably because NADH did not accumulate in the matrix but either escaped from mitochondria or “exported” its reducing potential via the open PTP. The results in Fig. 6 support this hypothesis.
The results in Figs. 3, 4, 5 show that NAD(P)H was not oxidized anymore in depolarized mitochondria after PTP opening, suggesting that PTP opening had inhibited the respiratory chain. This was confirmed by the direct measurement of the oxygen consumption rate in intact hepatocytes (Fig. 5E). In isolated mitochondria, PTP opening inhibits Complex 1 activity via two mechanisms. Firstly, PTP opening leads to the release of pyridine nucleotides, which decreases the availability of NADH for Complex 1 (7). Secondly, PTP opening partly decreases the rotenone-sensitive NADH decylubiquinone reductase activity (i.e. Complex 1 activity), possibly via a conformational change of Complex 1 (10). Note that PTP opening does not inhibit the other complexes of the respiratory chain in isolated mitochondria (10). In intact cells, an indirect inhibition of Complex 1 due to a decrease in NADH availability is not expected to occur because NAD(P)H content increased after PTP opening (Fig. 5C). Therefore, the inhibition of respiration observed in intact cells after PTP opening suggests that PTP opening inhibits Complex 1 in intact cells, as it does in isolated mitochondria.
These findings led to the question as to whether transient PTP opening (i.e. calcein and NAD(P)H decompartmentalization in the absence of mitochondrial depolarization) corresponded to a continuous channel flickering or to one single reversible opening. Careful examination of the kinetic of NAD(P)H fluorescence indicates that the observed increase was a continuous process that reached a plateau 15–30 min after A23187 addition (not shown). Because this lengthy process is not compatible with one single reversible opening, this observation indirectly suggests that the transient PTP opening observed in this study corresponds to a continuous channel flickering.
It must be emphasized that transient PTP opening had permanent consequences in intact cells. As shown in Fig. 4, the addition of FCCP did not decrease NAD(P)H fluorescence in cells where transient PTP openings had taken place, indicating that the respiratory chain was also inhibited in that condition. Therefore, the double channel imaging of NAD(P)H autofluorescence and mitochondrial electrical membrane potential before and after uncoupling represents a new technical approach to easily distinguish transient and permanent PTP opening on the same cell population.
The inhibition of the respiratory chain in isolated mitochondria leads to mitochondrial depolarization unless mitochondria are incubated in the presence of ATP. In that particular condition, the uptake of ATP via the adenine nucleotide translocator and its hydrolysis via the F1F0-ATPase maintain the membrane potential. In intact cells, the inhibition of Complex 1 by rotenone did not abolish mitochondrial membrane potential (Fig. 4) unless ATPase was inhibited by oligomycin (data not shown). This indicates that, during the time course of our experiments, glycolysis provided enough ATP to sustain the mitochondrial membrane potential when Complex 1 was inhibited.
Considering on one hand the cytosolic oncotic pressure in intact cells and the fact that PTP opening does not lead to mitochondrial swelling in the absence of oncotic pressure gradient on the other hand, PTP opening is not expected to lead to an immediate mitochondrial swelling in intact cells because there is no oncotic pressure gradient in that particular condition. This gradient increases secondarily when cytosolic proteins undergo degradation by proteolysis or are released through a leaky plasma membrane. In other words, PTP-dependent mitochondrial swelling (e.g. Ref. 30) should be regarded as a delayed consequence of PTP opening. Consistent with this view, the results in Figs. 1 and 2 indicate that the diffusion of cobalt inside mitochondria and the appearance of NAD(P)H outside mitochondria occurred without obvious mitochondrial swelling. This observation is in accordance with previous reports that suggest that PTP opening does not immediately induce a large mitochondrial swelling in intact cells (19).
CONCLUSION
By analogy with what occurs in isolated mitochondria, it has initially been proposed that PTP opening in intact cells leads to the collapse of the proton-motive force, disruption of ionic homeostasis, mitochondrial swelling, and massive ATP hydrolysis by the ATPase. This first scenario was then supplemented by the observation that PTP opening in intact cells may not systematically lead to mitochondrial depolarization (16) or mitochondrial swelling (19), whereas it induced a dramatic increase in reactive oxygen species production (31).
The present work shows that because PTP opening inhibits mitochondrial NADH-consuming processes on one hand and allows the export of the reducing power of NAD(P)H outside mitochondria on the other hand, it dramatically affects the redox potential of the cytosol. A focus for future study is whether this sequence of events plays a key role in the potentially deleterious consequences of PTP opening in intact cells.
Acknowledgments
We thank Anne Devin, Michel Rigoulet, and Paolo Bernardi for helpful discussions and critical reading of the manuscript. We also thank Gareth Butt for the English corrections to this paper.
This work was supported by grants from INSERM, Agence Nationale de la Recherche (PTPischemia), and the Ministère de l'Enseignement de la Recherche et de la Technologie.
Footnotes
The abbreviations used are: PTP, permeability transition pore; CsA, cyclosporin A; TMRM, tetramethylrhodamine methyl ester; FCCP, carbonyl cyanide p-trifluoromethoxyphenylhydrazone; MOPS, 4-morpholinepropane-sulfonic acid; AU, arbitrary units.
References
- 1.Zoratti, M., and Szabo, I. (1995) Biochim. Biophys. Acta 1241 139-176 [DOI] [PubMed] [Google Scholar]
- 2.Bernardi, P., Krauskopf, A., Basso, E., Petronilli, V., Blachly-Dyson, E., Di Lisa, F., and Forte, M. A. (2006) FEBS J. 273 2077-2099 [DOI] [PubMed] [Google Scholar]
- 3.Baines, C. P., Kaiser, R. A., Purcell, N. H., Blair, N. S., Osinska, H., Hambleton, M. A., Brunskill, E. W., Sayen, M. R., Gottlieb, R. A., Dorn, G. W., Robbins, J., and Molkentin, J. D. (2005) Nature 434 658-662 [DOI] [PubMed] [Google Scholar]
- 4.Nakagawa, T., Shimizu, S., Watanabe, T., Yamaguchi, O., Otsu, K., Yamagata, H., Inohara, H., Kubo, T., and Tsujimoto, Y. (2005) Nature 434 652-658 [DOI] [PubMed] [Google Scholar]
- 5.Schinzel, A. C., Takeuchi, O., Huang, Z., Fisher, J. K., Zhou, Z., Rubens, J., Hetz, C., Danial, N. N., Moskowitz, M. A., and Korsmeyer, S. J. (2005) Proc. Natl. Acad. Sci. U. S. A. 102 12005-12010 [DOI] [PMC free article] [PubMed] [Google Scholar]
- 6.Palmieri, F. (2004) Pfluegers Arch. Eur. J. Physiol. 447 689-709 [DOI] [PubMed] [Google Scholar]
- 7.Fontaine, E., Eriksson, O., Ichas, F., and Bernardi, P. (1998) J. Biol. Chem. 273 12662-12668 [DOI] [PubMed] [Google Scholar]
- 8.Vinogradov, A., Scarpa, A., and Chance, B. (1972) Arch. Biochem. Biophys. 152 646-654 [DOI] [PubMed] [Google Scholar]
- 9.Massari, S., and Azzone, G. F. (1972) Biochim. Biophys. Acta 283 23-29 [DOI] [PubMed] [Google Scholar]
- 10.Batandier, C., Leverve, X., and Fontaine, E. (2004) J. Biol. Chem. 279 17197-17204 [DOI] [PubMed] [Google Scholar]
- 11.Haworth, R. A., and Hunter, D. R. (1979) Arch. Biochem. Biophys. 195 460-467 [DOI] [PubMed] [Google Scholar]
- 12.Crompton, M., Costi, A., and Hayat, L. (1987) Biochem. J. 245 915-918 [DOI] [PMC free article] [PubMed] [Google Scholar]
- 13.Petronilli, V., Nicolli, A., Costantini, P., Colonna, R., and Bernardi, P. (1994) Biochim. Biophys. Acta 1187 255-259 [DOI] [PubMed] [Google Scholar]
- 14.Nieminen, A. L., Saylor, A. K., Tesfai, S. A., Herman, B., and Lemasters, J. J. (1995) Biochem. J. 307 99-106 [DOI] [PMC free article] [PubMed] [Google Scholar]
- 15.Petronilli, V., Miotto, G., Canton, M., Brini, M., Colonna, R., Bernardi, P., and Di Lisa, F. (1999) Biophys. J. 76 725-734 [DOI] [PMC free article] [PubMed] [Google Scholar]
- 16.Petronilli, V., Penzo, D., Scorrano, L., Bernardi, P., and Di Lisa, F. (2001) J. Biol. Chem. 276 12030-12034 [DOI] [PubMed] [Google Scholar]
- 17.Huser, J., and Blatter, L. A. (1999) Biochem. J. 343 311-317 [PMC free article] [PubMed] [Google Scholar]
- 18.Precht, T. A., Phelps, R. A., Linseman, D. A., Butts, B. D., Le, S. S., Laessig, T. A., Bouchard, R. J., and Heidenreich, K. A. (2005) Cell Death Differ. 12 255-265 [DOI] [PubMed] [Google Scholar]
- 19.De Giorgi, F., Lartigue, L., Bauer, M. K., Schubert, A., Grimm, S., Hanson, G. T., Remington, S. J., Youle, R. J., and Ichas, F. (2002) FASEB J. 16 607-609 [DOI] [PubMed] [Google Scholar]
- 20.Di Lisa, F., Menabo, R., Canton, M., Barile, M., and Bernardi, P. (2001) J. Biol. Chem. 276 2571-2575 [DOI] [PubMed] [Google Scholar]
- 21.Berry, M. N., and Friend, D. S. (1969) J. Cell Biol. 43 506-520 [DOI] [PMC free article] [PubMed] [Google Scholar]
- 22.Groen, A. K., Sips, H. J., Vervoorn, R. C., and Tager, J. M. (1982) Eur. J. Biochem. 122 87-93 [DOI] [PubMed] [Google Scholar]
- 23.Koopman, W. J., Distelmaier, F., Esseling, J. J., Smeitink, J. A., and Willems, P. H. (2008) Methods (San Diego) 46 304-311 [DOI] [PubMed] [Google Scholar]
- 24.Devin, A., Guerin, B., and Rigoulet, M. (1997) FEBS Lett. 410 329-332 [DOI] [PubMed] [Google Scholar]
- 25.Zuurendonk, P. F., Tischler, M. E., Akerboom, T. P., Van Der Meer, R., Williamson, J. R., and Tager, J. M. (1979) Methods Enzymol. 56 207-223 [DOI] [PubMed] [Google Scholar]
- 26.Bergmeyer, H. U. (1974) Methods in Enzymatic Analysis, Verlag Chemie Weinheim Academic Press, Inc., New York, New York
- 27.Detaille, D., Guigas, B., Chauvin, C., Batandier, C., Fontaine, E., Wiernsperger, N., and Leverve, X. (2005) Diabetes 54 2179-2187 [DOI] [PubMed] [Google Scholar]
- 28.Elmore, S. P., Nishimura, Y., Qian, T., Herman, B., and Lemasters, J. J. (2004) Arch. Biochem. Biophys. 422 145-152 [DOI] [PubMed] [Google Scholar]
- 29.Blinova, K., Carroll, S., Bose, S., Smirnov, A. V., Harvey, J. J., Knutson, J. R., and Balaban, R. S. (2005) Biochemistry 44 2585-2594 [DOI] [PubMed] [Google Scholar]
- 30.Friberg, H., Ferrand-Drake, M., Bengtsson, F., Halestrap, A. P., and Wieloch, T. (1998) J. Neurosci. 18 5151-5159 [DOI] [PMC free article] [PubMed] [Google Scholar]
- 31.Zorov, D. B., Filburn, C. R., Klotz, L. O., Zweier, J. L., and Sollott, S. J. (2000) J. Exp. Med. 192 1001-1014 [DOI] [PMC free article] [PubMed] [Google Scholar]


