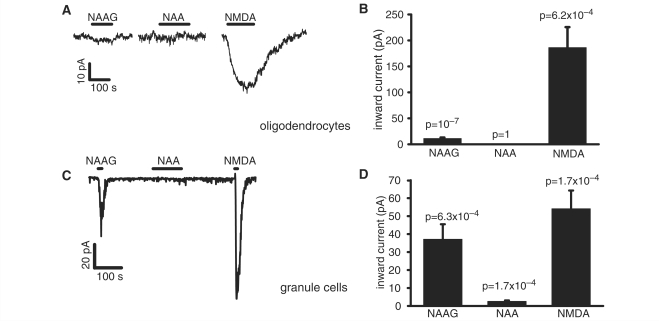
Figure 2.
NAAG, NAA and NMDA-evoked whole cell currents at –74 mV in white matter oligodendrocytes and cerebellar granule cells. (A) Representative trace shows current response to 1 mM NAAG, 1 mM NAA and 60 µM NMDA in a single oligodendrocyte. (B) Average responses to 1 mM NAAG (n = 20 cells), 1 mM NAA (n = 5) and 60 µM NMDA (n = 12) in oligodendrocytes. (C) Representative trace shows response to 1 mM NAAG, 1 mM NAA and 60 µM NMDA in a single granule cell. (D) Average responses to 1 mM NAAG (n = 14), 1 mM NAA (n = 14) and 60 µM NMDA (n = 13) in granule cells.

