Abstract
The intracellular Ca2+ receptor calmodulin (CaM) coordinates responses to extracellular stimuli by modulating the activities of its various binding proteins. Recent reports suggest that, in addition to its familiar functions in the cytoplasm, CaM may be directly involved in rapid signaling between cytoplasm and nucleus. Here we show that Ca2+-dependent nuclear accumulation of CaM can be reconstituted in permeabilized cells. Accumulation was blocked by M13, a CaM antagonist peptide, but did not require cytosolic factors or an ATP regenerating system. Ca2+-dependent influx of CaM into nuclei was not blocked by inhibitors of nuclear localization signal-mediated nuclear import in either permeabilized or intact cells. Fluorescence recovery after photobleaching studies of CaM in intact cells showed that influx is a first-order process with a rate constant similar to that of a freely diffusible control molecule (20-kDa dextran). Studies of CaM efflux from preloaded nuclei in permeablized cells revealed the existence of three classes of nuclear binding sites that are distinguished by their Ca2+-dependence and affinity. At high [Ca2+], efflux was enhanced by addition of a high affinity CaM-binding protein outside the nucleus. These data suggest that CaM diffuses freely through nuclear pores and that CaM-binding proteins in the nucleus act as a sink for Ca2+-CaM, resulting in accumulation of CaM in the nucleus on elevation of intracellular free Ca2+.
Calmodulin (CaM) is a ubiquitous intracellular Ca2+ receptor involved in transducing a variety of extracellular signals that use Ca2+ as a second messenger. CaM functions through regulating the activities of its targets (CaM-binding proteins) and has no intrinsic enzymatic activity. Although most CaM-binding proteins so far identified are of cytoplasmic origin, CaM also may have important functions in the nucleus. A relatively high concentration of CaM has been found in the nucleus of all cell types (1). The level of CaM in the nucleus is dynamically regulated during the cell cycle (2), and several mitotic targets for CaM have been identified in yeast (3, 4). Reducing nuclear CaM activity with the inhibitory peptide M13 blocks DNA synthesis and cell cycle progression in COS-7 cells and disrupts nuclear structure (5). Members of the basic helix-loop-helix (bHLH) and basic leucine zipper (bZIP) families of transcription factors have been shown to be regulated by CaM, suggesting a role for CaM in the control of gene expression (6, 7). Several lines of evidence suggest that CaM may directly mediate excitation–transcription coupling by carrying Ca2+ signals from the cytoplasm to the nucleus. Increased nuclear CaM levels reportedly accompany the induction of c-fos expression in the central nervous system (8). It has been shown that cytoplasmic CaM in cultured smooth muscle cells translocates into the nucleus on elevation of intracellular free Ca2+ (9). In hippocampal neurons, translocation of cytoplasmic CaM into the nucleus appears to be required for the phosphorylation of nuclear cAMP responsive element-binding protein (CREB) in response to calcium influx through voltage-gated plasma membrane channels (10). Thus, understanding the mechanism of Ca2+-dependent translocation of CaM into the nucleus is crucial for understanding its functions in this compartment.
In eukaryotic cells, nucleocytoplasmic trafficking is regulated through the nuclear pore complexes (NPCs) that reside in the nuclear envelope. The NPC is a large, multiprotein structure with a molecular mass of ≈125 MDa. In the center of the complex is a 10-nm-diameter diffusion channel that allows free passage of molecules smaller than ≈60 kDa in molecular mass (11, 12). Nucleocytoplasmic trafficking of molecules larger than this cutoff is an energy-dependent process and requires nuclear import or export signals embedded in the primary structure of the molecule. Two of the best characterized import signals are the nuclear localization signal (NLS) and the M9 signal (13, 14). Signal-mediated import requires the assistance of cytosolic factors, such as the karyopherins or M9 binding proteins, as well as the activity of Ran GTPase, a small G protein that shuttles between nucleus and cytoplasm (reviewed in refs. 13 and 14). In permeabilized cells, import is generally inhibited by addition of a nonhydrolyzable analog of GTP (GTPγS), preincubation of cells with wheat germ agglutinin (WGA), or low temperature, and these treatments are commonly used to distinguish signal-mediated import from diffusional import mechanisms (15, 16).
Based on the current understanding of transport through the NPC, we proposed and tested two simple models for Ca2+-dependent translocation of cytoplasmic CaM into the nucleus. Because CaM is small enough to pass through the diffusion channel and lacks identifiable import signals, one possible mechanism is that Ca2+-CaM diffuses across the nuclear envelope through NPC and is retained in the nucleus by binding to nuclear CaM-binding proteins. Alternatively, CaM may be actively transported across the nuclear envelope as part of a complex with a cytoplasmic protein that contains a nuclear import signal. We developed a fluorescence assay for Ca2+-dependent accumulation of CaM in the nucleus of permeabilized cells. The characteristics of accumulation led us to conclude that CaM diffuses freely through NPC and that nuclear CaM-binding proteins act as a sink for Ca2+-CaM. This conclusion was supported by fluorescence imaging and fluorescence recovery after photobleaching (FRAP) studies of fluoresceinated CaM (fl-CaM) microinjected into intact cells. Our data suggest that the steady state level of CaM in the nucleus depends on both the intracellular concentration of free Ca2+ and the relative concentration and affinity of CaM-binding proteins in the nucleus and cytoplasm.
MATERIALS AND METHODS
Cell Culture.
A7r5 cells (ATCC CRL-1444) were obtained from the American Type Culture Center. Cells were cultured in DMEM (GIBCO/BRL) and were passaged according to the supplier’s instructions. For experiments, cells were grown to confluence on coverslips and then were starved by reducing serum to 0.2% for 24–48 hr before use to enhance their smooth muscle phenotype.
Preparation of Fluoresceinated Calmodulin, Microinjection, Ionomycin Treatment, and Fluorescence Ratio Imaging.
Recombinant calmodulin with a cysteine substitution at the third residue was purified and conjugated with iodoacetamidofluorescein (fl-CaM) as described (9). Microinjection, agonist treatment, and fluorescence imaging were performed as described (9). In brief, fl-CaM (0.4 mg/ml) and 10-kDa rhodamine-dextran (0.5 mg/ml, Molecular Probes) were dissolved in 2.5 mM Pipes (pH 6.9) with 0.05 mM MgCl2. The mixture then was microinjected into the cytoplasm of A7r5 cells by using an Eppendorf microinjector 5242 and a Narishige (Tokyo) MO-202 micromanipulator mounted on a Zeiss Axiovert 35 microscope. The volume injected was estimated to be ≤10% of the cell volume. After injection, coverslips containing A7r5 cells were mounted in a sealed perfusion chamber and were maintained at 37°C as described (9). Ionomycin (Calbiochem) was dissolved in DMEM to a final concentration of 1 μM and then was perfused into the chamber. Digital fluorescence images were acquired by using a Quantix cooled charge-coupled device camera (Photometrics, Tucson, AZ) mounted on a Zeiss Axiovert 135 epifluorescence microscope. The light source shutter and the camera were controlled by oncor image software running on a PowerMac 8600/300 with 128 megabytes of RAM. Fluorescein and rhodamine channels were selected through narrow bandpass interference filters (Omega Optical, Brattleboro, VT). Floating point ratio images were calculated with the Oncor image software after background subtraction as described (9). For comparison of sequential images of the same field, the integrated fluorescence intensity of fl-CaM within the cells was normalized to account for photobleaching. In some experiments, fluoresceinated BSA with a nuclear localization sequence attached (fl-NLS-BSA) was microinjected at a needle concentration of 2 mg/ml.
Nuclear Import Assay.
Nuclear import assays were performed as described (17, 18) with some modifications. Cells grown on 22-mm2 coverslips were washed three times with 2 ml of ice-cold import buffer (100 mM Hepes, pH 7.3/110 mM KOAc/2 mM Mg(OAc)2/1 mM EGTA/2 mM DTT/1 mg/ml each of leupeptin, pepstatin, and aprotinin). Cells then were permeabilized for 5 min with ice-cold import buffer containing 12.5 μg/ml digitonin (Calbiochem). Cells subsequently were washed twice with 2 ml of ice-cold import buffer and then two more times with 2 ml of ice-cold import buffer containing a defined concentration of free Ca2+ (Ca import buffer). This was made by adding an appropriate amount of concentrated CaCl2 to the import buffer according to the computer program of Chang et al. (19). The concentration of free Ca2+ in the buffers was confirmed by using a calcium buffer calibration kit (Cat C3008, Molecular Probes) with the fluorescent Ca2+ indicator fluo 3 (Cat F3715, Molecular Probes). Fifty microliters of the import mix then was added to each 22-mm2 coverslip. The import mix contained transport ligands [0.07 mg/ml fl-CaM or 0.04 mg/ml fl-NLS-BSA, and 0.08 mg/ml rhodamine isothiocyanate (RITC)–BSA], 3 mg/ml HeLa cell cytosol, and an ATP regenerating system (0.8 mM ATP/4 mM creatine phosphate/4 units/ml creatine phosphate kinase) in the defined Ca import buffer. EGTA was dialyzed out of the HeLa cell extract before use. After 30 min in a humidified 37°C chamber, cells were rinsed briefly with 2 ml of Ca import buffer and then were fixed with 2 ml of the same buffer containing 6.7% formaldehyde for 15 min at room temperature. Finally, the cells were mounted on a slide and were viewed immediately on a Zeiss Axiovert 135 epifluorescence microscope. Digital fluorescence images were acquired as above, and fluorescence intensities were quantified by using Oncor image software. In some experiments, 1 μM GTPγS was included during import. Other samples were incubated with 1 mg/ml WGA for 5 min before addition of transport ligands. For chilling experiments, cells were chilled on ice for 15 min before permeabilization and were incubated on ice during the transport reaction. These cells then were washed with cold import buffer and were fixed at room temperature before viewing.
Preparation and Use of CaM-Biotin-Avidin-RITC (CBAR).
Recombinant CaM was conjugated with biotin (CaM-biotin) as described (20). CaM-biotin in PBS was incubated with an equimolar amount of avidin-RITC (Sigma) for 30 min. Unreacted CaM-biotin was removed by incubating the reaction mixture with avidin-agarose (Sigma). Unbound avidin and inactive complexes were removed by loading the mixture on phenyl-Sepharose in PBS containing 0.2 mM CaCl2, followed by extensive washing at 0.2 mM CaCl2 and elution with 1 mM EGTA. Permeabilized cells were preincubated with 4 μM CBAR for 5 min before the nuclear import assay was initiated by addition of fl-CaM.
FRAP Measurements of Nuclear Influx.
Nuclear influx in intact cells was examined by FRAP as described by Peters (21, 22). In brief, fl-CaM or fl-dextran (20 kDa) was microinjected into living cells and was allowed to equilibrate between the cytoplasm and the nucleus. Fluorescence inside the nucleus was depleted by photobleaching by using an argon ion laser focused to a spot 4.6 μm in radius. Fluorescence recovery was monitored as described (9). Fractional fluorescence recovery (R) at each timepoint (t) was calculated as
 |
where F(max) is the plateau fluorescence intensity, F(t) is the fluorescence intensity at time t, and F(0) is the fluorescence intensity at time t = 0. For passive diffusion of a molecule across the nuclear envelope, the long time relaxation of the bleach pattern has first order kinetics. Thus, R increases as e−kt, where k is the rate constant of influx. ln (1/R) vs. t was plotted by using delta graph pro 3.5 (DeltaPoint, Monterey, CA). Linearity of the plot was taken as indicating passive diffusion, and k was determined from the slope of the plots.
RESULTS
Accumulation of CaM in the Nuclei of Permeabilized Cells Is a Function of Ca2+ Concentration and Requires CaM-Specific Protein–Protein Interactions.
We adapted the in vitro nuclear import assay of Adam et al. (17) to study the Ca2+-dependent nuclear uptake of fluoresceinated CaM (fl-CaM) in a smooth muscle cell line (A7r5). Nuclear import was carried out in Ca-EGTA buffers to adjust the free [Ca2+] over the physiological range (100 nM–1 μM) (23, 24). Rhodamine-BSA (RITC-BSA) was included in the import mix as an internal control to verify the integrity of the nuclear envelope in each cell. Import was followed by a 5-min wash at the same concentration of free Ca2+ to allow diffusion of unbound fl-CaM out of the nucleus before fixation. The fluorescence intensity in the nucleus after fixation was taken as a measure of specific uptake and retention of fl-CaM. Uptake of fl-NLS-BSA was used as a positive control for NLS-mediated import in all experiments.
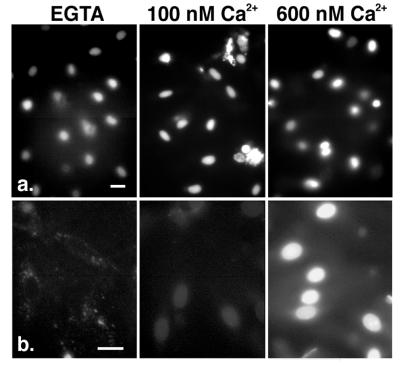
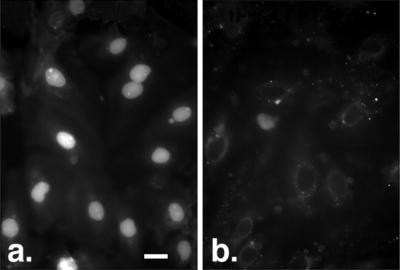
We found that the extent of nuclear import of fl-NLS-BSA was the same regardless of the concentration of free Ca2+ in the buffer (Fig. 1a). In contrast, the extent of nuclear accumulation of fl-CaM was strongly Ca2+-dependent. Nuclear fl-CaM was nearly undetectable when import was carried out in the absence of free Ca2+ but increased in a graded manner as free Ca2+ was varied from 0 to 600 nM (Fig. 1b). The fluorescence intensity within the nucleus at 600 nM free Ca2+ was 5-fold higher than at 100 nM free Ca2+. The assay was not extended to higher free Ca2+ concentrations because at ≥1 μM many nuclei became permeable to RITC-BSA (data not shown). Nuclear accumulation of fl-CaM was completely abolished when import was carried out in the presence of M13 peptide, a high affinity antagonist of CaM binding to target proteins (Fig. 2).
Figure 1.
Reconstitution of Ca2+-dependent nuclear accumulation of CaM in permeabilized cells. (a) The extent of import of fl-NLS-BSA into nuclei is unaffected by changes in free Ca2+. (b) The amount of fl-CaM found in the nucleus increases with increasing concentration of free Ca2+ in the import buffer. Note that cytoplasmic binding of fl-CaM is also a function of Ca2+ concentration. Bars represent 25 μm.
Figure 2.
Nuclear accumulation of fl-CaM is blocked by 0.1 mg/ml M13, a peptide that specifically blocks CaM binding to targets. (a) fl-CaM alone. (b) fl-CaM plus M13. The free Ca2+ concentration was 600 nM. (Bar = 25 μm.)
Cytosolic Factors Are Not Required for Nuclear Accumulation of CaM.
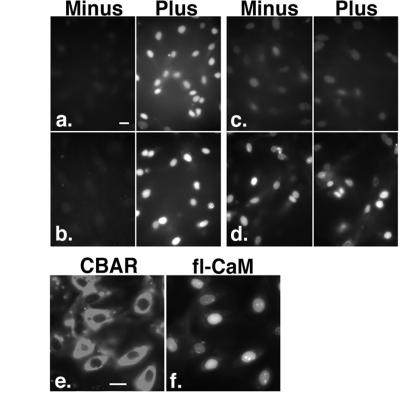
Nuclear import of fl-NLS-BSA was strongly dependent on added HeLa cytoplasmic extract and an ATP regenerating system regardless of Ca2+ concentration (Fig. 3 a and b). In contrast, these components had no effect on the extent of nuclear accumulation of fl-CaM (Fig. 3 c and d). To rule out the involvement of endogenous cytosolic factors remaining in permeabilized cells, a CaM-biotin-avidin-RITC conjugate (CBAR) was used to trap cytoplasmic CaM-binding proteins. CBAR retained calmodulin activity as judged by Ca2+-dependent binding to phenyl-Sepharose and was restricted to the cytoplasm, presumably because its large size (≥81 kDa) prevents it from passing through the NPC (Fig. 3e). Preincubation of permeabilized cells with 4 μM CBAR for 5 min before the addition of fl-CaM had no effect on the extent of Ca2+-dependent nuclear accumulation of fl-CaM (Fig. 3f).
Figure 3.
Cytosolic factors are not required for nuclear accumulation of CaM. Nuclear uptake assays were performed without (Minus) and with (Plus) the addition of HeLa cell cytosol and an ATP regenerating system to the permeablized cells. (a) fl-NLS-BSA, 100 nM Ca2+. (b) fl-NLS-BSA, 600 nM Ca2+. (c) fl-CaM, 100 nM Ca2+. (d) fl-CaM, 600 nM Ca2+. Preincubation with 4 μM CBAR to trap cytoplasmic CaM-binding proteins remaining in permeabilized cells also did not block nuclear uptake of fl-CaM. (e) CBAR binds to sites in the cytoplasm but does not enter the nucleus. (f) fl-CaM uptake is not diminished in the same cells as e. (Bars = 25 μm.)
Nuclear Accumulation of CaM Is Not Affected by Inhibition of NLS-Mediated Import.
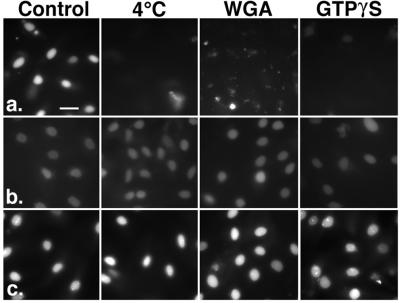
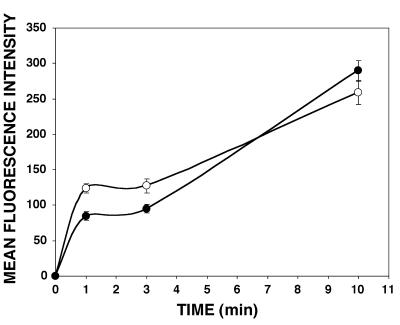
In permeabilized cells, nuclear import of fl-NLS-BSA was completely abolished by chilling to 4°C or preincubation with 1 mg/ml WGA and was strongly inhibited by inclusion of 1 μM GTPγS in the import mix (Fig. 4a). In contrast, nuclear accumulation of fl-CaM was unaffected by any of these treatments, regardless of Ca2+ concentration (Fig. 4 b and c). Previous reports suggested that saturation of the nuclear import machinery might result in diffusional entry of small molecules that undergo facilitated import at lower concentrations (25, 26). To be sure that saturation had not caused us to overlook facilitated import, we tested the effects of chilling on nuclear accumulation of a 10-fold lower concentration of fl-CaM. The mean fluorescence intensity in the nucleus after uptake at 37°C (203.41 ± 3.96 SEM, n = 45) was not reduced when uptake was carried out at 4°C (244.4 ± 3.81 SEM, n = 42). Deisseroth et al. (10) reported that the initial rate of calmodulin translocation into the nucleus after stimulation of hippocampal neurons was significantly slowed by chilling to 4°C and suggested facilitated uptake of calmodulin as a possible explanation. In contrast, we found that chilling had little effect on the early timecourse of fl-CaM uptake in permeablized A7r5 cells (Fig. 5). The slight lag in uptake in the first 3 min at 4°C is completely within the limits of the 2-fold slower diffusion that is expected at the lower temperature.
Figure 4.
Nuclear accumulation of CaM in permeabilized cells is unaffected by inhibitors of NLS-mediated import. Import of fl-NLS-BSA was blocked by chilling, 1 mg/ml WGA or 1 μM GTPγS (a). Nuclear accumulation of fl-CaM was unaffected by these treatments [100 nM free Ca2+ (b); 600 nM free Ca2+ (c)]. (Bar = 25 μm.)
Figure 5.
The timecourse of CaM accumulation is unaffected by chilling. Permeablized cells were fixed after 1, 3 and 10 min of exposure to f1-CaM at 37°C (open circles) and 4°C (filled circles). Nuclear fluorescence intensity was measured by fluorescence microscopy. The slight lag in uptake in the chilled cells can be completely accounted for by the expected 2-fold decrease in diffusion coefficient caused by the lower temperature.
Nuclear Accumulation of Calmodulin in Intact Cells.
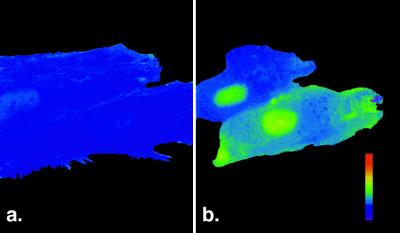
To better characterize nuclear accumulation of calmodulin in intact cells, fl-CaM was coinjected with rhodamine-dextran as a volume marker, and ratio imaging was used to map the relative concentration of fl-CaM in different cellular compartments. As previously described for primary smooth muscle cells (9), fl-CaM readily entered the nucleus of intact A7r5 cells after microinjection into the cytoplasm. The entry of fl-CaM into the nuclei of resting cells was not blocked by chilling (data not shown) or coinjection of 2 mg/ml WGA (Fig. 6a). WGA also had no effect on Ca2+-dependent translocation of cytoplasmic CaM into the nucleus. After perfusion of the cultures with 1 μM ionomycin in DMEM, 85% of the injected cells exhibited an increase in nuclear fl-CaM accompanied by a decrease in cytoplasmic fl-CaM (Fig. 6b). A similar percentage of cells exhibited translocation of fl-CaM into the nucleus in the absence of WGA. Under the same conditions, NLS-mediated import of fl-NLS-BSA was completely blocked by WGA in 55% of cells. In the absence of WGA, all cells showed robust import of fl-NLS-BSA into the nucleus.
Figure 6.
Ca2+-dependent translocation of CaM into the nucleus of intact cells is not arrested by WGA. Cells were microinjected with 0.4 mg/ml fl-CaM, 2 mg/ml WGA, and 1 mg/ml 10 kDa RITC-dextran. Ratio imaging using RITC-dextran as a volume marker was used to map the relative concentration of fl-CaM in different compartments of the cell. (a) Before ionomycin treatment, the concentration of CaM in the nucleus was similar to or slightly higher than its concentration in the cytoplasm. (b) After perfusion with 1 μM ionomycin in DMEM, CaM was more concentrated in the nucleus than the cytoplasm. Comparison of a and b shows that ionomycin also induced contraction of these cells. Eight minutes elapsed between a and b.
Flux Measurement by FRAP Indicates Passive Diffusion of CaM Through NPCs.
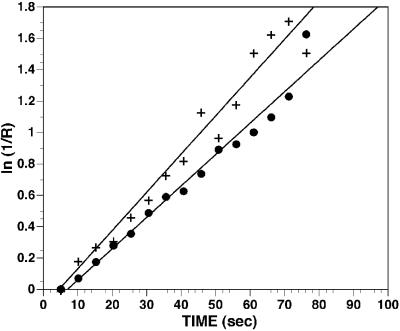
The lack of requirement for cytosolic factors and the persistence of nuclear uptake of fl-CaM when NLS-mediated import was blocked suggested that CaM diffuses passively across NPCs at both resting and elevated levels of intracellular free Ca2+. To test this more directly, fl-dextran (20 kDa) or fl-CaM was microinjected into the cytoplasm of living cells, and nuclear influx was examined by FRAP (22). After allowing 30 min for the equilibration of the injected molecule between nucleus and cytoplasm, ≈50% of the nuclear fluorescence was photobleached (see Materials and Methods), and the subsequent recovery of fluorescence was monitored. Although the initial portion of the recovery curve originates from diffusion of the fluorophore within the nucleus, at longer times, the kinetics of fluorescence recovery reflect the rate of influx of the fluorophore into the nucleus from the cytoplasm. For each data record, the fractional recovery (R) as a function of time (t) was calculated (see Materials and Methods). For both fl-CaM and 20-kDa dextran, ln(1/R) was a linear function of time, as expected for a relaxation with first order kinetics (Fig. 7). The mean influx rate constant (k) was 0.0134 ± 0.0011 (n = 13) for fl-CaM and 0.0129 ± 0.0037 (n = 10) for 20-kDa dextran. These values are not significantly different from one another (P < 0.05) and are similar to a value of 0.0196 ± 0.0069 obtained for 20-kDa dextran in another cell type (22).
Figure 7.
Influx of CaM and dextran into the nuclei of intact cells. Cells were microinjected with fl-CaM or 20-kDa fl-dextran. The fractional recovery (R) of nuclear fluorescence after photobleaching was measured (see Materials and Methods). ln(1/R) was a linear function of time for both fl-CaM and fl-dextran, consistent with a simple first order process. Representative data records for CaM (+) and fl-dextran (●) are shown. The mean influx rate constants for the two probes were not significantly different (P < 0.05).
Affinity and Concentration of CaM-Binding Proteins Determine Asymmetric Distribution of CaM.
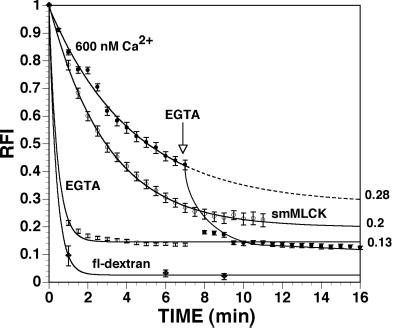
The characteristics of Ca2+-dependent nuclear accumulation of fl-CaM were consistent with a model in which CaM diffuses through nuclear pores unassisted by the nuclear import apparatus. According to this view, the relative levels of CaM in the nucleus and cytoplasm would depend on the concentration and affinity of CaM-binding proteins in each compartment, as well as intracellular free [Ca2+]. To test this hypothesis, the nuclei of permeabilized cells were preloaded with fl-CaM in the presence of 600 nM free [Ca2+], and the time course of fl-CaM efflux under various conditions was monitored by quantitative fluorescence time lapse imaging. When efflux was carried out in Ca2+-free buffer, nuclear fl-CaM decreased at about the same rate as a nonbinding control molecule (20-kDa fl-dextran) but leveled off significantly above background, suggesting that some binding sites retain CaM in the absence of Ca2+ (Fig. 8). When efflux was carried out at 600 nM free Ca2+, efflux of fl-CaM was 7-fold slower, reaching a plateau at 28% of its initial value, and 2-fold higher than in Ca2+-free buffer (Fig. 8). The rate and extent of CaM efflux at 600 nM free Ca2+ were significantly increased on addition of 0.8 μM smooth muscle myosin light chain kinase, a high affinity CaM-binding protein that localizes in the cytoplasm (Fig. 8). Thus, increasing the concentration of CaM-binding sites in the cytoplasm resulted in a net shift of CaM from the nucleus to the cytoplasm.
Figure 8.
Time course of fl-CaM efflux from the nucleus. Permeabilized cells were preloaded with fl-dextran or fl-CaM at 600 nM [Ca2+] and then were perfused with Ca2+-free buffer, 600 nM free Ca2+ buffer, or 600 nM free Ca2+ buffer plus 0.8 μM smooth muscle myosin light chain kinase (smMLCK) as indicated. Efflux of the fluorophore was monitored by quantitative time lapse fluorescence imaging. Lines are single exponential best fits to the data. Plateau values for the exponential fits are indicated on the right y axis. Error bars are SEM.
DISCUSSION
We have reconstituted Ca2+-dependent translocation of CaM into the nuclei of permeabilized cells. The amount of CaM that accumulated in the nucleus was found to parallel the concentration of free Ca2+ in the assay buffer, increasing 5-fold as free Ca2+ was raised from 100 to 600 nM. This graded response suggests that the translocation of CaM into the nucleus depends directly on the fractional occupancy of CaMs four Ca2+ binding sites, rather than on a Ca2+-dependent gating mechanism. Our results are in disagreement with a single previous report in which CaM localization to the nucleus of permeabilized cells was found to be Ca2+-independent with significant accumulation in the absence of free Ca2+ (26). The discrepancy most likely arises from the fact that we included a rinse step between import of CaM and fixation of the cells to allow efflux of unbound CaM. When the rinse was omitted, we found significant CaM fluorescence in the nucleus in the presence of EGTA, and the amount of CaM in the nucleus was uncorrelated with free Ca2+ concentration (data not shown).
The characteristics of Ca2+-dependent nuclear accumulation of CaM suggested that translocation of CaM across the nuclear envelope is not a signal-mediated or -facilitated process and that CaM diffuses freely in and out of the nucleus through NPCs. In permeabilized cells, the addition of cytosolic factors and a renewable energy supply were not required for CaM import, even under conditions in which cytoplasmic CaM-binding proteins had been trapped by a nuclear impermeant CaM analog (CBAR). Although we cannot be sure that all CaM-binding proteins were sequestered by CBAR, the molar concentration of CBAR used was comparable to the endogenous concentration of CaM in most cell types and equal to the concentration of fl-CaM used in the assay. Yet the extent of accumulation of fl-CaM in the nucleus was unaffected. In both permeabilized and intact cells, inhibitors of signal-mediated import did not prevent entry of CaM into the nucleus at resting levels of free Ca2+ or translocation of cytoplasmic CaM into the nucleus at elevated levels of free Ca2+. FRAP measurements showed that the kinetics of CaM influx into the nuclei of resting, intact cells were consistent with a first order process. The influx rate constant was indistinguishable from that of 20-kDa dextran, a freely diffusible control molecule of similar size to CaM (9, 22).
Our results are in agreement with a previous report that calmodulin uptake into isolated nuclei of rat hepatocytes did not require cytosol or ATP and was unaffected by WGA (27). We note that our data are in conflict with another report, which presented evidence that CaM enters the nucleus by facilitated transport (26). This study differs from ours in numerous methodological details, including the cell type used (PTK1). However, differences caused by cell type are unlikely to account for the divergent results because PTK1 cells behaved indistinguishably from A7r5 cells in our hands (data not shown).
Our data support a model for Ca2+-dependent translocation of CaM into the nucleus in which Ca2+-CaM diffuses through NPCs and is retained in the nucleus by binding to nuclear CaM-binding proteins. This conclusion is supported by the fact that nuclear accumulation of CaM was abolished by including the M13 peptide in the assay to block binding of CaM to its target proteins. Efflux studies of nuclei preloaded with CaM revealed the existence of three classes of nuclear binding sites differing in Ca2+-dependence and affinity for CaM. Although we observed no significant nuclear accumulation of CaM in the presence of EGTA, the efflux of CaM after chelation of free Ca2+ with EGTA was incomplete, showing that a small but significant fraction of nuclear binding was not readily reversed when free Ca2+ was lowered. Several known CaM-binding proteins have this characteristic, including the autophosphorylated form of CaM kinase II. At least one splice variant of CaM kinase II has a NLS and is localized the nucleus (28, 29). When efflux was carried out at high Ca2+ (600 nM), the rate of efflux was 7-fold slower than in EGTA, and the plateau value was significantly higher, indicating that Ca2+-dependent CaM-binding sites in the nucleus are of both low and high affinity.
If nuclear CaM-binding sites act as a sink for freely diffusible Ca2+-CaM, the rate of nuclear accumulation of CaM in response to Ca2+ signaling would be a function of the intracellular diffusion coefficient of CaM and the cross-sectional area of open nuclear pores. This is supported by the observation that fl-CaM behaves indistinguishably from 20-kDa fl-dextran in FRAP studies. The eventual steady state level of nuclear CaM would depend on the relative concentration of high affinity binding sites in the nucleus and cytoplasm, as well as intracellular free [Ca2+]. This is supported by our observation that increasing the number of high affinity binding sites in the cytoplasm by addition of smooth muscle myosin light chain kinase to permeabilized cells can shift CaM from the nucleus into the cytoplasm, even at high Ca2+. Based on our efflux experiments in permeabilized cells, we predict that most CaM will diffuse rapidly out of the nucleus when intracellular free Ca2+ falls again, thus terminating the signal. In fact, calmodulin accumulated in the nucleus of hippocampal neurons in response to electrical stimulation has been reported to return to the cytoplasm when stimulation ceased (10).
In this study, we have focused exclusively on the mechanism by which CaM traverses the nuclear envelope and accumulates in the nucleus when Ca2+ is elevated. Several important issues remain to be addressed to form a complete picture of Ca2+-dependent translocation of CaM into the nucleus from the cytoplasm and its possible role in signal transduction. Agonist stimulation of intact cells often results in very localized and/or transient rises in intracellular free Ca2+ rather than the sustained, global elevation of free Ca2+ caused by ionomycin or under the conditions of our permeabilized cell assay. Additional studies will be required to obtain a detailed understanding of the coupling of CaM translocation with Ca2+ dynamics in intact cells. In the case of excitation–transcription coupling in hippocampal neurons, it appears that CaM translocation results even when elevation of Ca2+ is restricted to the cell cortex and that no rise of free Ca2+ in the nucleus is required (10). This may indicate that a different mechanism of CaM translocation is operative in this system. Because elevation of intracellular Ca2+ is expected to decrease the mobility of CaM by promoting binding to target proteins, it is not clear whether sufficient CaM will remain unbound and able to diffuse to the cytoplasmic face of the NPC or whether CaM must be delivered to the NPCs by active transport. However, our previous studies have shown that there is a transient increase in calmodulin mobility on elevation of intracellular Ca2+ and that a significant mobile fraction of calmodulin persists even at sustained high concentrations Ca2+ (9). Finally, the identities of the nuclear CaM-binding proteins responsible for retaining Ca2+-CaM in the nucleus remain to be determined. Possible candidates include CaM Kinase IV, a splice variant of CaM Kinase II, calcineurin, and several less completely characterized proteins, all of which exhibit nuclear localization in some cell types (30–35).
Acknowledgments
Dr. James T. Stull kindly provided smooth muscle myosin light chain kinase. We thank Helen Yin, Don Hilgemann, and Kris Kamm for critical reading of the manuscript. This research was supported by a grant from the National Science Foundation to K.L.P. (MCB-9604594), a grant from the American Cancer Society to B.M.P. (RPG-98-048-01-CSM), and a National Institutes of Health Postdoctoral Training Grant Fellowship to B.L. (5-T32-HL07360-20).
ABBREVIATIONS
- CaM
calmodulin
- NPC
nuclear pore complex
- NLS
nuclear localization signal
- WGA
wheat germ agglutinin
- FRAP
fluorescence recovery after photobleaching
- fl-CaM
fluoresceinated CaM
- RITC
rhodamine isothiocyanate
- CBAR
CaM-biotin-avidin-RITC
Footnotes
This paper was submitted directly (Track II) to the Proceedings Office.
References
- 1.Bachs O, Agell N, Carafoli E. Cell Calcium. 1994;16:289–296. doi: 10.1016/0143-4160(94)90092-2. [DOI] [PubMed] [Google Scholar]
- 2.Anraku Y, Ohya Y, Ilda H. Biochim Biophys Acta. 1991;1093:169–177. doi: 10.1016/0167-4889(91)90119-i. [DOI] [PubMed] [Google Scholar]
- 3.Geiser J R, Sundberg H A, Chang B H, Muller E G D, Davis T N. Mol Cell Biol. 1993;13:7913–7924. doi: 10.1128/mcb.13.12.7913. [DOI] [PMC free article] [PubMed] [Google Scholar]
- 4.Spang A, Courtney I, Grein K, Matzner M, Schiebel E. J Cell Biol. 1995;128:863–877. doi: 10.1083/jcb.128.5.863. [DOI] [PMC free article] [PubMed] [Google Scholar]
- 5.Wang J, Moreira K M, Campos B, Kaetzel M A, Dedman J R. Biochem Biophys Acta. 1996;1313:223–228. doi: 10.1016/0167-4889(96)00093-6. [DOI] [PubMed] [Google Scholar]
- 6.Onions J, Hermann S, Grundstrom T. J Biol Chem. 1997;272:23930–23937. doi: 10.1074/jbc.272.38.23930. [DOI] [PubMed] [Google Scholar]
- 7.Szymanski D B, Liao B, Zielinski R E. Plant Cell. 1996;8:1069–1077. doi: 10.1105/tpc.8.6.1069. [DOI] [PMC free article] [PubMed] [Google Scholar]
- 8.Vendrell M, Pujol M J, Tusell J M, Serratosa J. Brain Res Mol Brain Res. 1992;14:285–292. doi: 10.1016/0169-328x(92)90095-s. [DOI] [PubMed] [Google Scholar]
- 9.Luby-Phelps K, Hori M, Phelps J, Won D. J Biol Chem. 1995;270:21532–21538. doi: 10.1074/jbc.270.37.21532. [DOI] [PubMed] [Google Scholar]
- 10.Deisseroth K, Heist E K, Tsien R W. Nature (London) 1998;392:198–202. doi: 10.1038/32448. [DOI] [PubMed] [Google Scholar]
- 11.Doye V, Hurt E. Curr Opin Cell Biol. 1997;9:401–411. doi: 10.1016/s0955-0674(97)80014-2. [DOI] [PubMed] [Google Scholar]
- 12.Greber U F, Gerace L. J Cell Biol. 1995;128:5–14. doi: 10.1083/jcb.128.1.5. [DOI] [PMC free article] [PubMed] [Google Scholar]
- 13.Nakielny S, Dreyfuss G. Curr Biol. 1997;8:89–95. doi: 10.1016/s0960-9822(98)70039-9. [DOI] [PubMed] [Google Scholar]
- 14.Gorlich D. Curr Opin Cell Biol. 1997;9:412–419. doi: 10.1016/s0955-0674(97)80015-4. [DOI] [PubMed] [Google Scholar]
- 15.Melchior F, Paschal B, Evans J, Gerace L. J Cell Biol. 1993;123:1649–1659. doi: 10.1083/jcb.123.6.1649. [DOI] [PMC free article] [PubMed] [Google Scholar]
- 16.Finlay D R, Newmeyer D D, Price T M, Forbes D J. J Cell Biol. 1987;104:189–200. doi: 10.1083/jcb.104.2.189. [DOI] [PMC free article] [PubMed] [Google Scholar]
- 17.Adam S A, Sterne-Marr R, Gerace L. Methods Cell Biol. 1991;35:469–482. doi: 10.1016/s0091-679x(08)60584-1. [DOI] [PubMed] [Google Scholar]
- 18.Sweitzer T D, Hanover J A. Proc Natl Acad Sci USA. 1996;93:14574–14579. doi: 10.1073/pnas.93.25.14574. [DOI] [PMC free article] [PubMed] [Google Scholar]
- 19.Chang D, Hsieh P S, Dawson D C. Comput Biol Med. 1988;18:351–366. doi: 10.1016/0010-4825(88)90022-4. [DOI] [PubMed] [Google Scholar]
- 20.Liao B, Zielinski R E. Methods Cell Biol. 1995;49:487–499. doi: 10.1016/s0091-679x(08)61475-2. [DOI] [PubMed] [Google Scholar]
- 21.Peters R. J Biol Chem. 1983;258:11427–11429. [PubMed] [Google Scholar]
- 22.Peters R. EMBO J. 1984;3:1831–1836. doi: 10.1002/j.1460-2075.1984.tb02055.x. [DOI] [PMC free article] [PubMed] [Google Scholar]
- 23.Thibonnier M, Bayer A L, Simonson M S, Kester M. Endocrinology. 1991;129:2845–2856. doi: 10.1210/endo-129-6-2845. [DOI] [PubMed] [Google Scholar]
- 24.Marsault R, Murgia M, Pozzan T, Rizzuto R. EMBO J. 1997;16:1575–1581. doi: 10.1093/emboj/16.7.1575. [DOI] [PMC free article] [PubMed] [Google Scholar]
- 25.Breeuwer M, Goldfarb D S. Cell. 1990;60:999–1008. doi: 10.1016/0092-8674(90)90348-i. [DOI] [PubMed] [Google Scholar]
- 26.Pruschy M, Ju Y, Spitz L, Carafoli E, Goldfarb D S. J Cell Biol. 1994;127:1527–1536. doi: 10.1083/jcb.127.6.1527. [DOI] [PMC free article] [PubMed] [Google Scholar]
- 27.Wong E C, Saffitz J E, McDonald J M. Biochem Biophys Res Commun. 1991;181:1548–1556. doi: 10.1016/0006-291x(91)92115-z. [DOI] [PubMed] [Google Scholar]
- 28.Cross S S, Wolin M S. Annu Rev Physiol. 1995;57:737–769. doi: 10.1146/annurev.ph.57.030195.003513. [DOI] [PubMed] [Google Scholar]
- 29.Heist E K, Schulman H. Cell Calcium. 1998;23:103–114. doi: 10.1016/s0143-4160(98)90108-7. [DOI] [PubMed] [Google Scholar]
- 30.Means A R, Ribar T J, Kane C D, Hook S S, Anderson K A. Recent Prog Horm Res. 1997;52:389–406. [PubMed] [Google Scholar]
- 31.Srinivasan M, Edman C F, Schulman H. J Cell Biol. 1994;126:839–852. doi: 10.1083/jcb.126.4.839. [DOI] [PMC free article] [PubMed] [Google Scholar]
- 32.Rao A, Luo C, Hogan P G. Annu Rev Immunol. 1997;15:707–747. doi: 10.1146/annurev.immunol.15.1.707. [DOI] [PubMed] [Google Scholar]
- 33.Shibasaki F, Price E R, Milan D, McKeon F. Nature (London) 1996;382:370–373. doi: 10.1038/382370a0. [DOI] [PubMed] [Google Scholar]
- 34.Castro A, Faura M, Agell N, Renau-Piqueras J, Bachs O. Cell Calcium. 1996;20:493–500. doi: 10.1016/s0143-4160(96)90091-3. [DOI] [PubMed] [Google Scholar]
- 35.Portoles M, Faura M, Renau-Piqueras J, Iborra F J, Saez R, Guerri C, Serratosa J, Rius E, Bachs O. J Cell Sci. 1994;107:3601–3614. doi: 10.1242/jcs.107.12.3601. [DOI] [PubMed] [Google Scholar]


