Abstract
Phylogenetic patterns show the presence or absence of certain genes in a set of full genomes derived from different species. They can also be used to determine sets of genes that occur only in certain evolutionary branches. Previously, we presented a database named PhyloPat which allows the complete Ensembl gene database to be queried using phylogenetic patterns. Here, we describe an updated version of PhyloPat which can be queried by an improved web server. We used a single linkage clustering algorithm to create 241 697 phylogenetic lineages, using all the orthologies provided by Ensembl v49. PhyloPat offers the possibility of querying with binary phylogenetic patterns or regular expressions, or through a phylogenetic tree of the 39 included species. Users can also input a list of Ensembl, EMBL, EntrezGene or HGNC IDs to check which phylogenetic lineage any gene belongs to. A link to the FatiGO web interface has been incorporated in the HTML output. For each gene, the surrounding genes on the chromosome, color coded according to their phylogenetic lineage can be viewed, as well as FASTA files of the peptide sequences of each lineage. Furthermore, lists of omnipresent, polypresent, oligopresent and anticorrelating genes have been included. PhyloPat is freely available at http://www.cmbi.ru.nl/phylopat.
INTRODUCTION
Phylogenetic patterns show the presence or absence of certain genes in a set of whole genome sequences derived from different species. These patterns can be used to determine sets of genes that occur only in certain evolutionary branches. The use of phylogenetic patterns has been common practice as increasing amounts of orthology data have become available. One example is clusters of orthologous groups (COGs) (1), which included a Phylogenetic Patterns Search (PPS) and an Extended Phylogenetic Patterns Search (EPPS) (2) tool, providing the possibility of querying the phylogenetic patterns of the COG protein database using regular expressions. The ortholog database OrthoMCL-DB (3) also offers this possibility. However, PPS tools have only been available for querying proteins, and not for querying genes. The PhIGs (4), Hogenom (5) and TreeFam (6) databases all offer phylogenetic clustering of genes, but do not have the functionality of phylogenetic patterns, and do not include the full range of Ensembl (7) species. Moreover, these databases do not provide additional genomic information such as function and organization of neighboring genes. In September 2006, we introduced a database named PhyloPat (8) that offers the possibility of querying the Ensembl database using any phylogenetic pattern. Here, we show the newest version of this database, and show applications of the new functionalities that have been implemented in the web server, such as a gene neighborhood view, anticorrelating patterns, support of Entrez Gene (9) IDs and direct sequence retrieval of members of a phylogenetic lineage.
DATABASE CONTENT AND CONSTRUCTION
Content
A set of phylogenetic lineages was constructed containing all the genes in Ensembl that have orthologs in other species according to the BioMart (10) database. This set covers all of the 39 (eukaryotic) species available in Ensembl version 49 (preversions and low coverage genomes not taken into account). First, we collected the complete set of orthologies between these 39 species, consisting of 741 species pairs, 815 452 genes and 19 010 478 orthologous relationships. The orthologies within Ensembl v49 consist of 11 446 546 one-to-one relationships, 4 588 300 one-to-many relationships and 2 975 632 many-to-many relationships. These orthologies are determined by the thorough Ensembl ortholog detection pipeline (http://www.ensembl.org/info/about/docs/compara/homology_method.html). This pipeline starts with the collection of a number of best reciprocal hits [BRHs, proven to be accurate (11)] and best score ratio (BSR) values from a WU BLASTP/Smith–Waterman whole-genome comparison. These are used to create a graph of gene relations, followed by a clustering step. These clusters are then applied to build a multiple alignment using MUSCLE (12) and a phylogenetic tree using TreeBeST (http://treesoft.sourceforge.net/treebest.shtml). Finally, the above mentioned orthologous relationships are inferred from this gene tree.
Construction
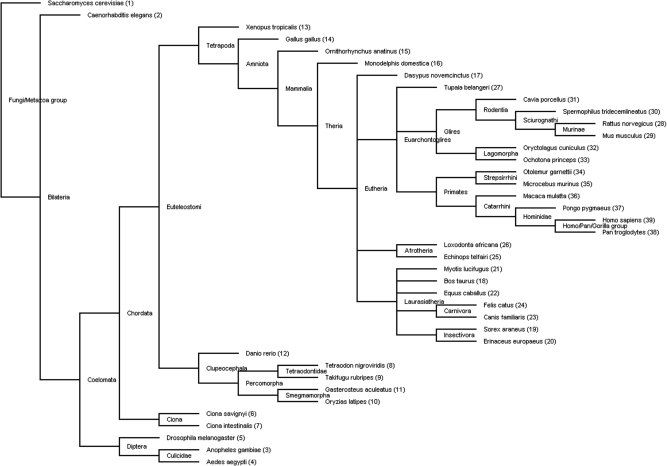
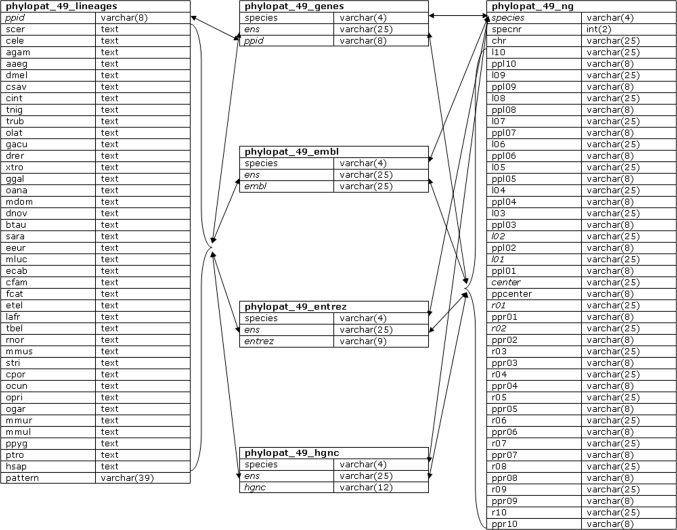
After the collection of all orthologous pairs, we generated phylogenetic lineages using a single linkage algorithm. First, we determined the evolutionary order of the studied species using the NCBI Taxonomy (13) database. The phylogenetic tree [phylogram, created by TreeView (14)] of these species, together with some phylogenetic branch names, are shown in Figure 1. Second, we used this phylogenetic tree as a starting point for building our phylogenetic lineages. For each gene in the first species (Saccharomyces cerevisiae), we looked for orthologs in the other species. All orthologs were added to the phylogenetic lineage, and in the next round were checked for orthologs themselves, until no additional orthologies were found for any of the genes. This process was repeated for all genes in all 39 species that were not yet connected to any phylogenetic lineage yet. The complete phylogenetic lineage determination generated 241 697 lineages. Please note that the phylogenetic order that we have determined here does not affect the construction of the phylogenetic lineages in any way: changing the order only influences the numbering of the phylogenetic lineages but not the contents of the lineages. This is due to our clustering algorithm, in which each orthologous relationship is treated symmetrically. Figure 2 shows the database scheme; the phylogenetic lineages, gene neighborhood and some mapping information have been stored in six tables, and optimized for fast querying.
Figure 1.
Phylogenetic tree of all species present in PhyloPat. This is the unrooted NCBI Taxonomy tree of all species available in Ensembl and PhyloPat. The numbers are the order in which the species are shown on the PhyloPat results pages. A phylogram version of this tree is available through the website.
Figure 2.
The PhyloPat database scheme. The database scheme shows all six tables used in the application. Table names are in bold, primary keys are in italic. Links between fields are shown with arrows. The left side of each column shows the field names, the right side shows the field types.
WEB APPLICATION
Overview
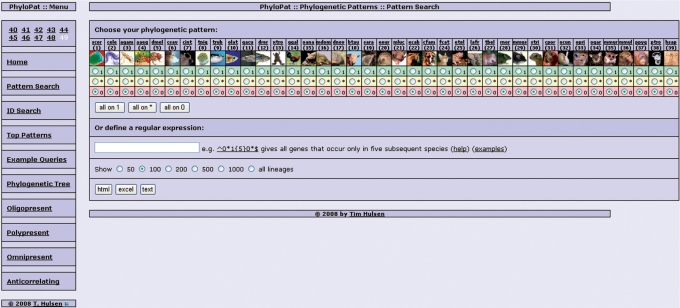
We developed an intuitive web interface (Figure 3) to query the PhyloPat MySQL database containing these phylogenetic lineages and the derived phylogenetic patterns. As input a phylogenetic pattern is used, generated by clicking a set of radio buttons or by typing a regular expression, or a list of Ensembl (7), EMBL (15), Entrez Gene (9) or HGNC symbols (16). The application of MySQL regular expressions provides enhanced querying. The output can be given in HTML, Excel or plain text format. A link to the FatiGO (17) web interface has been incorporated in the HTML output, creating easy access to functional annotation of the genes in the phylogenetic lineage. Each phylogenetic lineage can be viewed separately by clicking the PhyloPat ID (PPID). This view gives all Ensembl IDs within the phylogenetic lineage plus the HGNC (16) symbols, FASTA-format files with the proteins sequences, and the gene neighborhood. The web interface also provides some example queries, the 100 most occurring patterns, anticorrelating patterns and numerical overviews of lineages that are present in (i) all species (ii) almost all species and (iii) only one or two species. Finally, a phylogenetic tree of all included species is provided, through which each branch can be selected to view a list of branch-specific genes. This tree can be downloaded in PHYLIP (18) format.
Figure 3.
The PhyloPat web interface (Pattern Search tab). The web interface has the menu on the left and the input/results page on the right. On the pattern search page, the user can generate a phylogenetic pattern by clicking a radio button for each species. 1 = present, * = present/absent, 0 = absent. The buttons directly below put all 39 species on the corresponding mode. MySQL regular expressions offer the possibility of advanced querying. The user can choose to show any number of lineages and choose the output format: HTML, Excel or plain text.
Omnipresent genes
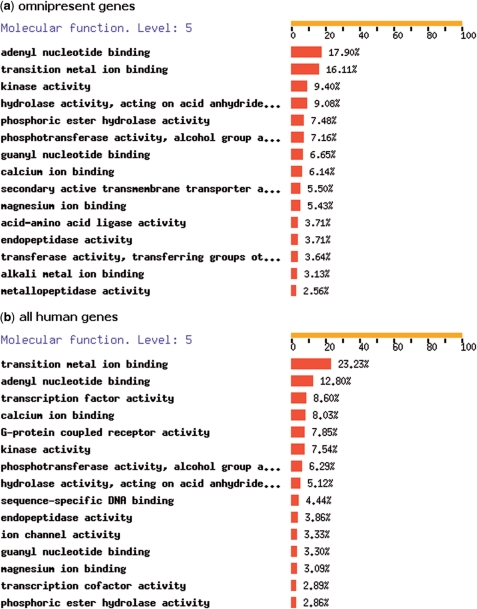
An analysis of all lineages with the phylogenetic pattern ‘111111111111111111111111111111111111111’ (or MySQL regular expression ‘⁁1+$’) gives a list of ‘omnipresent’ genes, i.e. present in all 39 species. We found 688 omnipresent genes, which most likely have important functions, since they are present in all species. Figure 4a shows the top 15 of 5th level GO (19) molecular functions for all 2345 human genes within these omnipresent phylogenetic lineages, generated by FatiGO (17). To compare the results, we also show the top 15 of 5th level GO molecular functions for the complete set of human genes (32 584 in Ensembl v49), in Figure 4b. The GO molecular function annotation shows that omnipresent genes are more often involved in adenyl nucleotide binding compared than random human genes (17.90% versus 12.80%), and less often involved in transition metal ion binding (16.11% versus 23.23%). The genes with G-protein coupled receptor activity seem to be underrepresented in the omnipresent genes; whereas from the complete human genome 7.85% is involved in GPCR activity, this molecular function is not in the top 15 for the omnipresent gene set, with only 0.64%. This is likely due to the fact that GPCRs are almost absent in S. cerevisiae and are a class of molecules with highly specific functions in different organisms (20). However, this still needs to be proven by experimental data.
Figure 4.
Gene Ontology annotations of (i) omnipresent and (ii) all human genes, created by FatiGO. (a) The 5th level Gene Ontology Molecular Function annotations for all 2345 human genes in omnipresent lineages. (b) The 5th level Gene Ontology Molecular Function annotations for all 32 584 human genes, used as a reference set.
Oligopresent genes
The distribution of ‘oligopresent’ genes (genes that exist in only one or two species) can be used to determine which species are evolutionary most related, as the number of shared genes, that are absent in other species, can be used as a measure for the phylogenetic distance (21). It is apparent that Ciona savignyi and C. intestinalis are the closest relatives (1866 oligopresent genes), followed by Anopheles gambiae and Aedes aegypti (1206 oligopresent genes) and Rattus norvegicus and Mus musculus (557 oligopresent genes). These results correspond with the current view on the evolutionary relationships between these species. It should also be noted that the incomplete orthology information contained in the BioMart database causes the number of genes present in only one species to be very high. This will improve with each new Ensembl release, as orthology information and functional annotation are expanded and improved in each release.
Polypresent genes
A second measure for evolutionary relatedness is the distribution of ‘polypresent’ genes: genes that are missing in only one or two species. Saccharomyces cerevisiae has the highest number of missing polypresent genes: 552 polypresent genes do not occur in S. cerevisiae only, and 505 polypresent genes are not present in S. cerevisiae and a second species. When not taking into account the outlier species S. cerevisiae, both Ciona species have the highest number of missing polypresent genes: 18 lineages occur in all species except for C. savignyi and C. intestinalis.
Anticorrelating patterns
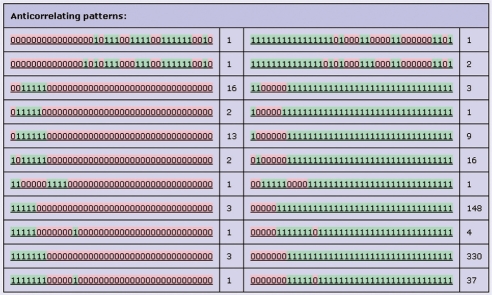
Figure 5 gives an overview of anticorrelating pattern pairs, and the numbers of lineages that have these patterns. Anticorrelating patterns are defined as patterns that are exactly opposite (‘0’→‘1’ and ‘1’→‘0’), and have at least five 0s and at least five 1s. Phylogenetic lineages with anticorrelating patterns can be functionally completely different, but could also be highly similar in function. For example, phylogenetic lineage PP110132 has the pattern ‘000000000000000010111001111001111110010’ (upper line of Figure 5), while phylogenetic lineage PP004906 has the anticorrelating pattern ‘111111111111111101000110000110000001101’. The PP110132 genes are all annotated by Ensembl as ‘no description’, but some of the PP004906 genes are annotated as ‘Chromatin modifying protein 1b’ (CHMP1b, in Danio rerio, Gallus gallus, M. musculus and Xenopus tropicalis). The PP110132 genes can be analogous to CHMP1b, i.e. performing a similar function to CHMP1b, without being evolutionary related.
Figure 5.
Anticorrelating patterns. The anticorrelating pattern page of PhyloPat version 49. Columns 1 and 3 show the anticorrelating phylogenetic patterns, columns 2 and 4 the numbers of phylogenetic lineages that have these patterns.
Gene neighborhood
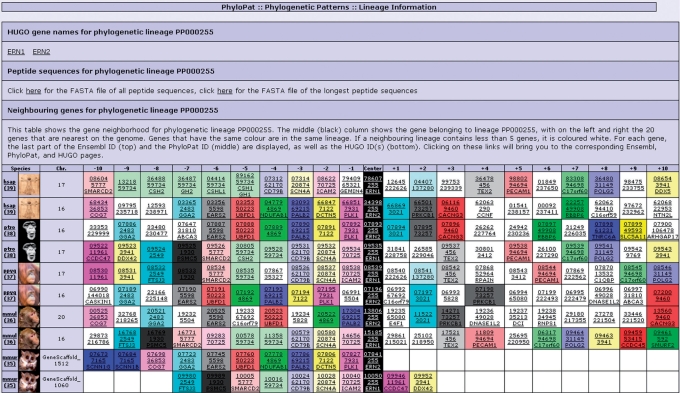
Figure 6 shows the gene neighborhood for PhyloPat ID PP000255 (ERN1, ERN2). The human gene ENSG00000134398 has two predicted orthologs in chimpanzee: gene ENSPTRG00000007893 and gene ENSPTRG00000009535. However, only the gene neighborhoods of gene ENSPTRG00000007893 and gene ENSG00000134398 correspond, for nine of the nearest neighbors. This is called ‘orthologous conservation of gene neighborhood’ and it shows that the two genes involved are evolutionary related (22). In this case, we would say that the ‘true’ ortholog of gene ENSG00000134398 is very likely to be gene ENSPTRG00000007893. Apart from inferring ‘true’ orthology from the genome organization, gene neighborhoods can also be used to infer functional annotation for genes or build hypotheses about the processes or pathways that genes might be involved in.
Figure 6.
Lineage information of PP000255. Lineage information page, including gene neighborhood, for PP000255 (ERN1/ERN2). The middle (black) column shows the gene belonging to lineage PP000255, with on the left and right the 20 genes that are nearest on the genome. Genes that have the same color are in the same lineage. If a neighboring lineage contains less than five genes, it is colored white. For each gene, the last part of the Ensembl ID (top) and the PhyloPat ID (middle) are displayed, as well as the HGNC symbol(s) (bottom), linking to the corresponding Ensembl, PhyloPat and HGNC pages.
FASTA-format sequence files
Both the pattern search output and the gene neighborhood view contain links to FASTA files of the peptide sequences belonging to each phylogenetic lineage. We included two types of files: one with all peptide sequences (marked by ‘A’) and one with only the longest translation of each gene (marked by ‘L’).
DISCUSSION AND CONCLUSION
The above examples show that PhyloPat is useful in orthology detection, evolutionary studies and gene annotation. It builds on and expands the concept of phylogenetic pattern tools like EPPS (2), and on gene databases like PhiGs (4), Hogenom (5) and TreeFam (6). The originality of PhyloPat lies in the combination of these two aspects: phylogenetic pattern querying and gene family databases. In PhyloPat, it is possible to determine a species set that should be included (1), a species set that should be excluded (0) and a species set which presence is indifferent (*). This, and the use of regular expression queries, enables quite complex PPSs and clustering. Furthermore, we aim to provide an easy-to-use web interface in which the Ensembl database can be queried using phylogenetic patterns. Users can see which gene families are present in a certain species set but missing in another species set. The output of PPSs can be easily analyzed by the FatiGO tool, like we demonstrated in Figure 4. Another advantage of PhyloPat is that it relies on the Ensembl database only. Other gene databases use a wide range of gene and protein data sets, each with their own standards and methodologies. By using only the popular Ensembl database as input, we create a nonredundant database, through which it is possible to easily study lineage-specific expansions of gene families. Finally, the new options of the web application of PhyloPat make it easier to query the database and to retrieve the sequences from the lineage of interest. The gene neighborhood view adds a new level of information: genomic context can help in locating evolutionary-related genomic clusters of genes, and in detecting the ‘true orthologs’ within large sets of predicted orthologs as well as in functional annotating less well known genes. PhyloPat will be updated with each major Ensembl release to ensure up-to-date and reliable phylogenetic lineages. Older versions of PhyloPat (starting with version 40) are maintained and linked to the corresponding Ensembl archive pages. Future versions of PhyloPat might contain more features such as a statistical significance measure for the comparison of multiple phylogenetic patterns, and user-defined species sets for the calculation of orthologous groups.
ACKNOWLEDGEMENTS
This work was part of BioRange SP3.2.2 project of the Netherlands Bioinformatics Centre (NBIC), and was supported financially by Schering-Plough corporation.
Conflict of interest statement. None declared.
REFERENCES
- 1.Natale DA, Galperin MY, Tatusov RL, Koonin EV. Using the COG database to improve gene recognition in complete genomes. Genetica. 2000;108:9–17. doi: 10.1023/a:1004031323748. [DOI] [PubMed] [Google Scholar]
- 2.Reichard K, Kaufmann M. EPPS: mining the COG database by an extended phylogenetic patterns search. Bioinformatics. 2003;19:784–785. doi: 10.1093/bioinformatics/btg089. [DOI] [PubMed] [Google Scholar]
- 3.Chen F, Mackey AJ, Stoeckert C.J., Jr, Roos DS. OrthoMCL-DB: querying a comprehensive multi-species collection of ortholog groups. Nucleic Acids Res. 2006;34:D363–D368. doi: 10.1093/nar/gkj123. [DOI] [PMC free article] [PubMed] [Google Scholar]
- 4.Dehal PS, Boore JL. A phylogenomic gene cluster resource: the Phylogenetically Inferred Groups (PhIGs) database. BMC Bioinformatics. 2006;7:201. doi: 10.1186/1471-2105-7-201. [DOI] [PMC free article] [PubMed] [Google Scholar]
- 5.Dufayard JF, Duret L, Penel S, Gouy M, Rechenmann F, Perriere G. Tree pattern matching in phylogenetic trees: automatic search for orthologs or paralogs in homologous gene sequence databases. Bioinformatics. 2005;21:2596–2603. doi: 10.1093/bioinformatics/bti325. [DOI] [PubMed] [Google Scholar]
- 6.Ruan J, Li H, Chen Z, Coghlan A, Coin LJ, Guo Y, Heriche JK, Hu Y, Kristiansen K, Li R, et al. TreeFam: 2008 Update. Nucleic Acids Res. 2008;36:D735–D740. doi: 10.1093/nar/gkm1005. [DOI] [PMC free article] [PubMed] [Google Scholar]
- 7.Flicek P, Aken BL, Beal K, Ballester B, Caccamo M, Chen Y, Clarke L, Coates G, Cunningham F, Cutts T, et al. Ensembl 2008. Nucleic Acids Res. 2008;36:D707–D714. doi: 10.1093/nar/gkm988. [DOI] [PMC free article] [PubMed] [Google Scholar]
- 8.Hulsen T, de Vlieg J, Groenen PM. PhyloPat: phylogenetic pattern analysis of eukaryotic genes. BMC Bioinformatics. 2006;7:398. doi: 10.1186/1471-2105-7-398. [DOI] [PMC free article] [PubMed] [Google Scholar]
- 9.Maglott D, Ostell J, Pruitt KD, Tatusova T. Entrez Gene: gene-centered information at NCBI. Nucleic Acids Res. 2007;35:D26–D31. doi: 10.1093/nar/gkl993. [DOI] [PMC free article] [PubMed] [Google Scholar]
- 10.Kasprzyk A, Keefe D, Smedley D, London D, Spooner W, Melsopp C, Hammond M, Rocca-Serra P, Cox T, Birney E. EnsMart: a generic system for fast and flexible access to biological data. Genome Res. 2004;14:160–169. doi: 10.1101/gr.1645104. [DOI] [PMC free article] [PubMed] [Google Scholar]
- 11.Hulsen T, Huynen MA, de Vlieg J, Groenen PM. Benchmarking ortholog identification methods using functional genomics data. Genome Biol. 2006;7:R31. doi: 10.1186/gb-2006-7-4-r31. [DOI] [PMC free article] [PubMed] [Google Scholar]
- 12.Edgar RC. MUSCLE: a multiple sequence alignment method with reduced time and space complexity. BMC Bioinformatics. 2004;5:113. doi: 10.1186/1471-2105-5-113. [DOI] [PMC free article] [PubMed] [Google Scholar]
- 13.Wheeler DL, Chappey C, Lash AE, Leipe DD, Madden TL, Schuler GD, Tatusova TA, Rapp BA. Database resources of the National Center for Biotechnology Information. Nucleic Acids Res. 2000;28:10–14. doi: 10.1093/nar/28.1.10. [DOI] [PMC free article] [PubMed] [Google Scholar]
- 14.Page RD. TreeView: an application to display phylogenetic trees on personal computers. Comput. Appl. Biosci. 1996;12:357–358. doi: 10.1093/bioinformatics/12.4.357. [DOI] [PubMed] [Google Scholar]
- 15.Cochrane G, Akhtar R, Aldebert P, Althorpe N, Baldwin A, Bates K, Bhattacharyya S, Bonfield J, Bower L, Browne P, et al. Priorities for nucleotide trace, sequence and annotation data capture at the Ensembl Trace Archive and the EMBL Nucleotide Sequence Database. Nucleic Acids Res. 2008;36:D5–D12. doi: 10.1093/nar/gkm1018. [DOI] [PMC free article] [PubMed] [Google Scholar]
- 16.Eyre TA, Ducluzeau F, Sneddon TP, Povey S, Bruford EA, Lush MJ. The HUGO Gene Nomenclature Database, 2006 updates. Nucleic Acids Res. 2006;34:D319–D321. doi: 10.1093/nar/gkj147. [DOI] [PMC free article] [PubMed] [Google Scholar]
- 17.Al-Shahrour F, Diaz-Uriarte R, Dopazo J. FatiGO: a web tool.for finding significant associations of Gene Ontology terms with groups of genes. Bioinformatics. 2004;20:578–580. doi: 10.1093/bioinformatics/btg455. [DOI] [PubMed] [Google Scholar]
- 18.Felsenstein J. PHYLIP – Phylogeny Inference Package (Version 3.2). Cladistics. 1989;5:164–166. [Google Scholar]
- 19.Ashburner M, Ball CA, Blake JA, Botstein D, Butler H, Cherry JM, Davis AP, Dolinski K, Dwight SS, Eppig JT, et al. Gene ontology: tool for the unification of biology. The Gene Ontology Consortium. Nat. Genet. 2000;25:25–29. doi: 10.1038/75556. [DOI] [PMC free article] [PubMed] [Google Scholar]
- 20.Perez DM. From plants to man: the GPCR “tree of life”. Mol. Pharmacol. 2005;67:1383–1384. doi: 10.1124/mol.105.011890. [DOI] [PubMed] [Google Scholar]
- 21.Korbel JO, Snel B, Huynen MA, Bork P. SHOT: a web server for the construction of genome phylogenies. Trends Genet. 2002;18:158–162. doi: 10.1016/s0168-9525(01)02597-5. [DOI] [PubMed] [Google Scholar]
- 22.Notebaart RA, Huynen MA, Teusink B, Siezen RJ, Snel B. Correlation between sequence conservation and the genomic context after gene duplication. Nucleic Acids Res. 2005;33:6164–6171. doi: 10.1093/nar/gki913. [DOI] [PMC free article] [PubMed] [Google Scholar]


