Abstract
The MAPU 2.0 database contains proteomes of organelles, tissues and cell types measured by mass spectrometry (MS)-based proteomics. In contrast to other databases it is meant to contain a limited number of experiments and only those with very high-resolution and -accuracy data. MAPU 2.0 displays the proteomes of organelles, tissues and body fluids or conversely displays the occurrence of proteins of interest in all these proteomes. The new release addresses MS-specific problems including ambiguous peptide-to-protein assignments and it provides insight into general functional features on the protein level ranging from gene ontology classification to comprehensive SwissProt annotation. Moreover, the derived proteomic data are used to annotate the genomes using Distributed Annotation Service (DAS) via EnsEMBL services. MAPU 2.0 is a model for a database specifically designed for high-accuracy proteomics and a member of the ProteomExchange Consortium. It is available on line at http://www.mapuproteome.com.
INTRODUCTION
Mass spectrometry (MS)-based proteomics has progressed dramatically in throughput, accuracy and sensitivity and this trend shows no sign of abating (1,2). In order to make the data useful to the larger biomedical community, they have to be easily accessible via the web. Existing proteome databases have focused on different aspects of proteomic data capture and data mining. The PRIDE database, for example, was primarily developed as a vehicle to share proteomic experiments (3). The PeptideAtlas project, on the other hand, is mainly interested in collecting data on peptide fragmentation patterns as a tool for improving future proteomics experiments (4,5). In a similar vein, the Global Proteome Machine Database (GPMDB), collects tandem mass spectra with a view to improve peptide identification (6,7). These and other proteome databases are beginning to be connected in the ProteomExchange Consortium (8).
In contrast to the above efforts, our group has focused on the development of a proteome database specifically for very high-resolution and high-accuracy data. Such data could previously only be generated by a few specialized laboratories but the required instrumentation has now spread to hundreds of sites. By only admitting high-resolution data, we avoid a problem endemic to databases that aggregate a wide variety of heterogeneous data, namely the control of overall false positive rates for protein identification.
The Max-Planck Unified (MAPU) proteome database contains data from large-scale projects on the mapping of body fluids, tissues and cell lines (9). Its new version, MAPU 2.0, provides a comprehensive proteome information system consisting of the data integration of combined large-scale proteomic projects and the inclusion of protein annotations from standard protein databases, such as UniProt (10). To allow the peptide-based retrieval of high-accuracy proteomic data across projects in a scalable way, we changed the basic concept of the MAPU database completely. The main modifications are the combination of various proteomic sub-databases, of a modern programming environment (C# and .NET) allowing a rich graphical user experience, solving MS specific problems such as peptide-to-protein assignments, the inclusion of additional large-scale proteomic datasets, the detailed cross-reference to SwissProt annotations and two-way connection to EnsEMBL using Distributed Annotation Service (DAS) technology.
The last point is specifically pertinent, because as the number of sequenced genomes increases rapidly (11), the annotation of these sequences with biological information becomes increasingly important. Mapping large-scale data derived from MS-based proteomics to the genome sequence is one valuable annotation because it verifies genes and gene models for part of the genome. The EnsEMBL project provides an excellent system to integrate any kind of data that contributes to the annotation of the genome (12,13). In MAPU 2.0, we map high-accuracy proteomic data to the genome in a two way fashion and used the DAS source system to illustrate certain features including the presence of the protein in specific cell types for each identified gene transcript.
METHODS AND MATERIALS
General concept of MAPU 2.0
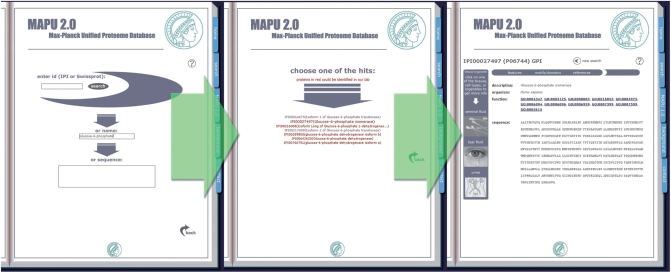
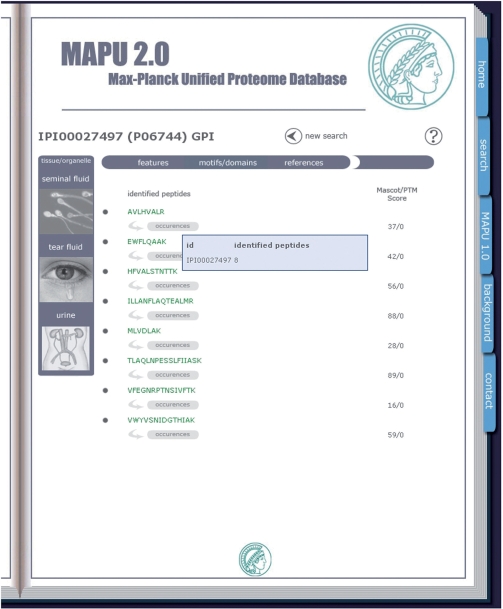
The initial content and format of MAPU have been described in Zhang et al. (9). The basic schema of the database has changed dramatically, and the new database version unifies all sub-databases by reassigning the measured peptides along with their corresponding data from each experiment to protein entries of an updated database version. The new architecture is based in part on concepts developed for the Phosphorylation Site Database [PHOSIDA; www.phosida.com (14,15)]. It allows the organism-specific retrieval of various cell-type and organelle associated proteomic data. The user can query the database organism-specifically by protein name, protein description, gene symbol, accession of the database used for identification [such as the International Protein Index (IPI) (16)], SwissProt accession identifier, protein sequence or peptide sequence (Figure 1, left panel). If more than one protein entry matches with the submitted query string, MAPU 2.0 will list all relevant proteins and mark the ones identified in at least one proteomic experiment, in red (Figure 1, middle panel). Clicking on one of the red highlighted entries leads to the result page (Figure 1, right panel). If there is just a single match to the query, the web user will be guided directly to the result page describing the inquired protein. The left panel of the resulting web page displays investigated cell types and tissues. If the protein was detected in a certain sub-proteome, the corresponding button is highlighted (Figure 1, right panel). Otherwise, the image of the tissue or cell type is illustrated in light colors indicating the absence of the specified protein of interest. Clicking on one of the buttons on the left panel results in the complete listing of all peptides that have been measured in the selected cell type along with associated data such as peptide identification scores or identification scores for post-translational modifications (PTMs) (Figure 2).
Figure 1.
To retrieve proteomic data for a protein of interest, one can search organism specifically via accession number, gene symbol, protein description, protein name or peptide sequence (left panel). If there are several hits for a query, all potential proteins of interest are listed (middle panel). Proteins that have been identified in any of the projects in MAPU 2.0 are shown in red. The final result page provides a total overview of cell types and tissues that contain the protein of interest (right panel).
Figure 2.
For each project, all measured peptides are listed along with validation scores such as the Mascot protein identification score.
The peptide-to-protein assignment presents one of the main problems in ‘shotgun’ MS, where proteins are first digested to peptides, since a given peptide might occur in several proteins (17). Multiple incidences of a certain peptide sequence can cause ambiguous protein assignments. In accordance with Occam's razor, we assign a given peptide sequence to the candidate protein with the highest number of peptides within one project. The user is alerted to this problem by color highlighting the listed peptides: green indicates that the selected protein of interest has the maximum number of peptides in comparison to all other proteins that contain the same peptide, whereas blue indicates that there is another protein entry that contains the peptide and shows the same number of identified peptides in total. Red points to the occurrence of another protein, which shows a higher number of detected peptides in total and thus presents the more likely associated protein. When pointing the mouse to one of the corresponding ‘occurrences’ buttons, a blue colored pop-up box lists all protein entries that contain the given peptide along with the total number of containing peptides that have been identified (Figure 2). If the experimental design included the organellar localizations of proteins, all organelles in which the protein of interest was detected are listed.
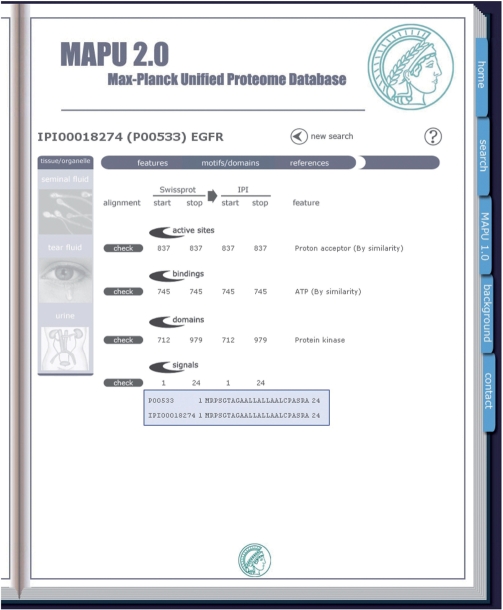
In addition to the illustration of associated cell types and organelles along with the measured peptides, general information about the protein is provided: Besides protein descriptions and full protein sequences, the corresponding Gene Ontology identifiers (18) are listed linking to the Gene Ontology web site reporting full descriptions of the selected annotation. Furthermore, the annotations to each instance include PubMed references and general features such as active sites, motifs, domains or signaling sites derived from SwissProt (Figure 3). Since there may be several isoform entries corresponding to one SwissProt entry, we BLASTP-aligned the protein sequence of each SwissProt instance with that of the corresponding entry of the database used for matching the spectra to peptide sequence (usually the IPI). The main purpose of this extensive alignment approach is to derive the exact sequence positions of relevant protein features that are annotated in SwissProt within the protein sequences of the entry of the database used for MS identification.
Figure 3.
For each protein that has a SwissProt accession number, general features such as active sites, domains and motifs are displayed and mapped to the entry of the database that was used for identification.
Proteomics datasets containing quantitative information in the form of isotope ratios are becoming the norm rather than the exception (19). In this case, the median quantitative data of all measured and assigned peptides is taken to quantify the protein.
Additionally, each displayed web page includes a question mark button that directs to the help section of MAPU 2.0 describing the format of the current page or exemplifying the web application guideline. These help sections are also available via the ‘background’ section of MAPU 2.0, which also contains general descriptions of the experimental designs of various projects.
To allow the retrieval of legacy sub-databases that could not be included in the new concept, a link to the old database version is provided. This is the case for the organellar database (20) as well as the red blood cell database (21), as both datasets are exclusively protein-based and therefore cannot be mapped to MAPU 2.0 due to the lack of peptide information.
MAPU 2.0 is based on a modern and scalable software architecture, namely C# and the ASP.NET technology. This allows MAPU 2.0 to share class libraries, with PHOSIDA (15). The concepts and web applications of MAPU 2.0 and PHOSIDA are very similar and show that very distinct proteomic databases can be built using shared components.
Genome Annotation
We spent particular efforts on precisely mapping our high-resolution proteomic data to the genome. For this purpose, we extracted measured peptides of each proteomic dataset and reassigned the peptide sequences to genes annotated in the EnsEMBL database (11). If a specified peptide matches with sequences of more than one translated gene, we assigned the peptide to the gene transcript that shows the highest number of matching peptides in total within the associated project. Therefore, the peptide-to-gene transcript assignment results one-to-one relationships reducing potential redundancy.
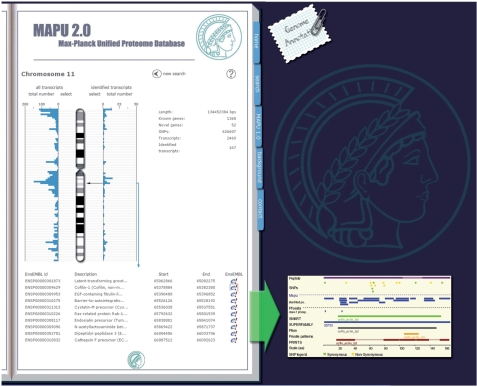
The genome annotation section is accessible via the ‘notepad’ button located next to the main ‘web book’ of MAPU 2.0 (Figure 4). The user first selects a species of interest. The karyotype of the selected species is illustrated along with a link that connects to the EnsEMBL genome annotation webpage. Clicking of the displayed chromosomes generates a more detailed image of the chosen chromosome along with general information including chromosome length, number of known and predicted genes, quantity of occurring single nucleotide polymorphisms (SNPs) and number of gene transcripts. Besides these annotations, which are derived from the EnsEMBL database, the number of gene transcripts that have been identified in MAPU 2.0 is indicated.
Figure 4.
The genome annotation section of MAPU 2.0 provides insight into the number of identified gene transcripts. It links each detected transcript to the EnsEMBL database, which illustrates gene features derived from proteomic approaches via the MAPU 2.0 and PHOSIDA DAS sources.
Furthermore, each chromosome is divided into 93 bins: on the left hand side the number of transcripts annotated in EnsEMBL is displayed. Selecting one of the bin boxes pops up the EnsEMBL web page, showing a detailed view of the selected chromosome region. On the right hand side, the number of transcripts that have been detected in any of the uploaded projects is illustrated for each bin. Clicking on one of these bin buttons results in the listing of all identified gene transcripts along with the descriptions of the corresponding genes and exact localizations on the chromosome. Moreover, a link is provided for each gene transcript that connects to the EnsEMBL homepage displaying the full annotation of that transcript. In addition to the general annotation of the given gene transcript, the pop-up EnsEMBL page will show all peptides that have been identified via the MAPU 2.0 DAS source (12). Thus, whenever a web user requests the information provided by MAPU 2.0 on EnsEMBL, the data included in the MAPU 2.0 database are illustrated via the DAS/Proserver system (13). Clicking on one of the illustrated peptides yields a report of all the cell types that contain the peptides for this gene transcript. In addition to the MAPU 2.0 DAS source, we have also established a PHOSIDA DAS source providing all phosphorylation sites that have been unambiguously identified (Class 1 sites) (14), but also phosphosites that lack precise identification within the phosphorylated peptide sequence due to insufficient fragment information in MS/MS (ambiguous sites).
SUMMARY AND PERSPECTIVES
MAPU 2.0 is a database specifically created for high-resolution, high-accuracy proteomic data. It provides a user-friendly environment and several of its concepts are innovative and could be transferred to proteomic databases of a more general nature. We addressed MS-specific problems including ambiguous peptide-to-protein assignments by straightforward approaches such as color highlighting of given peptide sequences. In addition, we used the proteomic data that are integrated in MAPU 2.0 to annotate the genome via the DAS technology provided by the EnsEMBL project. MAPU 2.0 is becoming a member of the ProteomExchange Consortium, allowing its data to be exchanged with other databases.
Mass spectrometric data is becoming much more accurate and faster to produce, paralleling in some ways the advent of next generation sequencing technology. This will also bring particular opportunities and challenges. For instance, we believe that proteomic data is now sufficiently readily produced in high quality, that it does not make sense to store all proteomics results accompanying publications in central databases, particularly if the data was generated in ‘one-off ’ projects and with low resolution technology. Instead, reference proteomes should be measured with extremely high-accuracy and in dedicated state of the art facilities. We intend to further develop MAPU with a view to serve as a model database for such high-accuracy reference proteomes.
FUNDING
Marie Curie Fellowship (to F.G.). Part of this work was supported by ‘Interaction Proteome’ as 6th Framework program by the EU directorate, which also funded for open access charge.
Conflict of interest statement. None declared.
ACKNOWLEDGEMENT
We thank Andrew Jenkinson and Eugene Kulesha for helping to establish the DAS system for MAPU 2.0, Phani Garapati and Markus Fritz for testing the web application and Michael Schuster for suggestions. We also thank all of the users of our website and especially those who have provided feedback.
REFERENCES
- 1.Aebersold R, Mann M. Mass spectrometry-based proteomics. Nature. 2003;422:198–207. doi: 10.1038/nature01511. [DOI] [PubMed] [Google Scholar]
- 2.Mann M, Kelleher NL. PNAS. 2008. Precision proteomics: the case for high resolution and high mass accuracy. doi:10.1073/pnas.0800788105. [DOI] [PMC free article] [PubMed] [Google Scholar]
- 3.Jones P, Cote RG, Martens L, Quinn AF, Taylor CF, Derache W, Hermjakob H, Apweiler R. PRIDE: a public repository of protein and peptide identifications for the proteomics community. Nucleic Acids Res. 2006;34:D659–D663. doi: 10.1093/nar/gkj138. [DOI] [PMC free article] [PubMed] [Google Scholar]
- 4.Desiere F, Deutsch EW, King NL, Nesvizhskii AI, Mallick P, Eng J, Chen S, Eddes J, Loevenich SN, Aebersold R. The PeptideAtlas project. Nucleic Acids Res. 2006;34:D655–D658. doi: 10.1093/nar/gkj040. [DOI] [PMC free article] [PubMed] [Google Scholar]
- 5.Deutsch EW, Lam H, Aebersold R. PeptideAtlas: a resource for target selection for emerging targeted proteomics workflows. EMBO Rep. 2008;9:429–434. doi: 10.1038/embor.2008.56. [DOI] [PMC free article] [PubMed] [Google Scholar]
- 6.Craig R, Cortens JP, Beavis RC. Open source system for analyzing, validating, and storing protein identification data. J. Proteome Res. 2004;3:1234–1242. doi: 10.1021/pr049882h. [DOI] [PubMed] [Google Scholar]
- 7.Craig R, Cortens JC, Fenyo D, Beavis RC. Using annotated peptide mass spectrum libraries for protein identification. J. Proteome Res. 2006;5:1843–1849. doi: 10.1021/pr0602085. [DOI] [PubMed] [Google Scholar]
- 8.Hermjakob H, Apweiler R. The Proteomics Identifications Database (PRIDE) and the ProteomExchange Consortium: making proteomics data accessible. Expert Rev. Proteomics. 2006;3:1–3. doi: 10.1586/14789450.3.1.1. [DOI] [PubMed] [Google Scholar]
- 9.Zhang Y, Zhang Y, Adachi J, Olsen JV, Shi R, de Souza G, Pasini E, Foster LJ, Macek B, Zougman A, et al. MAPU: Max-Planck Unified database of organellar, cellular, tissue and body fluid proteomes. Nucleic Acids Res. 2007;35:D771–D779. doi: 10.1093/nar/gkl784. [DOI] [PMC free article] [PubMed] [Google Scholar]
- 10.The UniProt Consortium. The universal protein resource (UniProt) Nucleic Acids Res. 2008;36:D190–D195. doi: 10.1093/nar/gkm895. [DOI] [PMC free article] [PubMed] [Google Scholar]
- 11.Flicek P, Aken BL, Beal K, Ballester B, Caccamo M, Chen Y, Clarke L, Coates G, Cunningham F, Cutts T, et al. Ensembl 2008. Nucleic Acids Res. 2008;36:D707–D714. doi: 10.1093/nar/gkm988. [DOI] [PMC free article] [PubMed] [Google Scholar]
- 12.Dowell RD, Jokerst RM, Day A, Eddy SR, Stein L. The distributed annotation system. BMC Bioinformatics. 2001;2:7. doi: 10.1186/1471-2105-2-7. [DOI] [PMC free article] [PubMed] [Google Scholar]
- 13.Finn RD, Stalker JW, Jackson DK, Kulesha E, Clements J, Pettett R. ProServer: a simple, extensible Perl DAS server. Bioinformatics. 2007;23:1568–1570. doi: 10.1093/bioinformatics/btl650. [DOI] [PMC free article] [PubMed] [Google Scholar]
- 14.Olsen JV, Blagoev B, Gnad F, Macek B, Kumar C, Mortensen P, Mann M. Global, in vivo, and site-specific phosphorylation dynamics in signaling networks. Cell. 2006;127:635–648. doi: 10.1016/j.cell.2006.09.026. [DOI] [PubMed] [Google Scholar]
- 15.Gnad F, Ren S, Cox J, Olsen JV, Macek B, Oroshi M, Mann M. PHOSIDA (phosphorylation site database): management, structural and evolutionary investigation, and prediction of phosphosites. Genome Biol. 2007;8:R250. doi: 10.1186/gb-2007-8-11-r250. [DOI] [PMC free article] [PubMed] [Google Scholar]
- 16.Kersey PJ, Duarte J, Williams A, Karavidopoulou Y, Birney E, Apweiler R. The International Protein Index: an integrated database for proteomics experiments. Proteomics. 2004;4:1985–1988. doi: 10.1002/pmic.200300721. [DOI] [PubMed] [Google Scholar]
- 17.Nesvizhskii AI, Aebersold R. Interpretation of shotgun proteomic data: the protein inference problem. Mol. Cell Proteomics. 2005;4:1419–1440. doi: 10.1074/mcp.R500012-MCP200. [DOI] [PubMed] [Google Scholar]
- 18.Ashburner M, Ball CA, Blake JA, Botstein D, Butler H, Cherry JM, Davis AP, Dolinski K, Dwight SS, Eppig JT, et al. Gene ontology: tool for the unification of biology. Nat. Genet. 2000;25:25–29. doi: 10.1038/75556. [DOI] [PMC free article] [PubMed] [Google Scholar]
- 19.Ong SE, Mann M. Mass spectrometry-based proteomics turns quantitative. Nat. Chem. Biol. 2005;1:252–262. doi: 10.1038/nchembio736. [DOI] [PubMed] [Google Scholar]
- 20.Foster LJ, de Hoog CL, Zhang Y, Xie X, Mootha VK, Mann M. A mammalian organelle map by protein correlation profiling. Cell. 2006;125:187–199. doi: 10.1016/j.cell.2006.03.022. [DOI] [PubMed] [Google Scholar]
- 21.Pasini EM, Kirkegaard M, Mortensen P, Lutz HU, Thomas AW, Mann M. In-depth analysis of the membrane and cytosolic proteome of red blood cells. Blood. 2006;108:791–801. doi: 10.1182/blood-2005-11-007799. [DOI] [PubMed] [Google Scholar]


