Abstract
The GABI Primary Database, GabiPD (http://www.gabipd.org/), was established in the frame of the German initiative for Genome Analysis of the Plant Biological System (GABI). The goal of GabiPD is to collect, integrate, analyze and visualize primary information from GABI projects. GabiPD constitutes a repository and analysis platform for a wide array of heterogeneous data from high-throughput experiments in several plant species. Data from different ‘omics’ fronts are incorporated (i.e. genomics, transcriptomics, proteomics and metabolomics), originating from 14 different model or crop species. We have developed the concept of GreenCards for text-based retrieval of all data types in GabiPD (e.g. clones, genes, mutant lines). All data types point to a central Gene GreenCard, where gene information is integrated from genome projects or NCBI UniGene sets. The centralized Gene GreenCard allows visualizing ESTs aligned to annotated transcripts as well as displaying identified protein domains and gene structure. Moreover, GabiPD makes available interactive genetic maps from potato and barley, and protein 2DE gels from Arabidopsis thaliana and Brassica napus. Gene expression and metabolic-profiling data can be visualized through MapManWeb. By the integration of complex data in a framework of existing knowledge, GabiPD provides new insights and allows for new interpretations of the data.
INTRODUCTION
Experimental studies in the post-genomic era generate a very large amount of data from high-throughput experiments on biological systems. Current studies include, among others, expression and metabolite profiles, proteome and interaction data (e.g. DNA–protein and protein–protein interactions), collected at different space and time scales. This increasing flow of data requires computational systems that, besides managing efficiently the enormous quantity of data, are capable of integrating and displaying these disparate data collections in a meaningful and user-friendly way. We have developed the GABI primary database, GabiPD, in order to fulfill these requirements.
GabiPD is a web-accessible database that was developed in the frame of the German initiative for Genome Analysis of the Plant Biological System (Genomanalyse im biologischen System Pflanze, GABI). GabiPD allows a seamless integration of varied ‘omics’ data types obtained from plant systems and will follow the MIAME (1) and MIAMET (2) standards for storing gene expression and metabolic-profiling data, respectively. Its flexible design allows for a high level of data integration, and eases cross-referencing the different GabiPD data types among each other (e.g. mapping information, sequences and single nucleotide polymorphisms (SNP), 2DE gel images and protein information) and access to public gene/protein-specific information, which in turn provides the users a comprehensive overview of the available information for their particular gene or protein of interest. The integration with genome databases like TAIR (3) and general nucleotide databases like GenBank, as well as cross-links to secondary databases, such as ARAMEMNON (4), PlnTFDB (5), GABI-KAT (6), PhosPhAt (7) and ProMEX (8) further increase the usefulness of GabiPD.
METHODS AND CONTENTS
Design and implementation
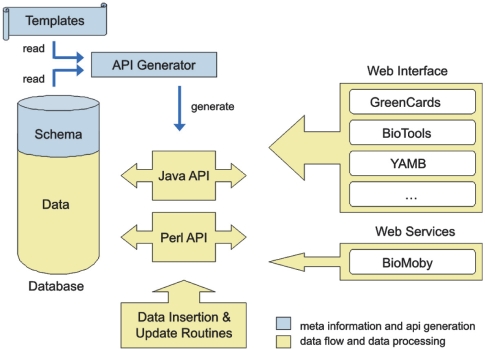
GabiPD's web interface was developed using Perl and Java in combination with template processing to separate the visualization from the application logic. Our applications are database driven, which means that the application interface logic is derived directly from the database structure (shown in blue in Figure 1). To achieve this, we deploy reverse engineering methods in combination with template processing to generate interfaces to programming languages like Perl or Java, thus supporting all the database-specific actions like ‘insert’, ‘update’, ‘delete’ or ‘select’. These object-oriented interfaces are automatically generated from the database schema, supporting inheritance, automated key generation and advanced exception handling. The separation of the database application interface from the application and visualization logic (shown in yellow in Figure 1) facilitates fast adjustment to modifications of the data structure and diminishes the efforts on fixing existing application logic during larger database changes.
Figure 1.
Schematic overview of the GabiPD structure. The ‘API Generator’ translates the ‘Templates’ using the database meta-information (shown in blue), generating the database application interface (Java and Perl API). The main applications, i.e. ‘Web Interface’, ‘Web Services’ and data manipulation routines, interacts with the ‘Database’ through the database application interface (shown in yellow).
GabiPD content and gene-centric views
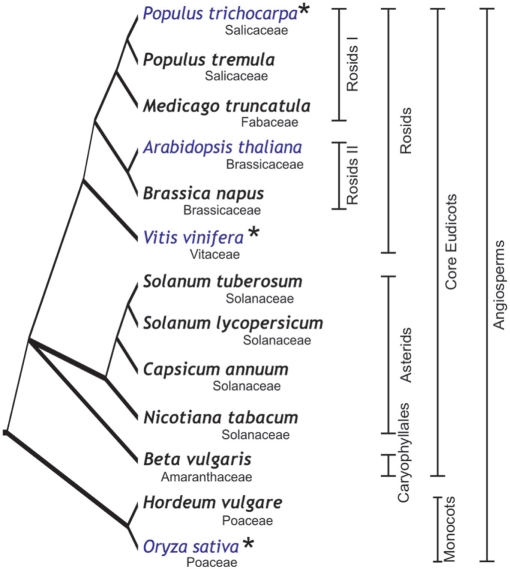
Currently, GabiPD includes data originating from 14 different angiosperm species representing the most important lineages in the flowering plants (Figure 2). Arabidopsis thaliana is the most widely represented model species, followed by the crop plants Solanum tuberosum (potato) and Hordeum vulgare (barley). In GabiPD, genomic, transcriptomic, proteomic and metabolomic data are integrated from those species. Genomic data comprise mapping information, sequences and SNP/InDel information. Transcriptomics is represented by a large number of ESTs and corresponding sequence trace files. ESTs are further analysed by BLAST and ORF analysis. For barley, in addition, EST clustering results and corresponding information on a new 27K unigene set is accessible and downloadable. As a type of proteomic data, annotated 2DE gel images from Arabidopsis thaliana and Brassica napus are integrated. Moreover, transcript and metabolite-profiling data are provided via MapManWeb.
Figure 2.
Phylogenetic tree depicting the evolutionary relationships among the species represented in GabiPD (15–17). Species for which whole-genome sequences and annotations are available are shown in blue. Asterisk indicates species that will soon be integrated in GabiPD. Species not shown: S. bulbocastanum, S. demissum, S. phureja and S. spegazzinii.
Most entries of all GabiPD data types are pointing to the central Gene GreenCard and vice versa (see Figure 3 and next section). In the Gene GreenCard, gene information from genome annotation projects or NCBI UniGene sets is integrated and useful links to secondary databases are provided. Currently, the genome annotation (TAIR version 7.0) for A. thaliana (3) is integrated. Annotations for other sequenced species will follow. In order to ease the transfer of knowledge from sequenced to non-sequenced species, i.e. crop plants, we have performed similarity-based mappings between closely related species, i.e. Arabidopsis and Brassica spp.
Figure 3.
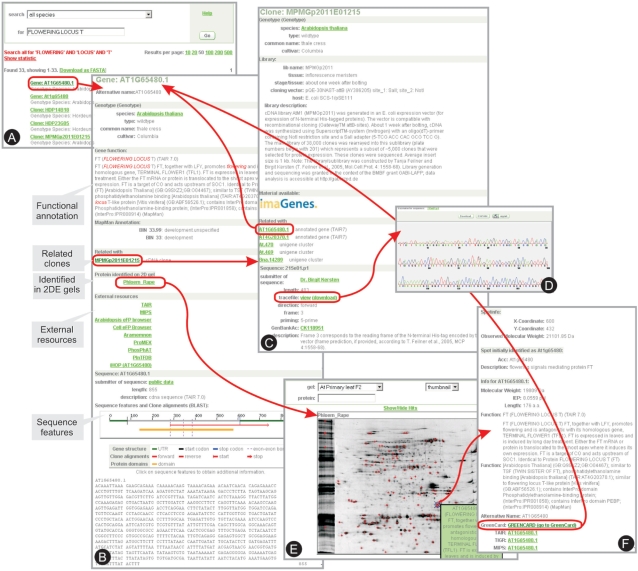
Example of a keyword search using GreenCards. (A) The user had performed a search for the keywords ‘FLOWERING LOCUS T’, which retrieves links to the GreenCards of Genes (genome annotation projects), Clones (ESTs) and Plants (mutant plant lines). (B) Display of the Gene GreenCard, corresponding to the Arabidopsis annotated gene AT1G65480.1. Here, the users find high confidence matching EST sequences displayed in the ‘Related with’ section. Sequence features and the sequences themselves are displayed as well. The selected gene has a matching EST (Clone: MPMGp2011E01215), this Clone GreenCard is shown in (C) and links back to the Gene GreenCard and to the original EST trace file, displayed by JTrev (D). A protein spot in rapeseed (B. napus) has been identified by 2DE/MS as the protein encoded by the retrieved gene, and a link directs the user to the 2DE gel image with the identified protein spot highlighted with blue cross-hair (E). The spot identified links to a description of the protein (F) that provides links to the original Gene GreenCard.
Querying the database
We have developed the concept of ‘GreenCards’ as a central entry-point for text-based data queries and visualization, which grant public as well as credentials-based access to the integrated data in GabiPD. ‘GreenCards’ enable users to comprehensively query GabiPD by genotype name, marker or gene name, keyword or GenBank sequence accession number. Searches can be restricted to selected species or data types, while wildcards can be used to broaden the scope of the query. The result of a ‘GreenCard’ search is presented as a list of hits with links to complete descriptions, i.e. GreenCards. Figure 3 shows an example of this type of search, where the user had entered the gene name ‘FLOWERING LOCUS T ’ as a search term. This search retrieves, among others, an Arabidopsis ‘Gene GreenCard’ (gene: AT1G65480.1) corresponding to the genome annotation project and ‘Plant GreenCards’ representing T-DNA insertion lines, e.g. plant 290E08, with flanking sequences that have BLAST hits to the gene AT1G65480.1 and with seeds available from GABI-KAT (6). Moreover, several ‘Clone GreenCards’ of cDNA clones (e.g. clone: MPMGp2011E01215) in which the keyword is found were retrieved by the search. A more strict relationship between the Gene GreenCard and the Plant and Clone GreenCards is established by similarity-based searches. The best BLAST hit of the sequence, e.g. representing relationship to a cDNA clone or a mutant plant line, appears in the section ‘Related with’, and the users can go from the clone or the plant line to the associated gene or vice versa.
Furthermore, the ‘Gene GreenCard’, which displays information from genome annotation projects and NCBI UniGene sets, has been extended to include links to secondary databases, such as ARAMEMNON (4), GABI-KAT (6) and ProMEX (8). Additionally, schematic representations of gene sequence features are provided to highlight protein domains identified using the latest PFAM library (9), exon–exon borders and untranslated regions (UTRs) identified by the genome annotation projects (Figure 3). These features are displayed onto a representation of the cDNA sequence.
Alternatively, users can enter their own amino acid or nucleotide sequence to identify, by a BLAST search (10), similar sequences integrated in GabiPD.
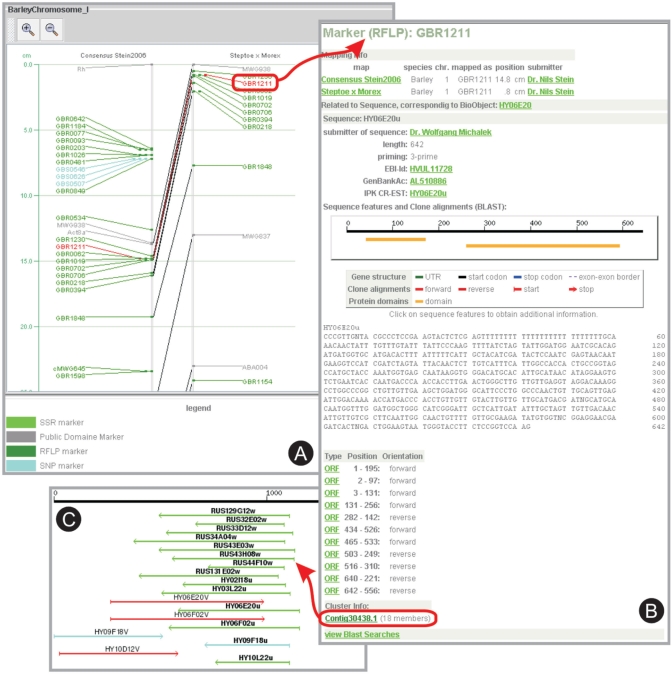
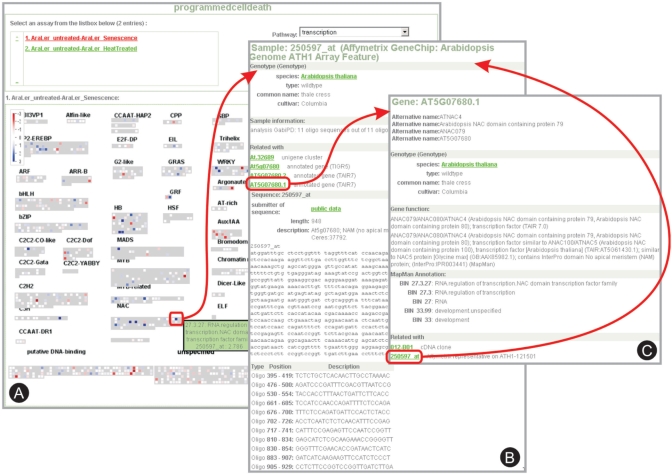
In addition to the GreenCard and BLAST search functionality, users can browse and search the genetic maps and 2DE gels stored in GabiPD, through specifically designed visualization tools: (i) 2DEGelViewer by which 2DE gel images can be viewed in an interactive way, which allows retrieving extra information on 2D spots as identified by mass spectrometry (Figure 3); (ii) genetic mapping data can be visualized using YAMB (Yet Another Map Browser; Figure 4) with the possibility to view details on all mapped elements (11), (iii) MapManWeb (Figure 5) allows the visualization and extraction of relevant information from transcript and metabolite-profiling data and the graphical mapping of such data onto diagrams of metabolic pathways and other biological processes (12); and (iv) an extended version of JTrev (13) allows the display of sequence traces with integrated SNP information.
Figure 4.
Visualization of the genetic maps published by Stein et al. (18). (A) The region between 0cM and 25 cM of barley chromosome I is shown in YAMB; markers with SNPs are shown in light blue, markers with restriction fragment length polymorphisms (RFLPs) are shown in dark green. A selected marker is displayed in red, and links to the Marker GreenCard (B), which contains information on a related EST therewith connecting genomic with transcriptomic information. With the EST description, cluster information is included (Contig30438.1) that links to the schematic representation of all ClusterContig members displayed onto the related consensus sequence (C). ESTs that were selected from this ClusterContig as representatives for the new 27K barley unigene set are shown in turquoise.
Figure 5.
Visualization of expression profile data in MapManWeb. (A) The Affymetrix® NASC Array experiment on programmed cell death in Arabidopsis is displayed (NASCArrays reference number: 30). MapManWeb allows the visualization of expressed genes in different biological processes; here only probesets (i.e. genes) involved in transcription regulation are shown. (B) Details for a strongly down-regulated probeset, with links to the related Gene GreenCard in A. thaliana. (C) The Gene GreenCard for the selected gene (ANAC79) links back to the probeset of the Affymetrix® ATH1 array.
The GabiPD project page serves as an additional gateway to specific data by providing project-specific views, such as BreedCAM or PoMaMo (11) where potato genomic data and Solanaceae function maps for pathogen resistance are accessible.
ADDITIONAL TOOLS AVAILABLE FROM GABIPD
In addition to the data and data visualization available from our site, the newest versions of the following tools are made available for download:
MapMan desktop version: a user-driven software tool that displays large datasets (e.g. gene expression data from Arabidopsis Affymetrix arrays) onto diagrams of biological processes, such as metabolic pathways (12).
SATlotyper: a software tool designed for inferring haplotypes and phased genotypes from unphased SNP data for polyploid and polyallelic heterozygous populations (14).
FUTURE DIRECTIONS
The presentation of a wide spectrum of different plant species in GabiPD paves the way for cross-species comparisons that are facilitated by the availability of BLAST hits between the GabiPD sequences and plant NCBI UniGene sets. To ease the transfer of knowledge from sequenced to non-sequenced plant species, the genome annotations of Oryza sativa, Populus trichocarpa and Vitis vinifera will be added and mapped to closely related species in the near future. Furthermore, information about orthologous genes will be included for cross-species studies. Moreover, we will extend our WebServices to provide programmatic access to multiple data types for all plant species in GabiPD.
FUNDING
German Ministry for Education and Research (BMBF) (GABI I: 0312272, GABI II: 0313112 and GABI-FUTURE: 0315046); the former German Resource Center for Genome Research (RZPD) GmbH; Max Planck Society. Funding for open access charge: Max Planck Society.
Conflict of interest statement. None declared.
ACKNOWLEDGEMENTS
The GabiPD team thanks the GABI and the WPG (Wirtschaftsverbund Pflanzengenomforschung GABI e.V.) community for providing data and supporting the continuous development of the database. Dr Björn Usadel is acknowledged for helpful discussions and his support in the development of MapManWeb. We wish to thank Dr Patrick Schweitzer, Dr Lothar Altschmied, Dr Uwe Scholz and Dr Nils Stein for the collaboration in the generation of the new 27K barley unigene set and Dr Kathryn F. Beal for sharing the source code of the trace viewer JTrev. Özgür Demir and Sebastian Köhler are acknowledged for further developments of user interfaces and for data integration.
REFERENCES
- 1.Ball CA, Brazma A. MGED standards: work in progress. Omics. 2006;10:138–144. doi: 10.1089/omi.2006.10.138. [DOI] [PubMed] [Google Scholar]
- 2.Jenkins H, Hardy N, Beckmann M, Draper J, Smith AR, Taylor J, Fiehn O, Goodacre R, Bino RJ, Hall R, et al. A proposed framework for the description of plant metabolomics experiments and their results. Nat. Biotechnol. 2004;22:1601–1606. doi: 10.1038/nbt1041. [DOI] [PubMed] [Google Scholar]
- 3.Swarbreck D, Wilks C, Lamesch P, Berardini TZ, Garcia-Hernandez M, Foerster H, Li D, Meyer T, Muller R, Ploetz L, et al. The Arabidopsis Information Resource (TAIR): gene structure and function annotation. Nucleic Acids Res. 2008;36:D1009–D1014. doi: 10.1093/nar/gkm965. [DOI] [PMC free article] [PubMed] [Google Scholar]
- 4.Schwacke R, Schneider A, van der Graaff E, Fischer K, Catoni E, Desimone M, Frommer WB, Flugge UI, Kunze R. ARAMEMNON, a novel database for Arabidopsis integral membrane proteins. Plant Physiol. 2003;131:16–26. doi: 10.1104/pp.011577. [DOI] [PMC free article] [PubMed] [Google Scholar]
- 5.Riaño-Pachón DM, Ruzicic S, Dreyer I, Mueller-Roeber B. PlnTFDB: an integrative plant transcription factor database. BMC Bioinformatics. 2007;8:42. doi: 10.1186/1471-2105-8-42. [DOI] [PMC free article] [PubMed] [Google Scholar]
- 6.Li Y, Rosso MG, Viehoever P, Weisshaar B. GABI-Kat SimpleSearch: an Arabidopsis thaliana T-DNA mutant database with detailed information for confirmed insertions. Nucleic Acids Res. 2007;35:D874–D878. doi: 10.1093/nar/gkl753. [DOI] [PMC free article] [PubMed] [Google Scholar]
- 7.Heazlewood JL, Durek P, Hummel J, Selbig J, Weckwerth W, Walther D, Schulze WX. PhosPhAt: a database of phosphorylation sites in Arabidopsis thaliana and a plant-specific phosphorylation site predictor. Nucleic Acids Res. 2008;36:D1015–D1021. doi: 10.1093/nar/gkm812. [DOI] [PMC free article] [PubMed] [Google Scholar]
- 8.Hummel J, Niemann M, Wienkoop S, Schulze W, Steinhauser D, Selbig J, Walther D, Weckwerth W. ProMEX: a mass spectral reference database for proteins and protein phosphorylation sites. BMC Bioinformatics. 2007;8:216. doi: 10.1186/1471-2105-8-216. [DOI] [PMC free article] [PubMed] [Google Scholar]
- 9.Finn RD, Tate J, Mistry J, Coggill PC, Sammut SJ, Hotz HR, Ceric G, Forslund K, Eddy SR, Sonnhammer EL, et al. The Pfam protein families database. Nucleic Acids Res. 2008;36:D281–D288. doi: 10.1093/nar/gkm960. [DOI] [PMC free article] [PubMed] [Google Scholar]
- 10.Altschul SF, Gish W, Miller W, Myers EW, Lipman DJ. Basic local alignment search tool. J. Mol. Biol. 1990;215:403–410. doi: 10.1016/S0022-2836(05)80360-2. [DOI] [PubMed] [Google Scholar]
- 11.Meyer S, Nagel A, Gebhardt C. PoMaMo-a comprehensive database for potato genome data. Nucleic Acids Res. 2005;33:D666–D670. doi: 10.1093/nar/gki018. [DOI] [PMC free article] [PubMed] [Google Scholar]
- 12.Usadel B, Nagel A, Thimm O, Redestig H, Blaesing OE, Palacios-Rojas N, Selbig J, Hannemann J, Piques MC, Steinhauser D, et al. Extension of the visualization tool MapMan to allow statistical analysis of arrays, display of corresponding genes, and comparison with known responses. Plant Physiol. 2005;138:1195–1204. doi: 10.1104/pp.105.060459. [DOI] [PMC free article] [PubMed] [Google Scholar]
- 13.Bonfield JK, Beal KF, Betts MJ, Staden R. Trev: a DNA trace editor and viewer. Bioinformatics. 2002;18:194–195. doi: 10.1093/bioinformatics/18.1.194. [DOI] [PubMed] [Google Scholar]
- 14.Neigenfind J, Gyetvai G, Basekow R, Diehl S, Achenbach U, Gebhardt C, Selbig J, Kersten B. Haplotype inference from unphased SNP data in heterozygous polyploids based on SAT. BMC Genomics. 2008;9:356. doi: 10.1186/1471-2164-9-356. [DOI] [PMC free article] [PubMed] [Google Scholar]
- 15.Soltis PS, Soltis DE. The origin and diversification of angiosperms. Am. J. Bot. 2004;91:1614–1626. doi: 10.3732/ajb.91.10.1614. [DOI] [PubMed] [Google Scholar]
- 16.Angiosperm Phylogeny Group. An update of the Angiosperm Phylogeny Group classification for the orders and families of flowering plants: APG II. Bot. J. Linn. Soc. 2003;141:399–436. [Google Scholar]
- 17.Knapp S. Tobacco to tomatoes: a phylogenetic perspective on fruit diversity in the Solanaceae. J. Exp. Bot. 2002;53:2001–2022. doi: 10.1093/jxb/erf068. [DOI] [PubMed] [Google Scholar]
- 18.Stein N, Prasad M, Scholz U, Thiel T, Zhang H, Wolf M, Kota R, Varshney RK, Perovic D, Grosse I, et al. A 1,000-loci transcript map of the barley genome: new anchoring points for integrative grass genomics. Theor. Appl. Genet. 2007;114:823–839. doi: 10.1007/s00122-006-0480-2. [DOI] [PubMed] [Google Scholar]


