


Abstract
The Gene Expression Omnibus (GEO) at the National Center for Biotechnology Information (NCBI) is the largest public repository for high-throughput gene expression data. Additionally, GEO hosts other categories of high-throughput functional genomic data, including those that examine genome copy number variations, chromatin structure, methylation status and transcription factor binding. These data are generated by the research community using high-throughput technologies like microarrays and, more recently, next-generation sequencing. The database has a flexible infrastructure that can capture fully annotated raw and processed data, enabling compliance with major community-derived scientific reporting standards such as ‘Minimum Information About a Microarray Experiment’ (MIAME). In addition to serving as a centralized data storage hub, GEO offers many tools and features that allow users to effectively explore, analyze and download expression data from both gene-centric and experiment-centric perspectives. This article summarizes the GEO repository structure, content and operating procedures, as well as recently introduced data mining features. GEO is freely accessible at http://www.ncbi.nlm.nih.gov/geo/.
INTRODUCTION
The Gene Expression Omnibus (GEO) repository was established in 2000 (1) to host and freely disseminate high-throughput gene expression data. The database is built and maintained by the National Center for Biotechnology Information (NCBI), a division of the National Library of Medicine (NLM), located on the campus of the National Institutes of Health (NIH) in Bethesda, MD, USA. The data are contributed by the research community, often in compliance with grant or journal directives that require data to be made publicly available, thus allowing others to access, evaluate and re-analyze results.
The three principal objectives of this project are to:
provide a robust, versatile database in which to efficiently store high-throughput functional genomic data;
offer the simplest submission procedures and formats that support complete and well-annotated data deposits from the research community; and
provide user-friendly mechanisms that allow users to query, locate, review and download experiments of interest.
The fulfillment of these goals can be assessed in terms of database growth and usage. Today the database holds over 10 000 experiments comprising 300 000 samples, 16 billion individual abundance measurements, for over 500 organisms, submitted by 5000 laboratories from around the world. The database typically receives over 60 000 query hits and 10 000 bulk FTP downloads per day, and has been cited in over 5000 manuscripts.
The ‘Omix’ division
In recent years, microarray technology has seen an explosion of applications that go far beyond analyzing gene expression levels. Examples of such studies include those that examine genome single nucleotide polymorphism (SNP) and copy number variations (commonly called ‘array comparative genomic hybridization’, or aCGH), genome–protein binding surveys (commonly called ‘chromatin immunoprecipitation on chip’, or ChIP–chip), and various epigenomic factors such as nucleosomal positioning and genome methylation status. Additionally, non-array-based methodologies such as next-generation sequencing are increasingly being applied to such genome-wide investigations (2). Despite the fact that GEO was initially set up to store gene expression data generated by microarrays and serial analysis of gene expression (SAGE), the flexible design of the database allows these non-expression or alternative high-throughput data types to be similarly hosted with little extra effort or overhead. Thus, we have been accommodating to requests to accept such data and extended the minimal standards to fit these types. In fact, at the time of writing, over 15% of the data in GEO are non-expression data. Consequently, the name of the database, Gene Expression Omnibus, has become somewhat misleading and perhaps confusing to users. To address this concern, the non-expression data have recently been placed under a new division called ‘Omix’, which denotes a mixture of ‘omic data. Other than a handful of minor issues specific to certain data types, the submission and download procedures and formats for Omix data are largely the same as for GEO. Additionally, equivalent levels of data reporting standards as established for expression data (3,4) are being applied to these other ‘omic types. This includes requiring raw data, processed data, protocols and adequate sample and experiment descriptive data. All experiments in GEO and Omix have been newly assigned into broad experiment types, making it much easier for users to locate specific data or technology types.
High-throughput sequence data
GEO recently began processing high-throughput sequence data submissions (5–7). It can be expected that next-generation sequencing technologies will become widely used and have a considerable impact on genome-wide surveys (2). GEO accepts sequence data for studies that examine gene expression, gene regulation, epigenetics, or other studies where measuring sequence abundance is central to the experiment design. GEO hosts the processed and analyzed sequence data, together with sample and experiment metadata; raw data files are brokered to NCBI's Short Read Archive sequence database, ensuring that these sequence data are integrated with NCBI's collection of sequence-specific resources (8).
DATABASE STRUCTURE AND DATA FLOW
As discussed in the Introduction section, the GEO database archives a wide variety of rapidly evolving, large-scale, functional genomic experiment types. These experiments generate data of many different file types, formats and content which consequently present considerable challenges in terms of data handling and querying. The GEO database has built-in flexibility to accommodate diverse data types. Notably, tabular data are not fully granulated in the core database. Rather, they are stored as plain text, tab-delimited tables that have no restrictions on the number of rows or columns allowed. Some columns, however, reserve special meaning, and data from these are extracted to secondary databases and used in downstream query and analysis applications as described in the GEO DataSets section. Accompanying supplementary and native file types are linked from each record and stored on an FTP server. Contextual biological and other descriptive metadata are stored in designated fields within database tables with appropriate relations and restrictions.
Submitter-supplied data
The overall structure of the core GEO database remains as described previously (1,9). Briefly, data submitted to GEO are stored in a relational MSSQL database partitioned into three entity types:
A Platform record is composed of a summary description of the array and a data table defining the array template. For sequence-based technologies, the Platform lists the sequences detected and identified in that experiment. Each row in the table corresponds to a single feature, and includes sequence annotation and tracking information as provided by the submitter. The table may contain any number of columns allowing thorough annotation of the array. Each Platform record is assigned a unique and stable GEO accession number with prefix GPL. A Platform may reference many Samples that have been submitted by multiple submitters.
A Sample record is composed of a description of the biological material and the experimental protocols to which it was subjected, and a data table containing abundance measurements for each feature on the corresponding Platform. The table may contain any number of columns in which to comprehensively present results. The metadata fields may hold very large volumes of text to allow elaborate descriptions of the biological source and protocols. Each Sample record is assigned a unique and stable GEO accession number with prefix GSM. A Sample must reference only one Platform and may be included in multiple Series. A Sample record will typically include supplementary files containing the raw (non-normalized) measured data, linked with the primary record.
A Series record defines a set of related Samples considered to be part of a study, and describes the overall study aim and design. Each Series record is assigned a unique and stable GEO accession number with prefix GSE. Series records may contain one or more summary tables and supplementary files.
GEO DataSets
The submitter-supplied objects described above are very heterogeneous with regards to the style, content and level of detail with which the experiments are described. But despite this diversity, all expression-based submissions share a common core set of elements:
sequence identity tracking information of each feature on the Platform;
normalized expression measurements; and
text describing the biological source and experiment aim.
Through a procedure that employs both automated data extraction and manual curation, these three categories of information are captured from the submitter-supplied records and organized into an upper-level object called a GEO DataSet. A DataSet represents a collection of consistently processed experimentally related Sample records, summarized and categorized according to experimental variables. Each DataSet is assigned a unique GEO accession number with prefix GDS. DataSets are a means for transforming diverse styles of incoming data into a relatively standardized format upon which downstream data analysis and data display tools can be built. At this time, only expression-based DataSets are being generated.
DataSets provide two distinct renderings of the data (Figure 1):
an experiment-centered representation that encapsulates the entire study. This information is presented as a DataSet record which comprises a synopsis of the experiment, a breakdown of the experimental variables, access to auxiliary objects, several data display and analysis tools and download options; and
a gene-centered representation that presents quantitative gene expression measurements for one gene across a DataSet. This information is presented as a GEO Profile, and comprises gene identity annotation, DataSet title, links to auxiliary information and a chart depicting the expression level and rank of that gene across each Sample in the DataSet. Gene annotation is derived from querying sequence identifiers (e.g. GenBank accessions, clone IDs) with the latest Entrez Gene and UniGene databases, an important point given the dynamic nature of gene annotation (10).
Figure 1.

A selection of GEO screenshots. The DataSet Browser (A) enables simple keyword searches for DataSets. When a DataSet is selected, a window appears (B) which contains detailed information about that DataSet, download options, and links to analysis features including gene expression profiles (C). Each expression profile can be viewed in more detail to see the activity of that gene across all Samples in the DataSet (D).
SUBMISSION PROCEDURES, FORMATS AND STANDARDS
Great emphasis has been placed on making data deposit procedures as simple as possible for submitters, while not compromising the level of experimental annotation required (11). Four submission options are offered: web forms, spreadsheets, a plain text format and an XML format (Table 1). All these formats are designed to capture all components of the MIAME checklist (4). Deciding which method to use depends on the volume, type of data to be submitted and current data format. To further ease the submission process, native files are requested where possible (e.g. Affymetrix CHP and CEL files). No matter what deposit method is used, the final GEO records will look similar and contain equivalent information. A skilled team of curators is on hand to assist researchers should any questions arise about submission procedures (email: geo@ncbi.nlm.nih.gov).
Table 1.
GEO deposit options and formats
| Option | Format | Key Points |
|---|---|---|
| Web deposit | Web forms | Deposit of individual records. Simple step-by-step interactive web forms. |
| GEOarchive | Spreadsheets (e.g. Excel) | Batch deposit. Good choice for most users who have many Samples to submit. |
| SOFT (Simple Omnibus Format in Text) | Plain text | Batch deposit. A simple, line-based, tab-delimited format that can be readily generated, particularly if the data are already in a database. |
| MINiML (MIAME notation in Markup Language) | XML | Batch deposit. Basically an XML rendering of SOFT format, and similarly suitable if data are already in a database. The XML schema definition is available at the GEO website. |
Detailed documentation and example submission templates are available online at http://www.ncbi.nlm.nih.gov/projects/geo/info/submission.html.
All data undergo syntactic validation upon upload. A member of the curation team reviews each record to ensure that data are organized correctly and contain sufficient information to interpret the experiment. If content or structural problems are identified, or if critical MIAME components are missing, the curator works with the submitter until the issue is resolved or explained. Submissions are typically approved within 2–5 days, but expedited approval can be performed on request. Researchers are provided the capability to update their records at any time. Records may be kept private until a manuscript describing the data is published. Submitters may generate a temporary reviewer URL that grants anonymous, confidential access to their private data, typically via a journal editor. Guidelines for reviewers and editors regarding how to access and evaluate private data are provided at http://www.ncbi.nlm.nih.gov/projects/geo/info/reviewer.html.
TOOLS TO RETRIEVE, EXPLORE AND VIZUALIZE DATA
Given the wide scope of biological projects and organisms represented in GEO experiments, it is crucial to provide effective query tools so users can quickly locate, analyze and visualize data relevant to their specific interests. A summary of the main query features, and their location and purpose, is provided in Table 2. Figure 2 depicts a schematic overview of the query workflow and how the various features and tools are interlinked.
Table 2.
A summary of the location and purpose of various GEO data mining tools and features
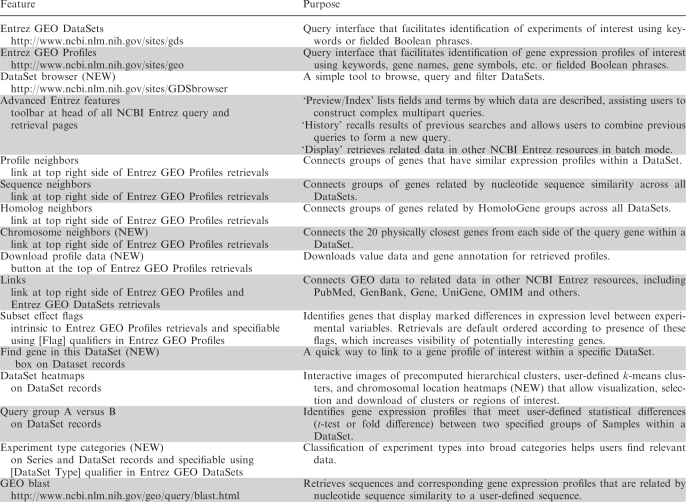 |
Features introduced within the last 2 years are labeled NEW.
Figure 2.

A schematic overview of query workflow, and how various features and tools are interlinked. A description of the location and purpose of many of these features is provided in Table 2.
NCBI's powerful Entrez (PubMed-like) search and linking system serve as the basis for most queries; Entrez GEO DataSets contains experiment-centered data and Entrez GEO Profiles contains gene-centered expression data. Relevant material is located simply by typing in keywords or fielded Boolean (AND, OR and NOT) phrases. Additionally, several auxiliary tools feed into Entrez, including the cluster heat maps and the ‘Query group A versus B’ tool.
A rich complement of Entrez links is generated to connect data to related information: inter-database links reciprocally connect GEO to other NCBI resources such as PubMed, GenBank and Gene; intra-database links connect genes related by expression pattern, chromosomal position or sequence. Entrez search retrievals can be sorted and filtered by various flags and criteria, and downloaded by various mechanisms. Advanced Entrez features allow generation of multipart fielded queries, or can join multiple queries to identify overlapping results.
GEO provides several graphical renderings that greatly facilitate interpretation and visualization of expression data, including:
interactive pre-calculated hierarchical and on-the-fly k-means/k-medians cluster heat map images that may hint at groups of coordinately regulated genes.
Expression profile charts that track the activity of one gene across all Samples in a DataSet. A breakdown of the experimental design is provided along the bottom of the chart, helping the user to quickly assess whether expression levels are shifting with experimental variables.
Thumbnail chart images provided on Entrez Profile retrievals that enable rapid visual profile scanning and comparison.
Value and probability distribution charts that provide rapid indication of how well normalized the data are.
Limited programmatic access is supported using a suite of programs called the Entrez Programming Utilities, or E-Utils. For users who need to perform more robust analyses, all GEO data are available for bulk download via anonymous FTP at ftp://ftp.ncbi.nih.gov/pub/geo/DATA/ and can be imported into external third-party software applications, e.g. the freely available GEOquery package for BioConductor (12).
CONCLUSIONS
NCBI's GEO public archive stores massive volumes of published high-throughput functional genomic data generated by the international research community. In addition to archiving data, tools are provided to assist users of all levels of expertise to quickly search, query, analyze, visualize and download these data. These features employ classic data reduction and filtering methods, succinct displays designed for human scanning, and extensive linking with disparate but related data sources.
Looking at the literature, it is apparent that GEO is used routinely as a primary data resource by the research community. Hundreds of third-party publications cite GEO data as evidence to support or complement independent studies, or use GEO data as the basis of statistical or analytical hypotheses or tools (http://www.ncbi.nlm.nih.gov/projects/geo/info/ucitations.html).
As high-throughput technologies advance, large-scale functional genomic datasets are becoming easier and cheaper to generate. However, a major challenge remains in translating diverse sets of functional genomic data into context, i.e. integrating these datasets with each other and, ultimately, making correlations with observable phenotypes. Collecting and archiving comprehensive ‘omic datasets in common formats at one public location like GEO is an important first step in facilitating such large-scale integrative analyses. It can be anticipated that a continued increase in availability of these datasets will contribute to our understanding of how the genome regulates and specifies cellular types, states and processes.
The GEO database and tools continue to undergo intensive development and modification aimed at enhancing the experiences of both data submitters and data consumers. The submission pipeline and data transfer mechanisms will continue to be upgraded, and we plan to develop additional data retrieval and mining features, particularly for the novice user.
FUNDING
Funding for open access charge: Intramural Research Program of the National Institutes of Health; National Library of Medicine.
Conflict of interest statement. None declared.
REFERENCES
- 1.Edgar R, Domrachev M, Lash AE. Gene Expression Omnibus: NCBI gene expression and hybridization array data repository. Nucleic Acids Res. 2002;30:207–210. doi: 10.1093/nar/30.1.207. [DOI] [PMC free article] [PubMed] [Google Scholar]
- 2.Wold B, Myers RM. Sequence census methods for functional genomics. Nat. Methods. 2008;5:19–21. doi: 10.1038/nmeth1157. [DOI] [PubMed] [Google Scholar]
- 3.Ball C, Brazma A, Causton H, Chervitz S, Edgar R, Hingamp P, Matese JC, Parkinson H, Quackenbush J, Ringwald M, et al. Standards for microarray data: an open letter. Environ. Health Perspect. 2004;112:A666–A667. doi: 10.1289/ehp.112-1277123. [DOI] [PMC free article] [PubMed] [Google Scholar]
- 4.Brazma A, Hingamp P, Quackenbush J, Sherlock G, Spellman P, Stoeckert C, Aach J, Ansorge W, Ball CA, Causton HC, et al. Minimum information about a microarray experiment (MIAME)-toward standards for microarray data. Nat. Genet. 2001;29:365–371. doi: 10.1038/ng1201-365. [DOI] [PubMed] [Google Scholar]
- 5.Chen X, Xu H, Yuan P, Fang F, Huss M, Vega VB, Wong E, Orlov YL, Zhang W, Jiang J, et al. Integration of external signaling pathways with the core transcriptional network in embryonic stem cells. Cell. 2008;133:1106–1117. doi: 10.1016/j.cell.2008.04.043. [DOI] [PubMed] [Google Scholar]
- 6.Ghildiyal M, Seitz H, Horwich MD, Li C, Du T, Lee S, Xu J, Kittler EL, Zapp ML, Weng Z, et al. Endogenous siRNAs derived from transposons and mRNAs in Drosophila somatic cells. Science. 2008;320:1077–1081. doi: 10.1126/science.1157396. [DOI] [PMC free article] [PubMed] [Google Scholar]
- 7.Meissner A, Mikkelsen TS, Gu H, Wernig M, Hanna J, Sivachenko A, Zhang X, Bernstein BE, Nusbaum C, Jaffe DB, et al. Genome-scale DNA methylation maps of pluripotent and differentiated cells. Nature. 2008;454:766–770. doi: 10.1038/nature07107. [DOI] [PMC free article] [PubMed] [Google Scholar]
- 8.Wheeler DL, Barrett T, Benson DA, Bryant SH, Canese K, Chetvernin V, Church DM, Dicuccio M, Edgar R, Federhen S, et al. Database resources of the National Center for Biotechnology Information. Nucleic Acids Res. 2008;36:D13–D21. doi: 10.1093/nar/gkm1000. [DOI] [PMC free article] [PubMed] [Google Scholar]
- 9.Barrett T, Troup DB, Wilhite SE, Ledoux P, Rudnev D, Evangelista C, Kim IF, Soboleva A, Tomashevsky M, Edgar R. NCBI GEO: mining tens of millions of expression profiles—database and tools update. Nucleic Acids Res. 2007;35:D760–D765. doi: 10.1093/nar/gkl887. [DOI] [PMC free article] [PubMed] [Google Scholar]
- 10.Barrett T, Edgar R. Reannotation of array probes at NCBI's GEO database. Nat. Methods. 2008;5:117. doi: 10.1038/nmeth0208-117b. [DOI] [PubMed] [Google Scholar]
- 11.Edgar R, Barrett T. NCBI GEO standards and services for microarray data. Nat. Biotechnol. 2006;24:1471–1472. doi: 10.1038/nbt1206-1471. [DOI] [PMC free article] [PubMed] [Google Scholar]
- 12.Davis S, Meltzer PS. GEOquery: a bridge between the Gene Expression Omnibus (GEO) and BioConductor. Bioinformatics. 2007;23:1846–1847. doi: 10.1093/bioinformatics/btm254. [DOI] [PubMed] [Google Scholar]